Comparative Study
. 2018 Apr 16;13(4):e0195692.
doi: 10.1371/journal.pone.0195692. eCollection 2018.

Reconstruction of a 10-mm-long median nerve gap in an ischemic environment using autologous conduits with different patterns of blood supply: A comparative study in the rat

Affiliations
Comparative Study

Reconstruction of a 10-mm-long median nerve gap in an ischemic environment using autologous conduits with different patterns of blood supply: A comparative study in the rat

Diogo Casal et al. PLoS One. .

Abstract

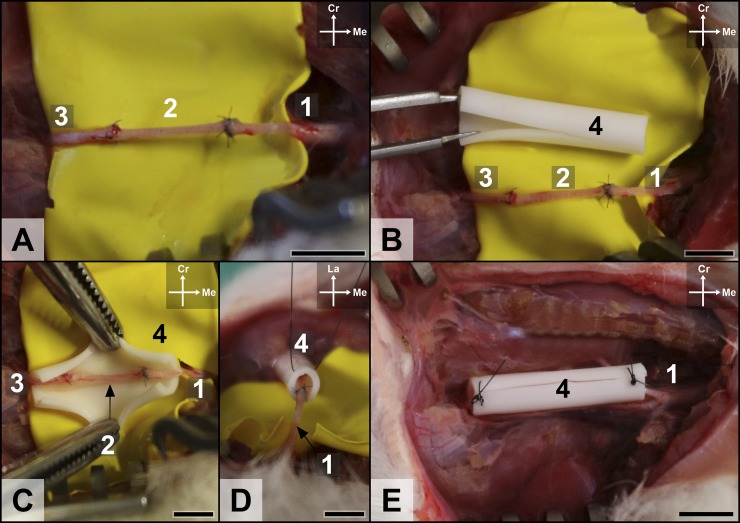
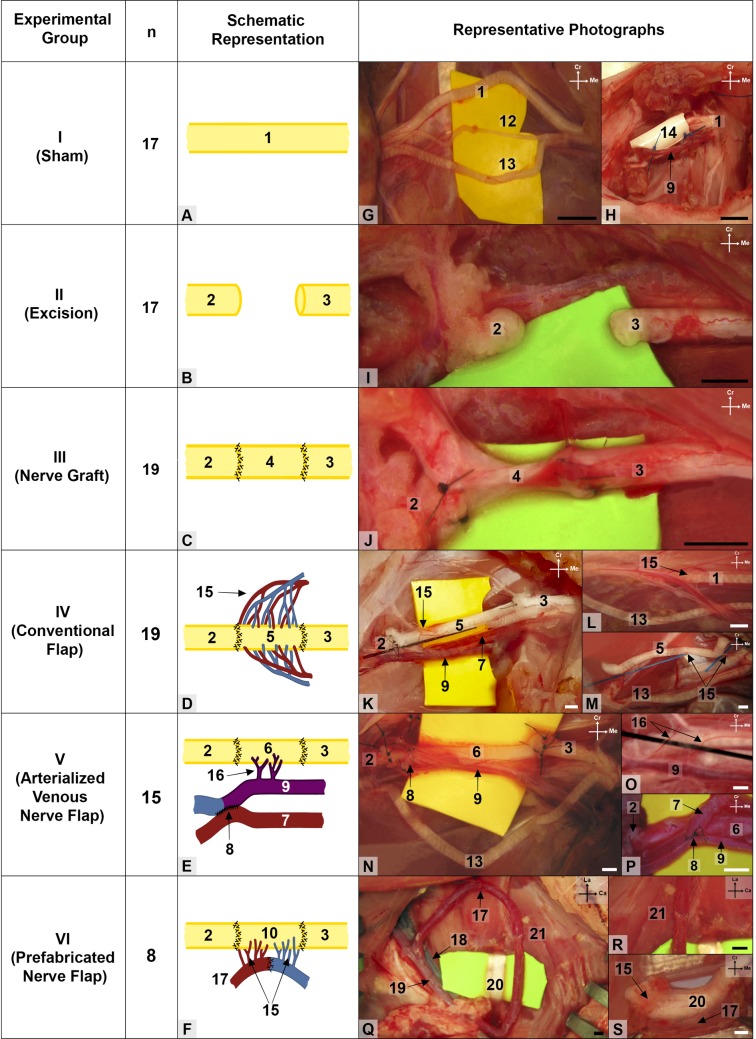
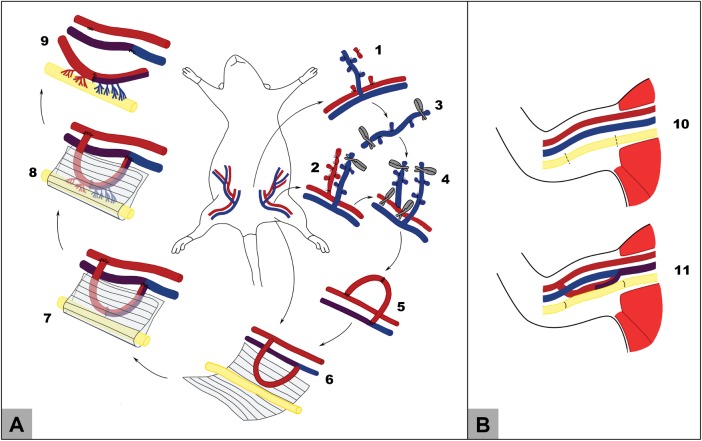
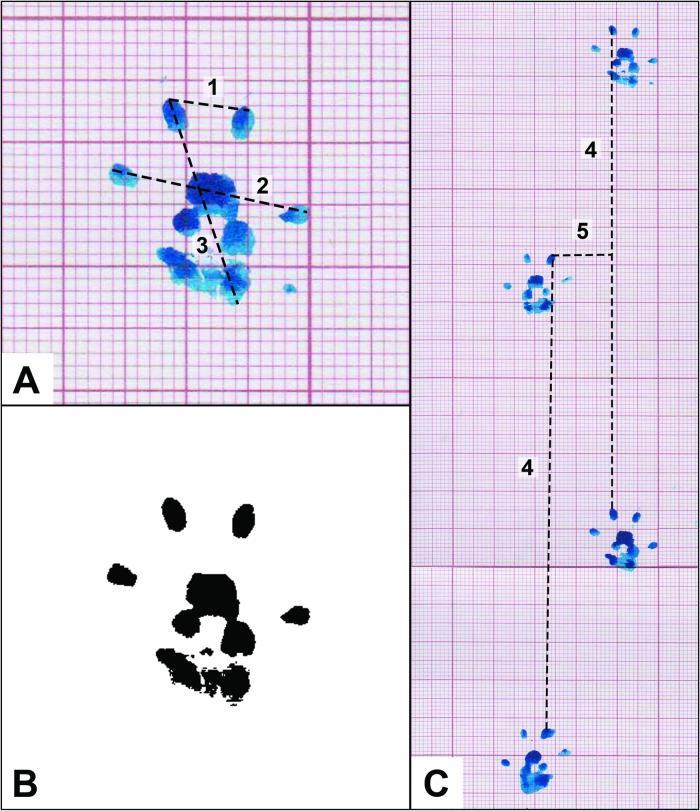
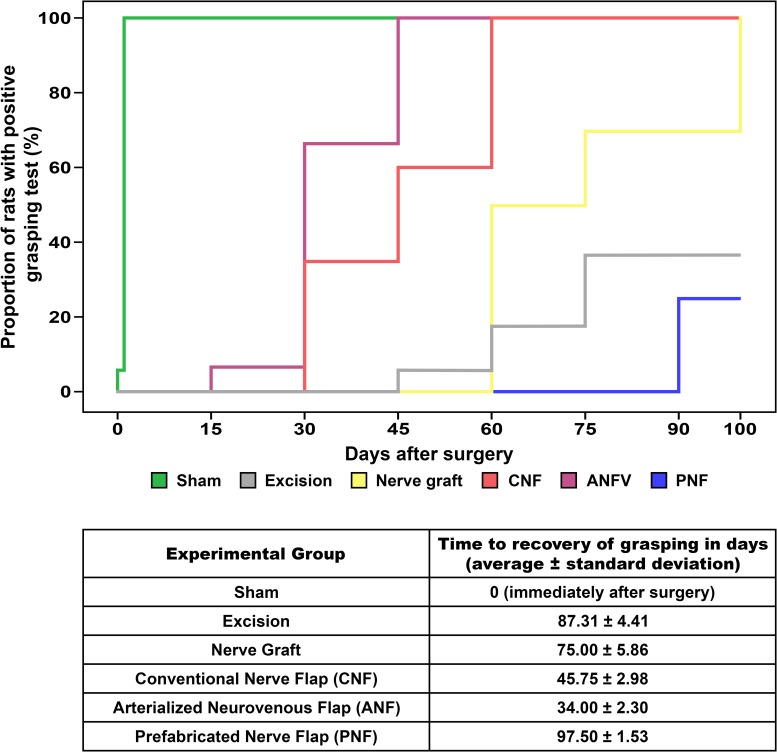
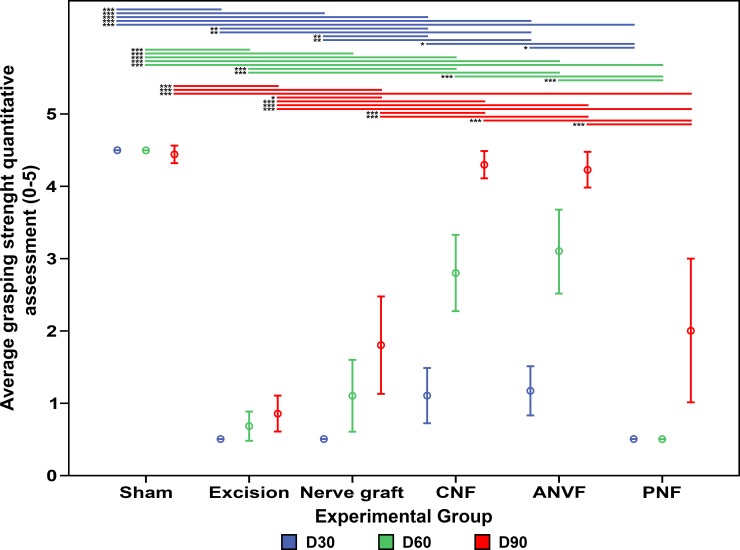
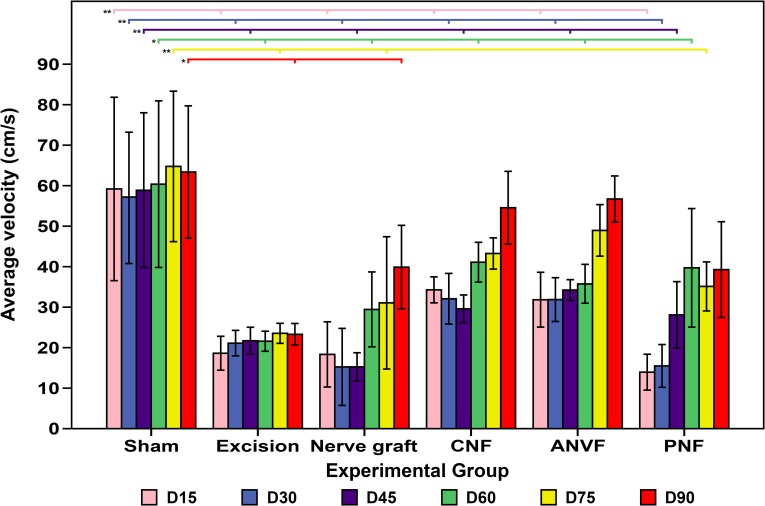
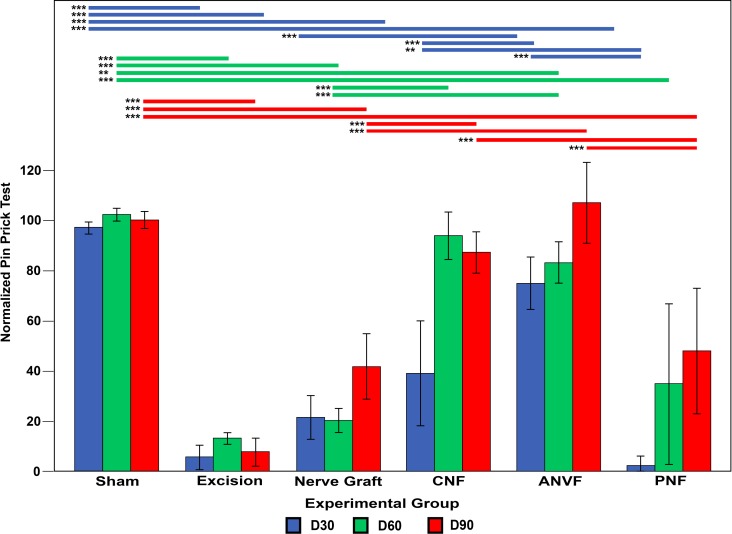
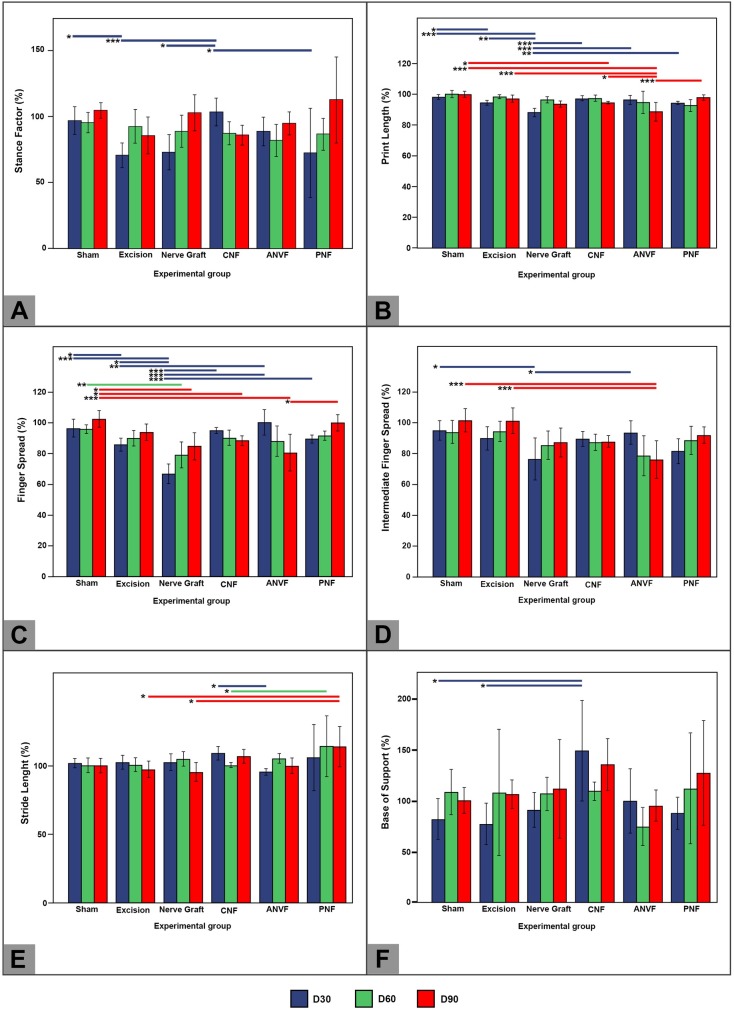
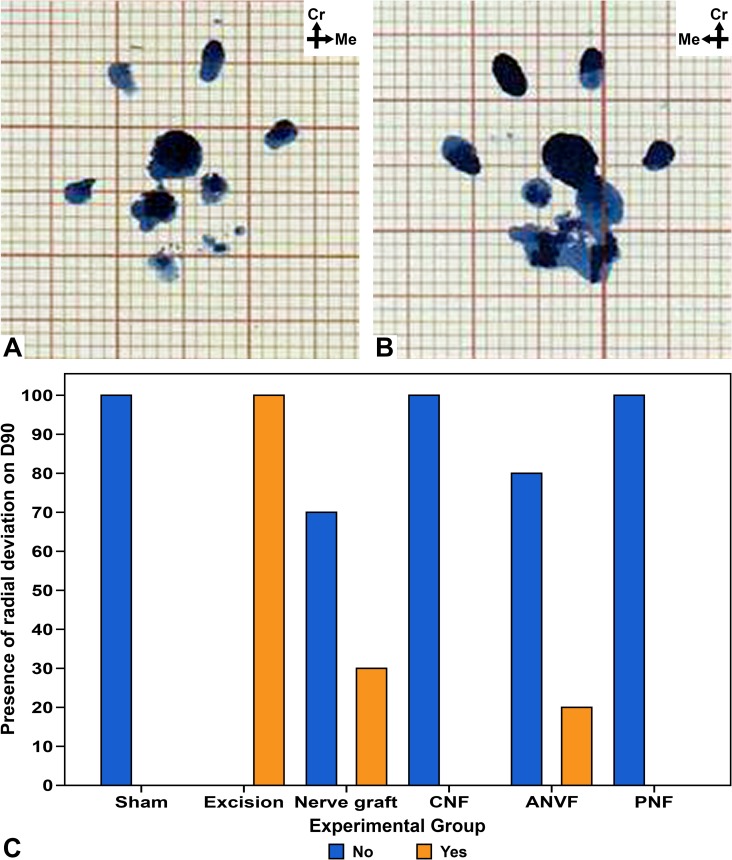
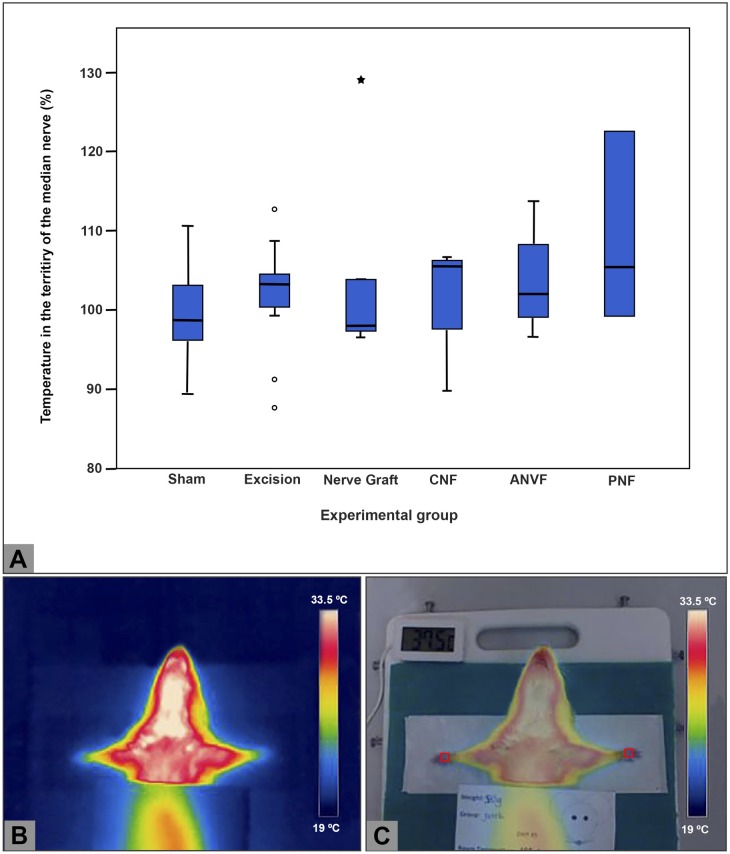
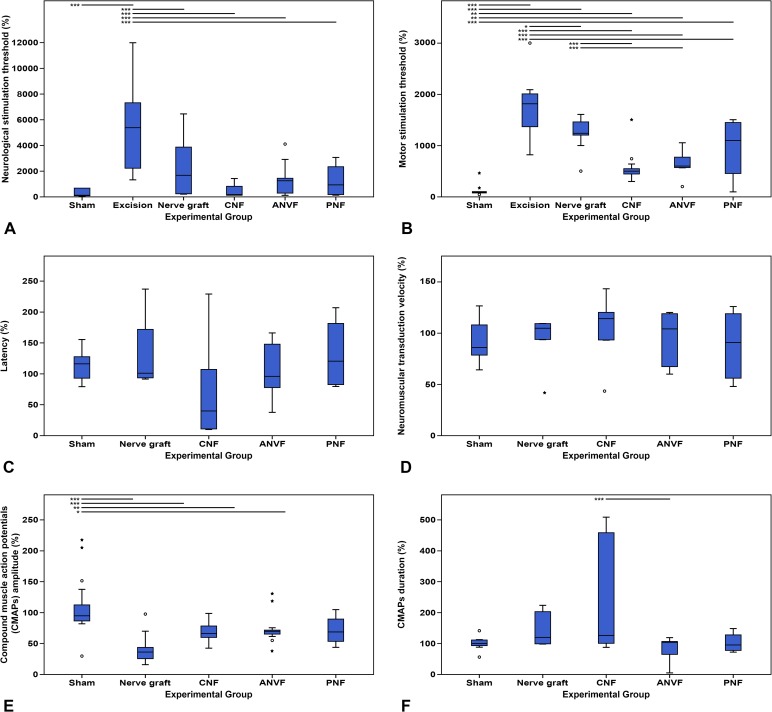
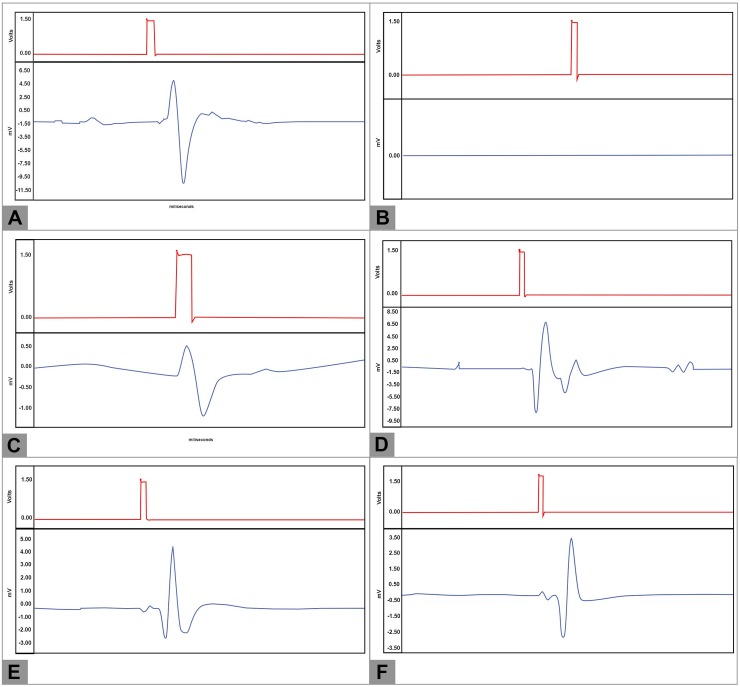
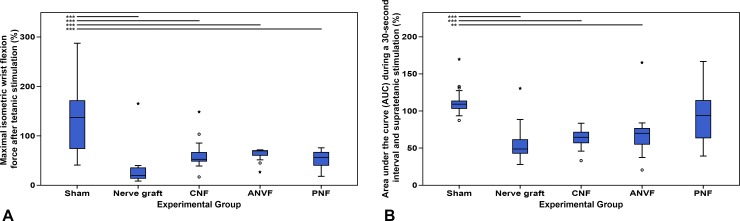
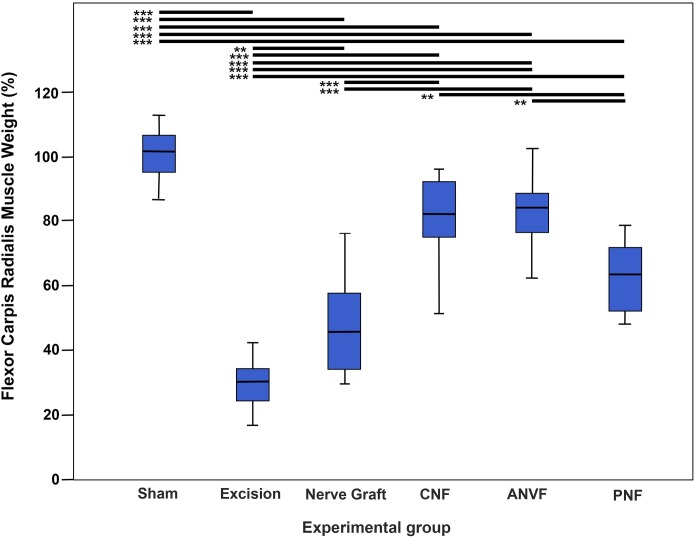
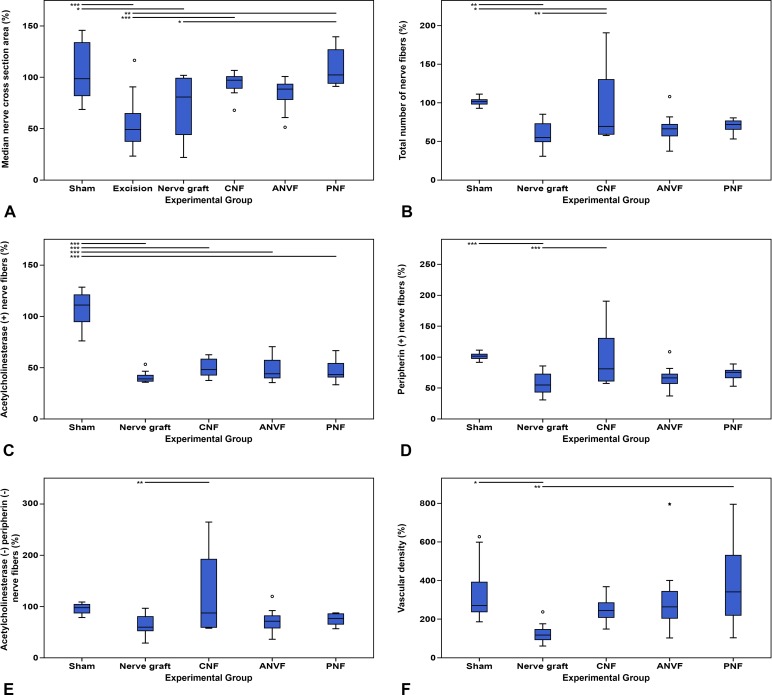
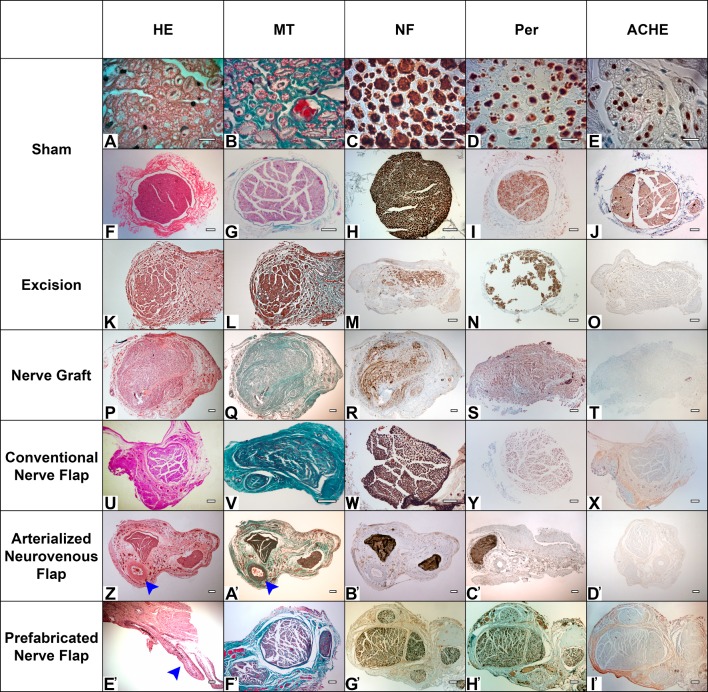
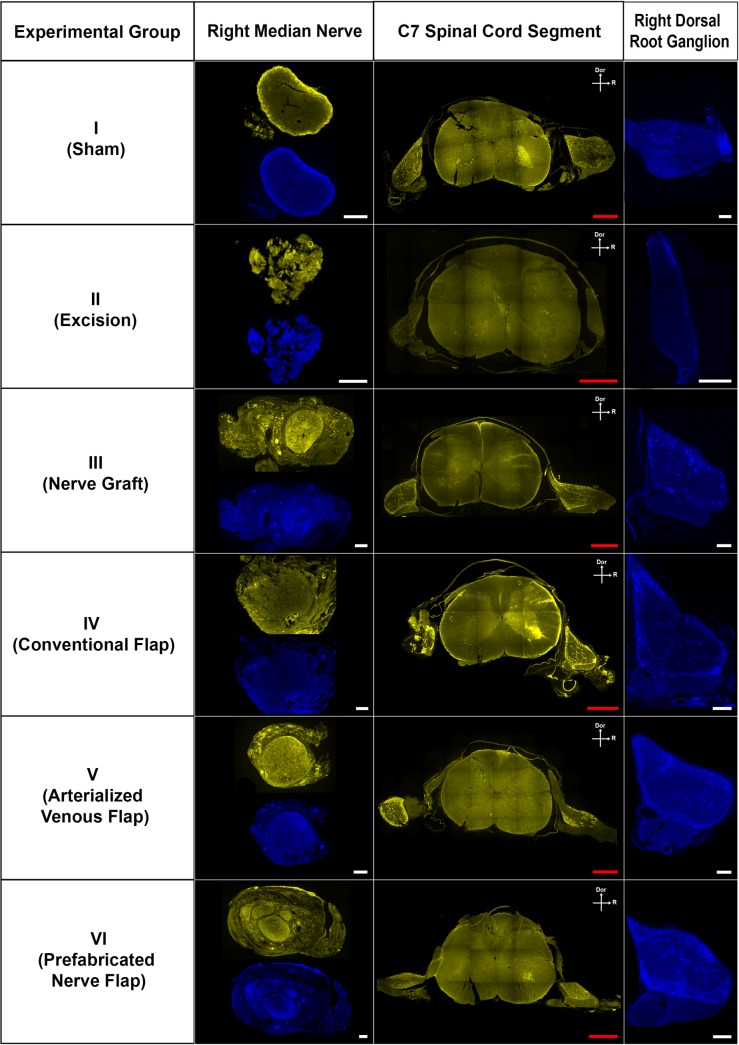
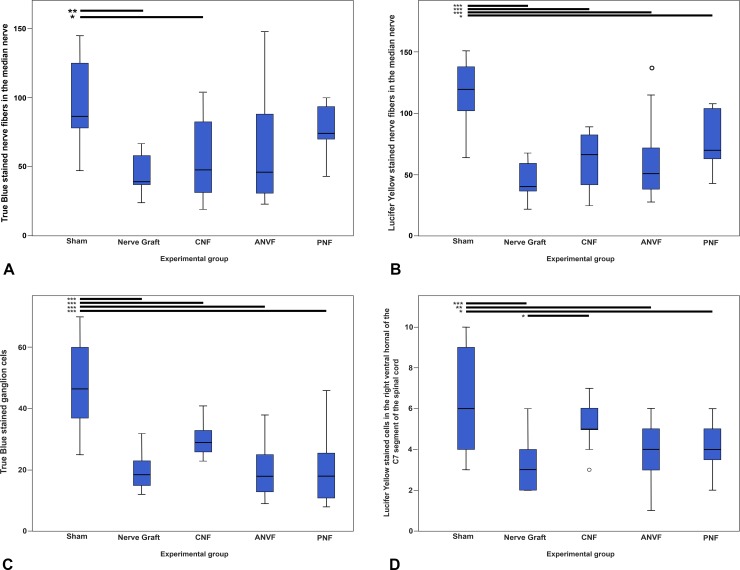
The aim of this study was to evaluate in the Wistar rat the efficacy of various autologous nerve conduits with various forms of blood supply in reconstructing a 10-mm-long gap in the median nerve (MN) under conditions of local ischemia. A 10-mm-long median nerve defect was created in the right arm. A loose silicone tube was placed around the nerve gap zone, in order to simulate a local ischemic environment. Rats were divided in the following experimental groups (each with 20 rats): the nerve Graft (NG) group, in which the excised MN segment was reattached; the conventional nerve flap (CNF) and the arterialized neurovenous flap (ANVF) groups in which the gap was bridged with homonymous median nerve flaps; the prefabricated nerve flap (PNF) group in which the gap was reconstructed with a fabricated flap created by leaving an arteriovenous fistula in contact with the sciatic nerve for 5 weeks; and the two control groups, Sham and Excision groups. In the latter group, the proximal stump of the MN nerve was ligated and no repair was performed. The rats were followed for 100 days. During this time, they did physiotherapy. Functional, electroneuromyographic and histological studies were performed. The CNF and ANVF groups presented better results than the NG group in the following assessments: grasping test, nociception, motor stimulation threshold, muscle weight, and histomorphometric evaluation. Radial deviation of the operated forepaw was more common in rats that presented worse results in the other outcome variables. Overall, CNFs and ANVFs produced a faster and more complete recovery than NGs in the reconstruction of a 10-mm-long median nerve gap in an ischemic environment in the Wistar rat. Although, results obtained with CNFs were in most cases were better than ANVFs, these differences were not statistically significant for most of the outcome variables.


Conflict of interest statement

Competing Interests: The authors have declared that no competing interests exist.

Figures

Fig 1
Fig 1. Representative intraoperative photographs of the model used to simulate ischemia surrounding the median nerve gap in the right forepaw of a rat in the nerve graft experimental group.
(A) The nerve defect bridged with the autologous inverted median nerve graft.(B and C) A silicone rod is longitudinally opened and placed around the median nerve reconstruction. (D) The silicone sheath is secured with interrupted 6–0 Nylon stitches places at both ends. (E) Final appearance of the nerve reconstruction site before wound closure.1, proximal stump of the median nerve; 2, autologous median nerve graft; 3, distal stump of the median nerve; 4, silicone rod place around the nerve gap to simulate an ischemic environment.Cr, Cranial; Me, Medial. Calibration bar = 1 cm.
Fig 2
Fig 2. Experimental groups’ schematic representation and representative photographs.
(A to F) Schematic drawings of the different methods of bridging the median nerve gap in the various experimental groups. (G to S) photographs of representative intra-operative images. All images represent the right forelimb with the exception of (Q) which represents the left groin region. 1, median nerve; 2, distal stump of the median nerve; 3, proximal stump of the median nerve; 4, autologous median nerve graft; 5, median nerve conventional flap; 6, arterialized neurovenous flap; 7, brachial artery; 8, arterio-venous anastomosis; 9, brachial vein; 10, prefabricated nerve flap; 11, arterio-venous fistula used to produce the prefabricated nerve flap; 12, medial antebrachial nerve; 13, ulnar nerve; 14, silicone rod place around the nerve gap to simulate an ischemic environment; 15, vasa nervorum to median nerve flap; 16, vena nervorum; 17, arteriovenous loop; 18, femoral vein; 19, femoral artery Ca, Caudal; Cr, Cranial; La, Lateral; Me, Medial. Calibration bar = 1 mm.
Fig 3
Fig 3. Conventional flap pre-fabrication and transfer.
(A) Prefabrication of the flap in the left thigh. (B) Insetting of the flap in the recipient area in the right arm. 1. An inverted “T” incision is performed in the most caudal aspect of the ventral region of the abdomen of the rat, with the axial portion crossing immediately cranial to the pubic symphysis and with the longitudinal component extending from this point cranially for 3 cm. 2. The right superficial caudal epigastric vein is dissected from the homonymous artery and the caudal epigastric nerve during its entire length, including also part of the its lateral afferent vein. 3. The venous segment is harvested and its origin and termination sites are ligated with interrupted 9/0 Nylon stitches. 4. The venous conduit is inverted and its terminal-laterally anastomosed to the left femoral artery using an interrupted 11/0 Nylon suture. 5. The two epigastric veins are terminal-terminally anastomosed with interrupted 11/0 Nylon stitches, producing and arterial-venous fistula; 6. The left sciatic nerve is exposed through a ventral approach in the medial aspect of the thigh, in the space between the gracilis muscle, placed laterally, and the semimembranosus muscle, located medially. The medial femoral circumflex vessels are ligated and divided. The arterial-venous fistula is placed over the ventrally exposed left sciatic nerve. A silicon sheath is placed around the nerve and the arterial-venous fistula. 7. The silicone sheath is folded on itself and maintained in place with interrupted 5/0 Nylon stitches. The surgical wounds are closed with interrupted 5/0 Nylon stitches. 8. The sciatic nerve and fistula are maintained in contact for 5 weeks, allowing the development of vascular connections between the fistula and the sciatic nerve. 9. After five weeks, a conventional flap including a segment of the sciatic nerve measuring approximately 15 mm has been fabricated. 10. A 10-mm-long segment of the right median nerve is excised. 11. The prefabricated nerve flap is inset in the region of the median nerve defect. Excessive neural tissue is trimmed at both ends. The arterial end of the arterial-venous fistula was terminal-laterally anastomosed to the distal portion of the brachial artery and the venous end of the fistula was terminal-laterally anastomosed to the proximal aspect of the brachial vein using interrupted 12/0 Nylon stitches. Neural anastomoses were performed using interrupted epineural 11/0 Nylon sutures.
Fig 4
Fig 4. Walking tracks measurements using forepaw impressions.
(A) Photograph of a typical print of the left forepaw (uninjured). (B) Contrast-enhanced image of the photograph in Fig 3A, using the software Fiji®. Similar images were used for measurement purposes, namely of determination of the stance factor (paw impression area on the paper sheet). (C) Typical forepaw prints of a rat in the nerve graft group. 1, Intermediate finger spread factor: widest width between the second and third fingers; 2, Finger spread factor: widest width of the paw impression; 3, Print length factor: longest length of the paw impression; 4, Stride length: distance between homologous points of successive paw impressions on a given side; 5, Base of support: perpendicular distance between the central portion of the paw impression and the direction of movement.
Fig 5
Fig 5. Time to recovery of grasping in the operated limb.
Fastest recovery of grasping was observed in the CNF and ANVF groups (p<0.001).
Fig 6
Fig 6. Qualitative assessment of grasping strength in the operated limb in the different experimental groups 30, 60 and 90 days after the reconstruction of the median nerve gap.
Vertical bars represent 95% confidence intervals. Horizontal lines in the upper portion of the figure indicate statistically significant differences between groups (p<0.05). *, p<0.05; **, p<0.01; ***, p<0.001.
Fig 7
Fig 7. Average velocity in the ladder running test in the different experimental groups during the experiment.
Vertical bars represent 95% confidence intervals. Horizontal lines in the upper portion of the figure indicate statistically significant differences between groups on the 90th day postoperatively (p<0.05). *, p<0.05; **, p<0.01; ***, p<0.001.
Fig 8
Fig 8. Nociceptive evaluation using cumulative pin prick test results in the operated forelimb normalized to the contralateral limb in the different experimental groups throughout the experiment.
Vertical bars represent 95% confidence intervals. Horizontal lines in the upper portion of the figure indicate statistically significant differences between experimental groups (p<0.05). **, p<0.01; ***, p<0.001.
Fig 9
Fig 9. Walking track analysis of the right forelimb (operated paw) of rats in the different experimental groups throughout the experience.
Values are expressed as percentages of averages normalized to the contralateral side. (A) Stance factor. (B) Print length; (C) Finger spread factor; (D) Intermediate finger spread factor; (E) Stride length; (F) Base of support. Vertical bars represent 95% confidence intervals. Horizontal lines in the upper portion of the figure indicate statistically significant differences between experimental groups (p<0.05). *, p<0.05; **, p<0,01; ***, p<0.001.
Fig 10
Fig 10. Presence of radial deviation in the walking tracks of the operated forepaws in the different experimental groups at the end of the experiment.
(A) Left forepaw print of a rat in the nerve graft group, showing a normal impression. (B) Right forepaw print of the same rat, showing radial deviation of the paw. Radial deviation was defined by radial (medial) rotation of first four digits, as well an angle between the middle point of the most caudal aspect of the hand and the middle point of the most cranial aspect of the second and fourth digits that was at least 10° smaller comparatively to the contralateral side. (C) Bar graph showing the proportion of rats with radial deviation of the operated forepaws at the end of the experiment.
Fig 11
Fig 11. Temperature on the surface of the skin territory of the median nerve.
(A) Boxplot graphic illustrating the average temperature in the skin territory of the right median nerve relatively to that of the contralateral side. Temperature measurements were made using infra-red thermography. (B) Typical thermography image. (C) Image resulting from the overlap of the thermography image and of the digital photographic image. This allows to evaluate the temperature in the territory of the median nerve.
Fig 12
Fig 12. Electroneuromyographic assessment of the right forelimb (operated paw) of rats in the different experimental groups throughout the experience.
Values are expressed as percentages of averages normalized to the homologous contralateral side average values. (A) Neurological stimulation threshold; (B) Motor stimulation threshold; (C) Latency; (D) Neuromuscular transduction velocity; (E) Compound muscle action potentials (CMAPs) amplitude; (F) CMAPs duration. Vertical lines represent 95% confidence intervals. Horizontal lines in the upper portion of the figure indicate statistically significant differences between experimental groups (p<0.05). *, p<0.05; **, p<0,01; ***, p<0.001.
Fig 13
Fig 13. Typical compound muscle action potentials patterns in the different experimental groups.
(A) Sham group and left paw of the rats in the other experimental groups. (B) Excision group. (C) Conventional nerve flap group. (D) Arterialized neurovenous flap group. (E) Prefabricated nerve flap group.
Fig 14
Fig 14. Muscle strength evaluation at the end of the experiment in the operated forelimb in the different experimental groups.
(A) Maximal isometric wrist flexion force after tetanic stimulation. (B) Area under the curve (AUC) during a 30-second interval and supratetanic stimulation. Values are expressed as percentages of averages normalized to the homologous contralateral side average values. Vertical lines represent 95% confidence intervals. Horizontal lines in the upper portion of the figure indicate statistically significant differences between experimental groups (p<0.05). **, p<0,01; ***, p<0.001.
Fig 15
Fig 15. Flexor carpi radialis muscle weight of the right forelimb (operated paw) of rats in the different experimental groups.
Values are expressed as percentages of averages normalized to the homologous contralateral side average values. Vertical lines represent 95% confidence intervals. Horizontal lines in the upper portion of the figure indicate statistically significant differences between experimental groups (p<0.05). p<0,01; ***, p<0.001.
Fig 16
Fig 16
Photographs of the flexor carpi radialis muscle illustrating muscle gross appearance in the different experimental groups on the operated side (R, right) and on the non-operated side (L, left). (A) Excision group. (B) Nerve graft group. (C) Conventional nerve flap group. (D) Arterialized neurovenous flap group. (E) Prefabricated nerve flap group.
Fig 17
Fig 17. Histomorphometric evaluation of the right median nerve distally to the repair zone in the different experimental groups.
Results are expressed as a percentage of the normal, contralateral side and are given as the mean. (A) Median nerve cross section area distally to the repair zone. (B) Total number of fibers (stained for neurofilaments) distally to the repair zone. (C) Acetylcholinesterase positive (+) nerve fibers distally to the repair zone. (D) Peripherin positive (+) nerve fibers distally to the repair zone. (E) Acetylcholinesterase negative (-) and peripherin negative (-) nerve fibers distally to the repair zone. (F) Vascular density in a cross section of the middle portion of the reconstructed nerve defect. Vertical lines represent 95% confidence intervals. Horizontal lines in the upper portion of the figure indicate statistically significant differences between experimental groups (p<0.05). *, p<0.05; **, p<0,01; ***, p<0.001.
Fig 18
Fig 18. Representative histological features of the different experimental groups.
HE, hematoxylin-eosin staining; MT, Masson’s trichrome staining; NF, neurofilament immunohistochemical staining; Per, peripherin immunohistochemical staining; ACHE, acetylcholinesterase immunohistochemical staining. Calibration bar (A to E) = 10 μm Calibration bar (F to I’) = 100 μm.
Fig 19
Fig 19. Fluorescence microscopy photographs of cross sections of the right median nerve proximally to the lesion, of the C7 spinal cord segment, and of the C7 the right dorsal root ganglion in the different experimental groups.
Dor, dorsal; R, right Red calibration bar = 1 mm White calibration bar = 100 μm.
Fig 20
Fig 20
Typical high amplification fluorescence microscopy photographs of cross sections of the C7 the right dorsal root ganglion (A and C) showing ganglion cells stained with the True Blue® tracer and of motoneurons in the ventral horn of the spinal cord stained with the lucifer yellow (LY) ® tracer (B and D). Intracytoplasmic inclusions of these two markers are clearly visible in a rat of the Sham group. Calibration bar = 100 μm.
Fig 21
Fig 21. Semi quantitative evaluation of retrograde marking of the right median nerve proximally to the lesion site, of the right C7 dorsal ganglion and of the right ventral horn of the spinal cord at the C7 level in the different experimental groups.
(A) Average number of True Blue diaceturate stained fibers in the right median nerve proximally to the repair site. (B) Average number of Lucifer Yellow CH dilithium stained fibers in the right median nerve proximally to the repair site. (C) Average number of True Blue diaceturate stained ganglion cells in the right C/ dorsal ganglion. (D) Average number of Lucifer Yellow CH dilithium stained cells in the ventral horn of the C7 spinal cord segment. Vertical lines represent 95% confidence intervals. Horizontal lines in the upper portion of the figure indicate statistically significant differences between experimental groups (p<0.05). *, p<0.05; **, p<0,01; ***, p<0.001.

Similar articles

Cited by

References

    1. Desouches C, Alluin O, Mutaftschiev N, Dousset E, Magalon G, Boucraut J, et al. [Peripheral nerve repair: 30 centuries of scientific research]. Revue neurologique. 2005;161(11):1045–59. Epub 2005/11/17. . - PubMed
    1. Boyd KU, Fox IK. Nerve repair and grafting In: Mackinnon SE, editor. Nerve surgery. 1. First ed New York: Thieme; 2015. p. 75–100.
    1. Wood MJ, Johnson PJ, Myckatyn TM. Anatomy and physiology for the peripheral nerve surgeon In: Mackinnon SE, Yee A, editors. Nerve Surgery. 1. First ed New York: Thieme; 2015. p. 1–40.
    1. Missios S, Bekelis K, Roberts DW. Neurosurgery in the Byzantine Empire: the contributions of Paul of Aegina (625–690 AD). Journal of neurosurgery. 2014;120(1):244–9. Epub 2013/09/17. doi: 10.3171/2013.8.JNS13550 . - DOI - PubMed
    1. Philipeaux J, Vulpian A. Note sur des essais de greffe d'un troncon du nerf lingual entre les deux bouts du nerf hypoglosse, apres excision d'un segment de ce dernier nerf. Arch Physiol Norm Pathol. 1870;3:618–20.

Publication types

LinkOut - more resources