

Why do placentas evolve? Evidence for a morphological advantage during pregnancy in live-bearing fish
- PMID: 29659620
- PMCID: PMC5901924
- DOI: 10.1371/journal.pone.0195976
Why do placentas evolve? Evidence for a morphological advantage during pregnancy in live-bearing fish
Abstract
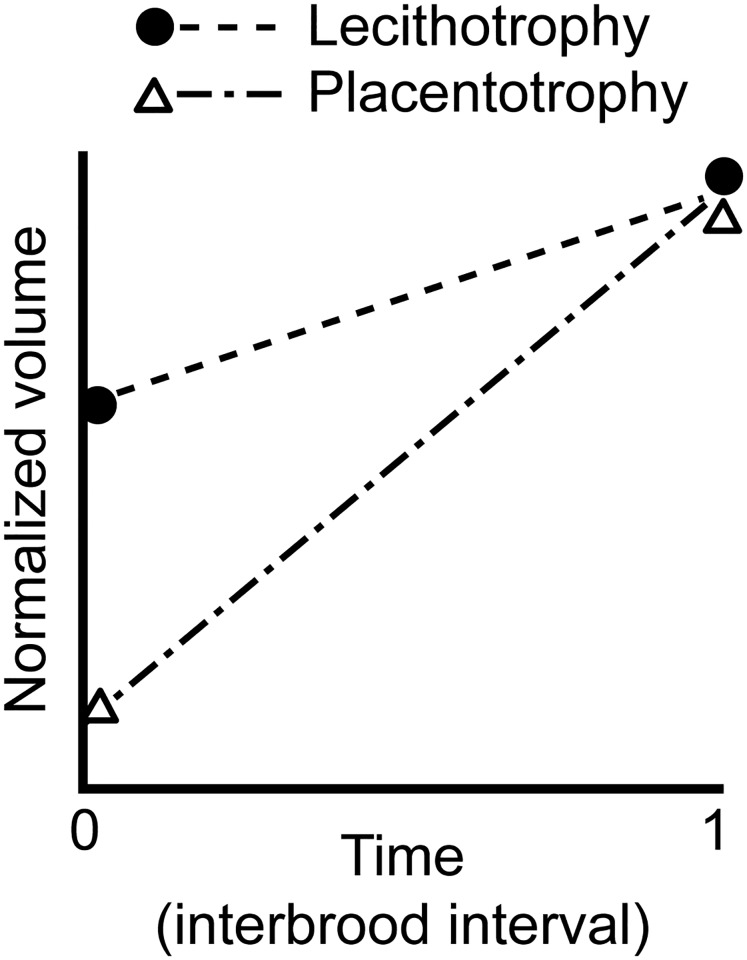
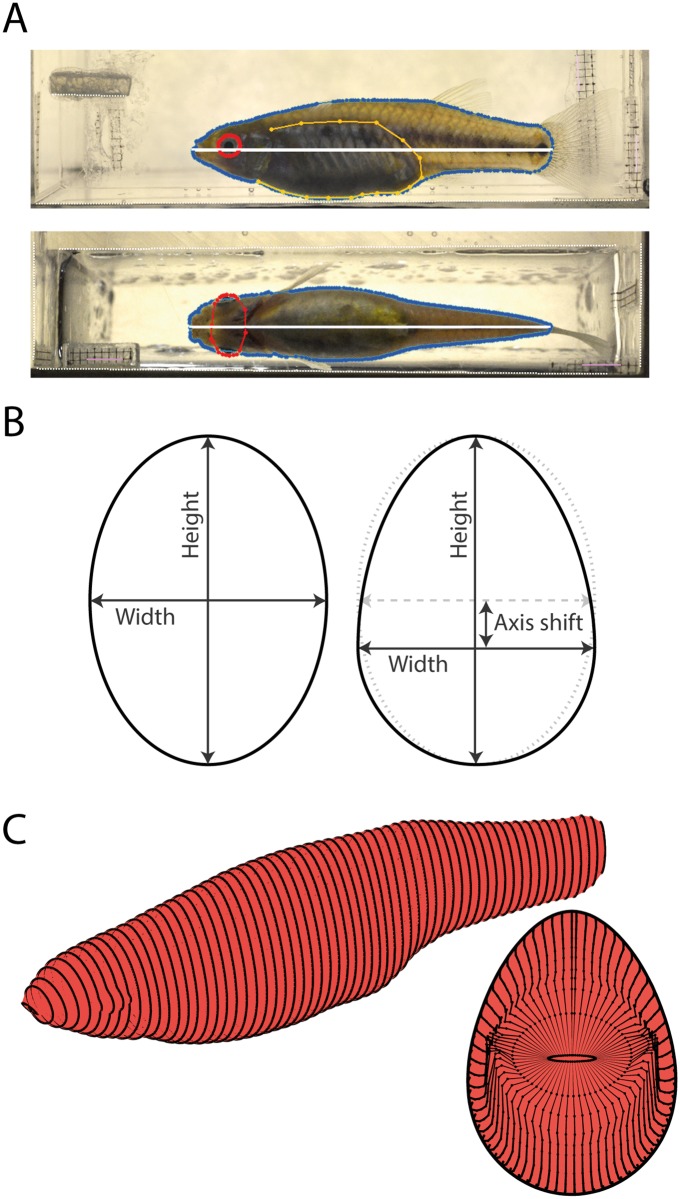
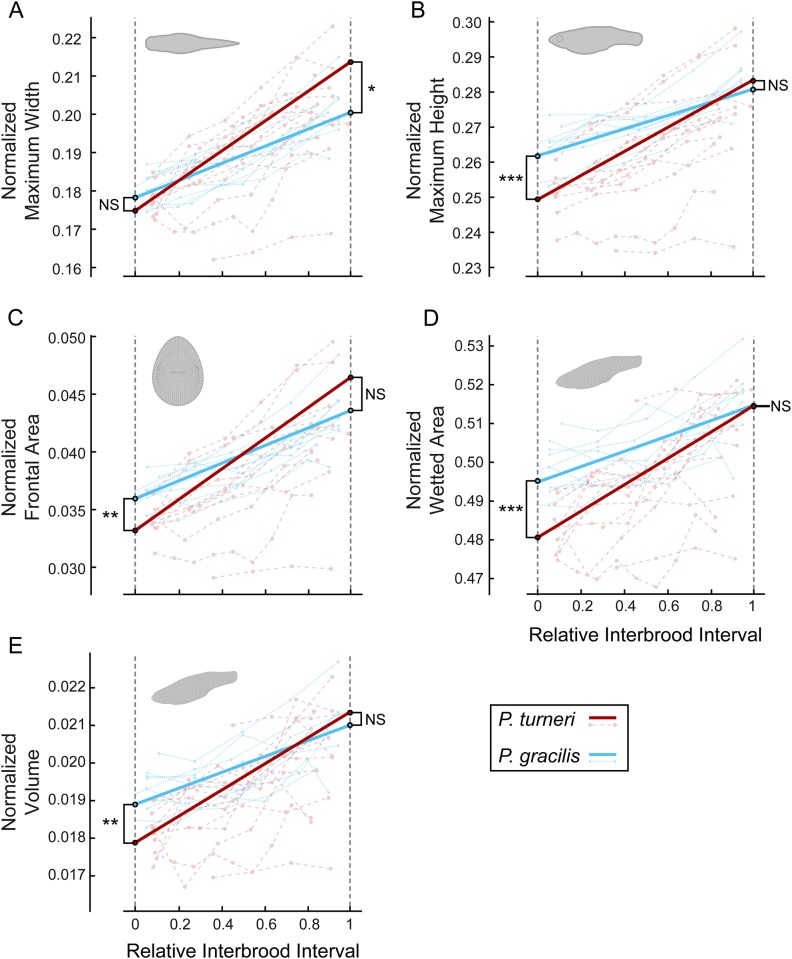
A live-bearing reproductive strategy can induce large morphological changes in the mother during pregnancy. The evolution of the placenta in swimming animals involves a shift in the timing of maternal provisioning from pre-fertilization (females supply their eggs with sufficient yolk reserves prior to fertilization) to post-fertilization (females provide all nutrients via a placenta during the pregnancy). It has been hypothesised that this shift, associated with the evolution of the placenta, should confer a morphological advantage to the females leading to a more slender body shape during the early stages of pregnancy. We tested this hypothesis by quantifying three-dimensional shape and volume changes during pregnancy and in full-grown virgin controls of two species within the live-bearing fish family Poeciliidae: Poeciliopsis gracilis (non-placental) and Poeciliopsis turneri (placental). We show that P. turneri is more slender than P. gracilis at the beginning of the interbrood interval and in virgins, and that these differences diminish towards the end of pregnancy. This study provides the first evidence for an adaptive morphological advantage of the placenta in live-bearing fish. A similar morphological benefit could drive the evolution of placentas in other live-bearing (swimming) animal lineages.
Conflict of interest statement
Figures
Similar articles
-
Maternal size and body condition predict the amount of post-fertilization maternal provisioning in matrotrophic fish.Ecol Evol. 2018 Dec 11;8(24):12386-12396. doi: 10.1002/ece3.4542. eCollection 2018 Dec. Ecol Evol. 2018. PMID: 30619553 Free PMC article.
-
Tissue-Specific Transcriptome for Poeciliopsis prolifica Reveals Evidence for Genetic Adaptation Related to the Evolution of a Placental Fish.G3 (Bethesda). 2018 Jul 2;8(7):2181-2192. doi: 10.1534/g3.118.200270. G3 (Bethesda). 2018. PMID: 29720394 Free PMC article.
-
Analysis of expressed sequence tags from the placenta of the live-bearing fish Poeciliopsis (Poeciliidae).J Hered. 2011 May-Jun;102(3):352-61. doi: 10.1093/jhered/esr002. Epub 2011 Feb 21. J Hered. 2011. PMID: 21339338
-
Evolution of viviparous reproduction in Paleozoic and Mesozoic reptiles.Int J Dev Biol. 2014;58(10-12):935-48. doi: 10.1387/ijdb.150087db. Int J Dev Biol. 2014. PMID: 26154334 Review.
-
A review of the evolution of viviparity in lizards: structure, function and physiology of the placenta.J Comp Physiol B. 2006 Mar;176(3):179-89. doi: 10.1007/s00360-005-0048-5. Epub 2005 Dec 7. J Comp Physiol B. 2006. PMID: 16333627 Review.
Cited by
-
Maternal size and body condition predict the amount of post-fertilization maternal provisioning in matrotrophic fish.Ecol Evol. 2018 Dec 11;8(24):12386-12396. doi: 10.1002/ece3.4542. eCollection 2018 Dec. Ecol Evol. 2018. PMID: 30619553 Free PMC article.
-
Superfetation reduces the negative effects of pregnancy on the fast-start escape performance in live-bearing fish.Proc Biol Sci. 2019 Dec 4;286(1916):20192245. doi: 10.1098/rspb.2019.2245. Epub 2019 Nov 27. Proc Biol Sci. 2019. PMID: 31771468 Free PMC article.
-
Coasting in live-bearing fish: the drag penalty of being pregnant.J R Soc Interface. 2019 Feb 28;16(151):20180714. doi: 10.1098/rsif.2018.0714. J R Soc Interface. 2019. PMID: 30958187 Free PMC article.
-
Repeated independent origins of the placenta reveal convergent and divergent organ evolution within a single fish family (Poeciliidae).Sci Adv. 2023 Aug 25;9(34):eadf3915. doi: 10.1126/sciadv.adf3915. Epub 2023 Aug 23. Sci Adv. 2023. PMID: 37611099 Free PMC article.
-
Sexual Selection in Mosquitofish: Differences in the Use of Mating Cues Between Sexes.Animals (Basel). 2025 May 21;15(10):1489. doi: 10.3390/ani15101489. Animals (Basel). 2025. PMID: 40427366 Free PMC article.
References
-
- Mossman HW. Comparative morphogenesis of the fetal membranes and accessory uterine structures. Contrib Embryol. 1937;26: 129–246. - PubMed
-
- Wourms JP. Viviparity: the maternal-fetal relationships in fishes. Am Zool. 1981;21: 473–515.
-
- Wourms JP, Grove BD, Lombardi J. The maternal-embryonic relationship in viviparous fishes In: Hoar WS, Randal DJ, editors. Fish Physiology. New York: Academic Press; 1988. pp. 1–134.
-
- Wake MH. Evolutionary Scenarios, Homology and Convergence of Structural Specializations for Vertebrate Viviparity. Am Zool. 1992;32: 256–263.
-
- Blackburn DG. Evolution of vertebrate viviparity and specializations for fetal nutrition: A quantitative and qualitative analysis. J Morphol. 2015;276: 961–990. doi: 10.1002/jmor.20272 - DOI - PubMed
Publication types
MeSH terms
LinkOut - more resources
Full Text Sources
Other Literature Sources
