. 2018 Jun 28;122(1):23-43.
doi: 10.1093/aob/mcy043.

Depletion of sucrose induces changes in the tip growth mechanism of tobacco pollen tubes

Affiliations

Depletion of sucrose induces changes in the tip growth mechanism of tobacco pollen tubes

Luigi Parrotta et al. Ann Bot. .

Abstract

Background and aims: Pollen tubes are rapidly growing, photosynthetically inactive cells that need high rates of energy to support growth. Energy can derive from internal and external storage sources. The lack of carbon sources can cause various problems during pollen tube growth, which in turn could affect the reproduction of plants.

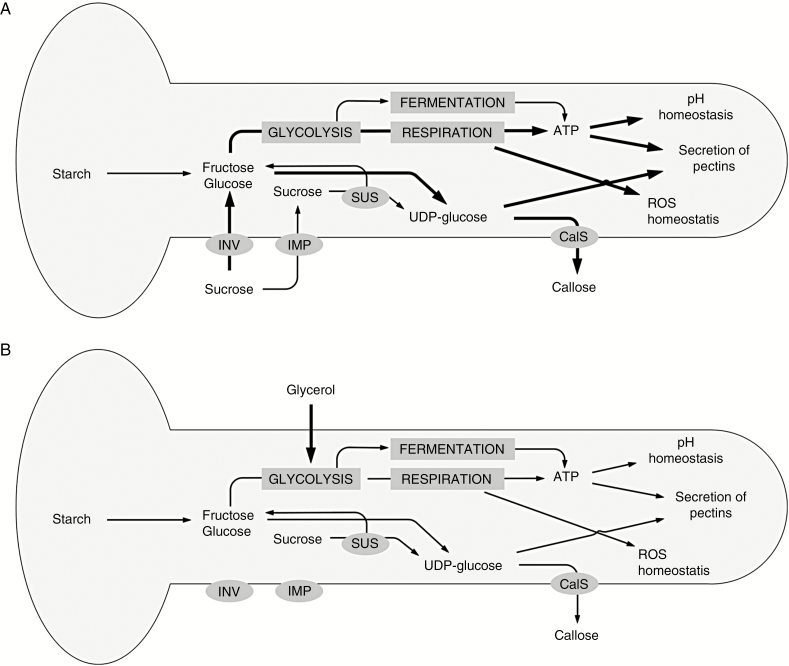
Methods: We analysed the effects of energy deficiency on the development of Nicotiana tabacum pollen tubes by replacing sucrose with glycerol in the growth medium. We focused on cell growth and related processes, such as metabolite composition and cell wall synthesis.

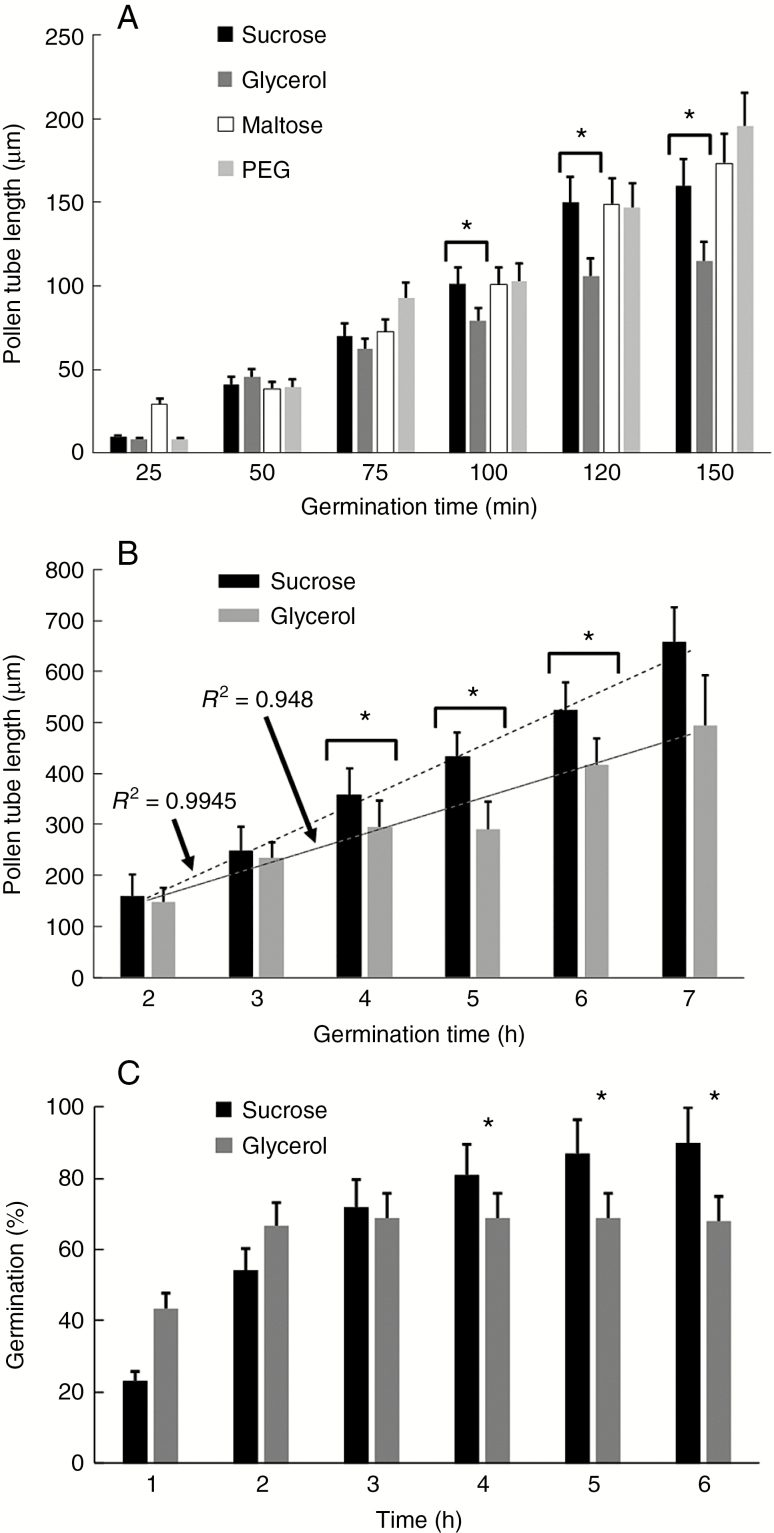
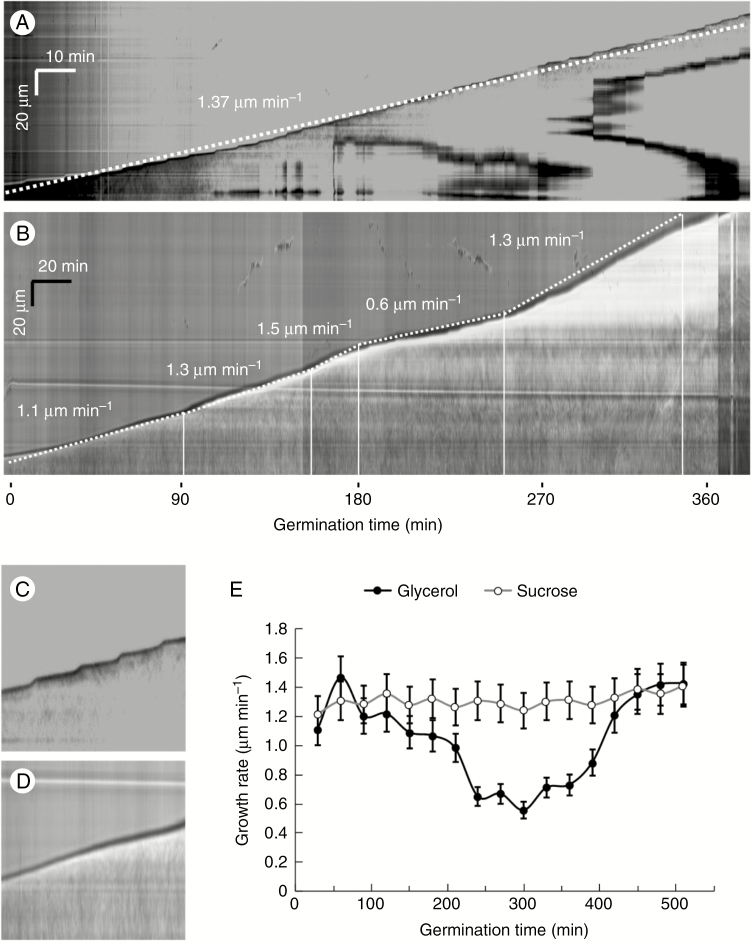
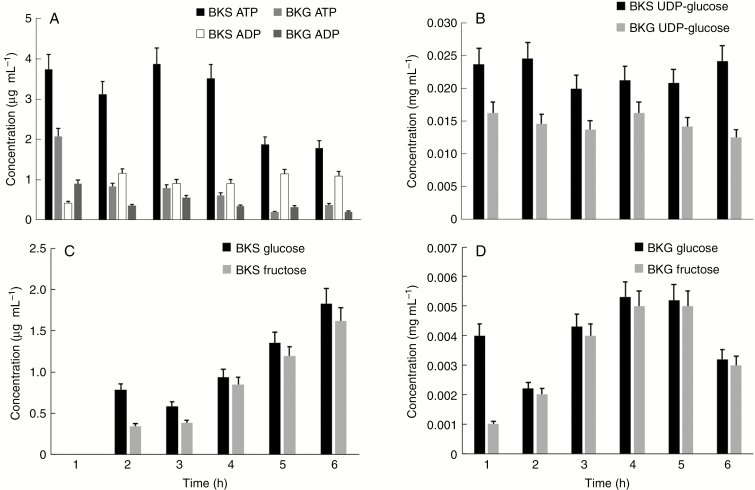
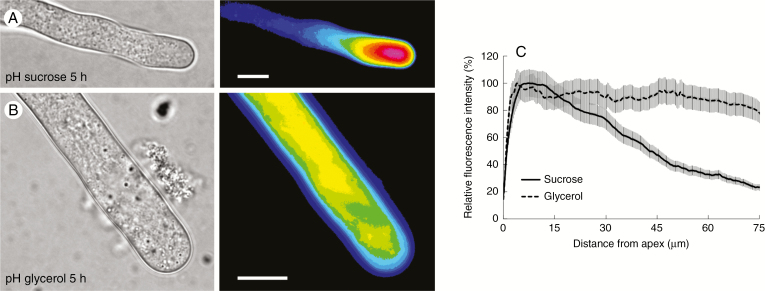
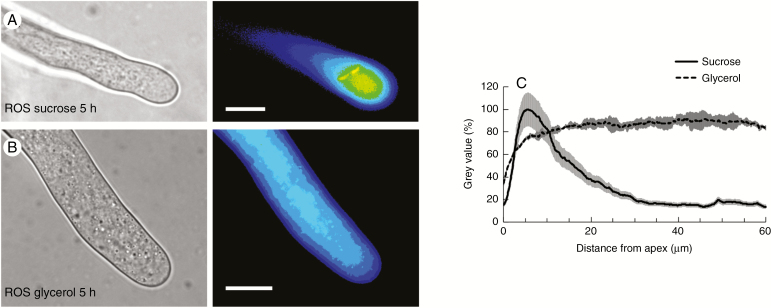
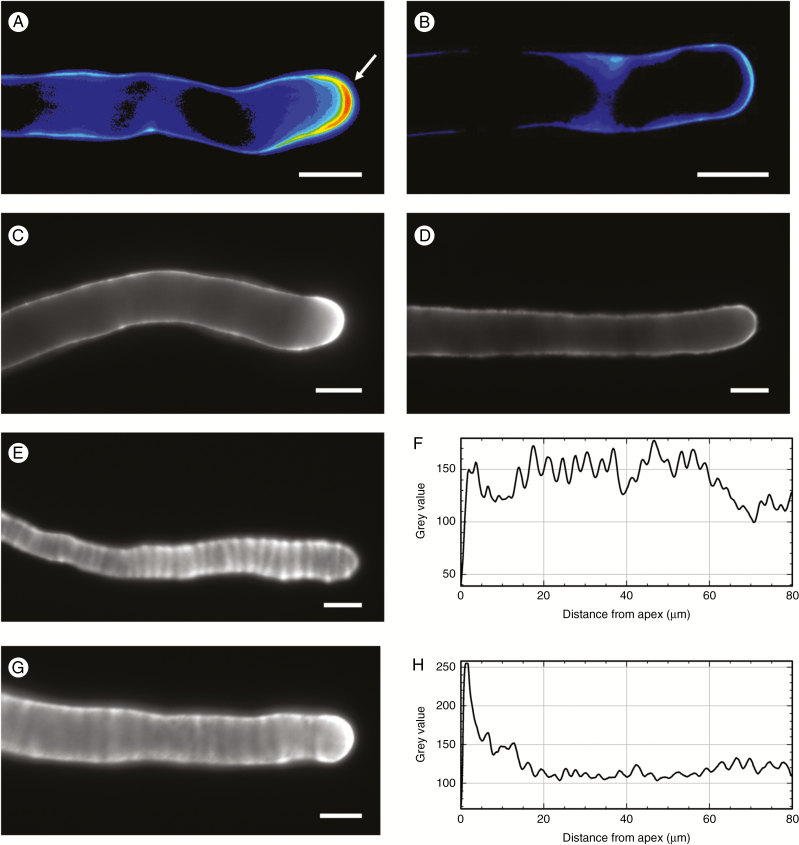
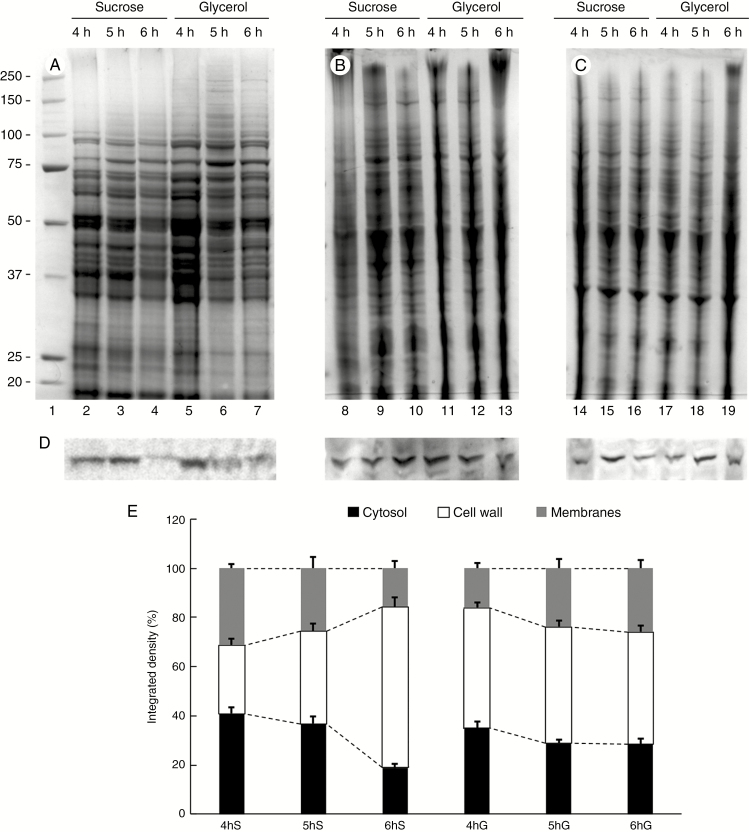
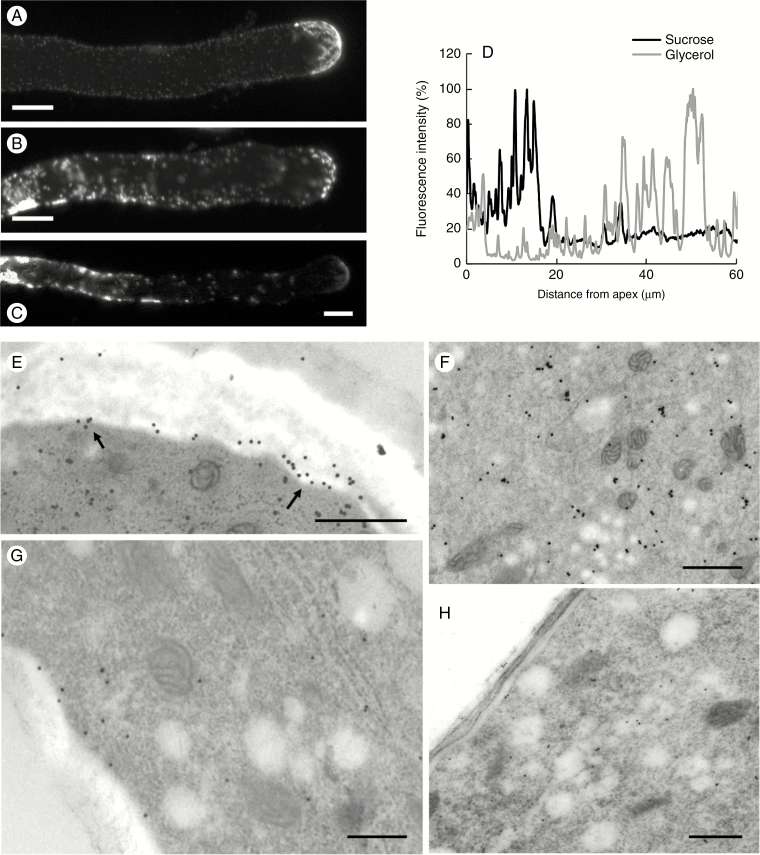
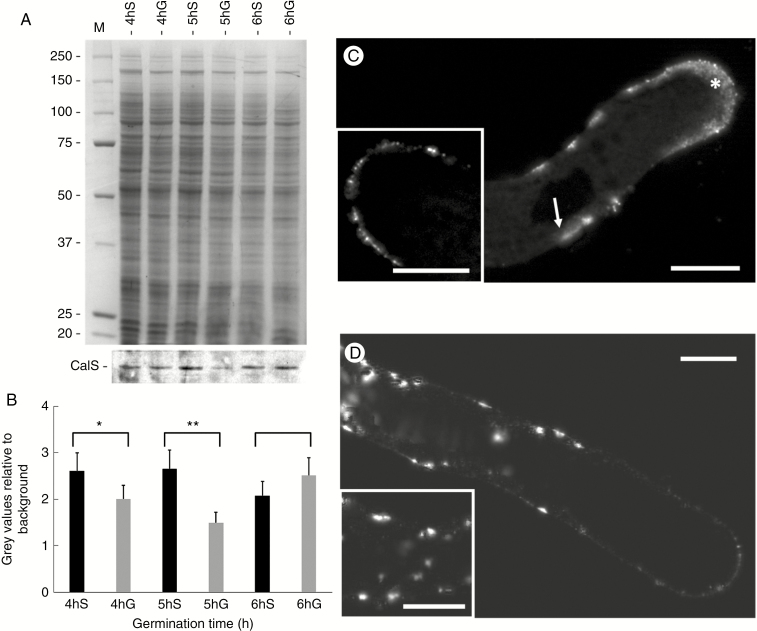
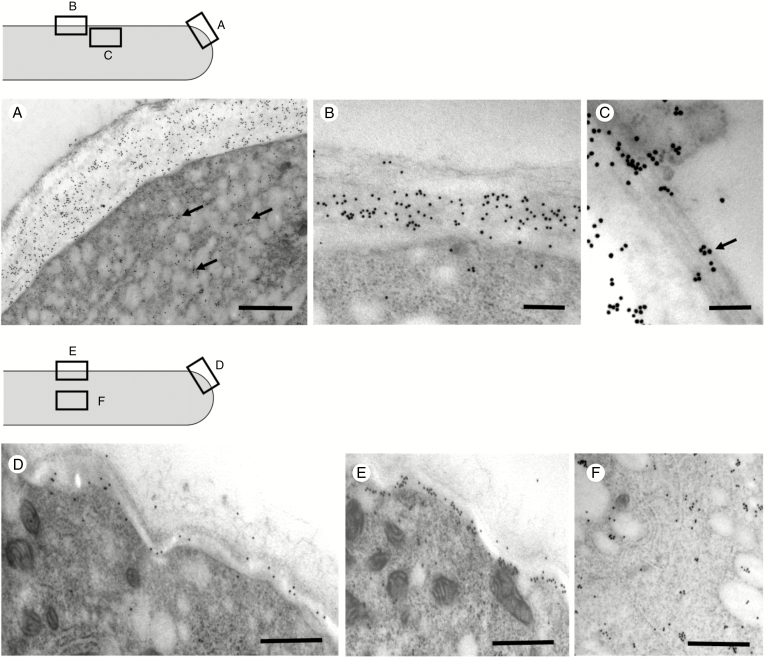
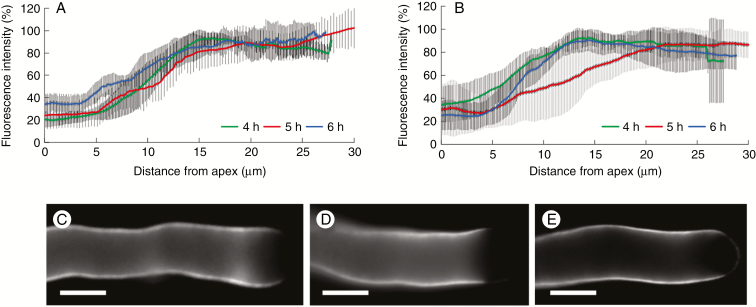
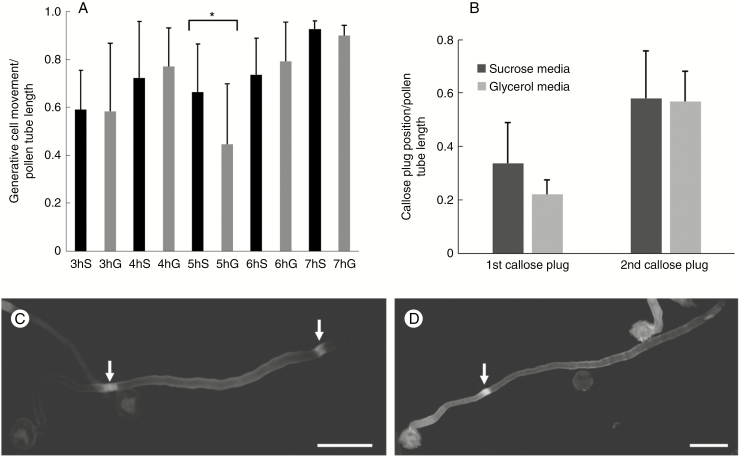
Key results: We found that the lack of sucrose affects pollen germination and pollen tube length during a specific growth period. Both sugar metabolism and ATP concentration were affected by sucrose shortage when pollen tubes were grown in glycerol-based media; this was related to decreases in the concentrations of glucose, fructose and UDP-glucose. The intracellular pH and ROS levels also showed a different distribution in pollen tubes grown in sucrose-depleted media. Changes were also observed at the cell wall level, particularly in the content and distribution of two enzymes related to cell wall synthesis (sucrose synthase and callose synthase). Furthermore, both callose and newly secreted cell wall material (mainly pectins) showed an altered distribution corresponding to the lack of oscillatory growth in pollen tubes. Growth in glycerol-based media also temporarily affected the movement of generative cells and, in parallel, the deposition of callose plugs.

Conclusion: Pollen tubes represent an ideal model system for studying metabolic pathways during the growth of plant cells. In our study, we found evidence that glycerol, a less energetic source for cell growth than sucrose, causes critical changes in cell wall deposition. The evidence that different aspects of pollen tube growth are affected is an indication that pollen tubes adapt to metabolic stress.


Figures

Fig. 1.
Fig. 1.
Pollen tube growth under standard conditions and in the presence of different osmotic compounds. (A) Pollen tube growth in BK medium supplemented with different osmotic molecules (sucrose, glycerol, maltose, PEG). The analysis was carried out for 150 min. Statistically significant differences were observed between growth in sucrose- and glycerol-based media (in all the panels the asterisks correspond to P <0.05). Bars indicate standard deviation. (B) Analysis of pollen tube length after growth in BK medium supplemented with either sucrose or glycerol. The analysis was carried out for 7 h. Statistically significant differences were determined after 4, 5 and 6 h of germination (asterisks). For both analyses, trend lines and corresponding R2 values are reported. (C) Analysis of germination of pollen tubes in BK medium supplemented with either sucrose or glycerol. This parameter was monitored for 6 h. Asterisks indicate the time points when germination in BK medium plus sucrose was statistically higher than that in BK medium plus glycerol.
Fig. 2.
Fig. 2.
Growth of pollen tubes as analysed by kymography in BK medium supplemented with either sucrose or glycerol. (A) Typical growth profile of pollen tubes in BK medium plus sucrose. The velocity reported in the image refers to a frequently observed average value. Time and distance bars are shown at the top left. (B) Kymographic analysis of pollen tubes grown in BK medium plus glycerol. The growth pattern was arbitrarily divided into segments in which speed was relatively constant. The values shown indicate average speeds for each segment. Note the marked decrease in growth after the third hour of germination. Time and distance bars are shown at the top left. (C, D) Detail of the growth profile of pollen tubes in BK medium plus sucrose (C) or plus glycerol (D). Note the oscillatory profile in C as opposed to the linear profile in D. (E) Analysis of average growth speed as calculated by kymography. Note the minimum growth value around the fifth hour in BK medium plus glycerol.
Fig. 3.
Fig. 3.
Analysis of metabolites in pollen tubes grown in BK medium supplemented with sucrose or glycerol. The analysis was performed after each hour of germination for a period of 6 h. (A) Measurement of the concentrations of ATP and ADP in pollen tubes grown in BK plus sucrose (BKS) or plus glycerol (BKG). (B) Concentration analysis of UDP-glucose in the two experimental conditions. (C) Analysis of the concentration of glucose and fructose in pollen tubes grown in BK medium plus glycerol. No signal was found at the first hour because values were below the instrumental detection limit. (D) Analysis of glucose and fructose in pollen tubes grown in BK medium plus sucrose. In all cases, bars indicate the standard deviation.
Fig. 4.
Fig. 4.
Analysis of pH distribution in pollen tubes grown for 5 h in sucrose- and glycerol-based media. (A) The pH in pollen tubes grown under standard conditions is relatively low (acid) at the apex but increases (becomes more basic) in the subapex and shank of pollen tubes. (B) In pollen tubes grown in glycerol-based medium, the pH is relatively constant along the tube. (C) Measurement of the fluorescence signal from the apex along the axis of pollen tubes. The graph illustrates the differences in pH distribution in pollen tubes grown in different growth media. Values were normalized against the background and referred to the highest value, which was set as 100 %. Scale bars = 10 μm.
Fig. 5.
Fig. 5.
Analysis of the presence of ROS in pollen tubes after 5 h of growth in BK medium plus sucrose or glycerol. (A) A pollen tube (left) and the corresponding fluorescence signal of the ROS probe (pseudocoloured, right) after 5 h of growth in BKS. (B) A pollen tube (left) and the corresponding fluorescent signal of ROS (pseudocoloured, right) after 5 h of growth in BKG. (C) Distribution profile of ROS as measured from the apex of pollen tubes grown in BKS (solid line) and BKG (dashed line). The grey areas along the two profiles indicate the standard deviation.
Fig. 6.
Fig. 6.
Deposition of pectins in the cell wall. (A) Typical pollen tube grown in BKS medium and labelled with PI. Note the strong signal in the apical region of the pollen tube (arrow). (B) A pollen tube grown in BKG and labelled with the PI probe. The signal is homogeneous along the tube edge. (C) A typical pollen tube grown in BKS and labelled with JIM7 antibody; the apex is strongly stained. (D) A typical pollen tube grown in BKG and labelled with JIM7; the signal is homogeneous along the cell wall. (E) A pollen tube grown in BKS and labelled with JIM5 antibody; acidic pectins are distributed at regular intervals, as shown by the graph in (F). (G) A pollen tube grown in BKG and labelled with JIM5; as shown by the analysis in (H), acidic pectins accumulate at the apex and are more homogeneous along the pollen tube. Scale bars = 10 μm.
Fig. 7.
Fig. 7.
Relative accumulation of sucrose synthase in the cytosol, membranes and cell walls of pollen tubes grown in BKS and BKG. (A) Electrophoretic analysis of proteins extracted from the cytosol of pollen tubes grown for 4, 5 and 6 h in the two different media. Molecular weight standards (kDa) are indicated on the left. (B) Profile of proteins extracted from the cell wall of pollen tubes grown for 4, 5 and 6 h in BKS and BKG. (C) Electrophoresis of proteins extracted from the membrane fraction of pollen tubes grown under the same conditions. (D) Analysis by immunoblotting with antibody to sucrose synthase in the same protein samples described above: cytosol (left), cell wall (centre) and membrane fraction (right). (E) Relative quantification of signals after immunoblotting with antibodies to sucrose synthase in the three fractions described above: cytosol (black bars), cell wall (white bars) and membrane fraction (grey bars). S, sucrose; G, glycerol. Measurements are reported as percentages of total signals.
Fig. 8.
Fig. 8.
Distribution of sucrose synthase in pollen tubes grown for 5 h in BKS and BKG. (A) A typical pollen tube labelled with antibody against sucrose synthase. Note the accumulation of signal in the apical region and along the pollen tube edge. Scale bar = 10 µm. (B, C) Two typical pollen tubes grown for 5 h in BKG and labelled with antibody against sucrose synthase. Note the substantial accumulation of signal in distal and internal regions of the tubes. Scale bars = 10 µm. (D) Measurement of sucrose synthase signal along the axis of pollen tubes grown in BKS (black line) and BKG (grey line), starting from the tube apex. (E) Immunogold labelling of sucrose synthase in pollen tubes grown in BKS. In the subapical and distal regions, sucrose synthase is localized in association with the plasma membrane (arrows). Scale bar = 500 nm. (F) The enzyme signal is also found in intracellular membranes. Scale bar = 500 nm. (G) In pollen tubes grown in BKG, the actual amount of sucrose synthase in the subapical region is much smaller and only a few gold particles are observed in association with the plasma membrane. Scale bar = 500 nm. (H) Other subapical sections indicate a very weak signal, suggesting that the amount of sucrose synthase associated with the plasma membrane decreases considerably in BKG. Scale bar = 500 nm.
Fig. 9.
Fig. 9.
Analysis of the accumulation and distribution of callose synthase in pollen tubes grown in BKS and BKG for 4, 5 and 6 h. (A) Electrophoresis (top) and immunoblotting (bottom) analysis with antibody to callose synthase (CalS) in different growth conditions. S, sucrose; G, glycerol. (B) Measurement of the immunoblot signal. Black bars, pollen tubes in BKS; grey bars, pollen tubes in BKG. *P < 0.05; **P < 0.01. (C) Analysis by immunofluorescence microscopy of callose synthase in pollen tubes grown in BKS after 5 h of germination. The enzyme is distributed predominantly in the apical region (asterisk) and, to a lesser extent, in more distal parts of the pollen tubes (arrow). Insert: single focal section approximately at the median level of a pollen tube apex. (D) In pollen tubes grown in BKG, the enzyme accumulates substantially in the cytoplasm of distal regions concomitantly to reduction of signal in the tube apex. Insert: distal portion of a pollen tube with clear intracytoplasmic accumulation of the enzyme. Scale bars = 10 µm.
Fig. 10.
Fig. 10.
Analysis of the distribution of callose synthase by immunoelectron microscopy. (A) In the subapical region of pollen tubes grown in sucrose-based medium, callose synthase is strongly detected in association with the plasma membrane and cell wall. The enzyme is also found in association with vesicles in the underlying cytoplasm (arrows). Scale bar = 500 nm. (B) In the most distal regions, the enzyme is still detected in association with the plasma membrane and sporadically with the inner layer of the cell wall. Scale bar = 500 nm. (C) Association between callose synthase and longitudinal cortical microtubules as observed in the underlying cytoplasm (arrow). Scale bar = 150 nm. (D) In pollen tubes grown in glycerol-based medium for 5 h, the amount of enzyme decreases considerably at the apex/subapex level. Scale bar = 500 nm. (E) In the shank region, callose synthase is still predominantly associated with the plasma membrane and the initial layer of the cell wall. Scale bar = 500 nm. (F) Detail of the cytoplasmic region with strong signal of callose synthase. Scale bar = 500 nm.
Fig. 11.
Fig. 11.
Distribution of callose in the subapical region of pollen tubes grown in medium with sucrose or glycerol. In all cases, fluorescence was measured starting from the apex down to 30 μm. (A) In medium with sucrose, distribution of callose did not differ during the transition from 4 to 6 h of germination. (B) Distribution of callose differed when pollen tubes were grown in medium with glycerol, especially after 5 h of growth, because the callose signal stabilized only around 20–25 μm from the apex. (C, D, E) Visualization of callose in pollen tubes grown in medium with glycerol, respectively after 4, 5 and 6 h of germination. Scale bars = 10 μm.
Fig. 12.
Fig. 12.
Effects of germination medium on the translocation of the generative cell and on the deposition of callose plugs. (A) Ratio between the movement of the generative cell from the grain and the corresponding pollen tube length as measured from 3 to 7 h after germination in growth medium containing either sucrose (S, black bars) or glycerol (G, grey bars). Standard deviation is indicated at the top of the bars. *P < 0.05. (B) Ratio between positions of the first and second callose plugs and the corresponding pollen tube length as determined after 7 h of germination. The first callose plug is the one closest to the pollen grain. Bars indicate standard deviation. (C) A pollen tube grown in BKS for 7 h, in which two callose plugs (arrows) can be observed. Scale bar = 50 μm. (D) A pollen tube grown for 7 h in BKG containing only the first callose plug (arrow). Scale bar = 50 μm.
Fig. 13.
Fig. 13.
Schematic illustration of the main metabolic pathways occurring in pollen tubes grown in either sucrose or glycerol. (A) When the growth medium contains sucrose, it feeds glycolysis (and thus respiration) and UDP-glucose synthesis. This provides a normal growth process. (B) When the growth medium contains glycerol, synthesis of UDP-glucose is likely to be reduced; ATP levels are also lower, and this affects the several processes analysed, such as the homeostasis of pH and ROS, and production/secretion of pectins. The growth process is thus altered. The thickness of the arrows indicates the hypothetical intensity of each individual process. CalS, callose synthase; IMP, importer; INV, invertase; SUS, sucrose synthase.

Similar articles

Cited by

References

    1. Aloisi I, Cai G, Tumiatti V, Minarini A, Del Duca SD. 2015. Natural polyamines and synthetic analogues modify the growth and the morphology of Pyrus communis pollen tubes affecting ROS levels and causing cell death. Plant Science 239: 92–105. - PubMed
    1. Aloisi I, Cai G, Faleri C, Navazio L, Serafini-Fracassini D, Del Duca S. 2017. Spermine regulates pollen tube growth by modulating Ca2+-dependent actin organization and cell wall structure. Frontiers in Plant Science 8: 1701. - PMC - PubMed
    1. Aubert S, Gout E, Bligny R, Douce R. 1994. Multiple effects of glycerol on plant cell metabolism. Phosphorus-31 nuclear magnetic resonance studies. Journal of Biological Chemistry 269: 21420–21427. - PubMed
    1. Biagini G, Faleri C, Cresti M, Cai G. 2014. Sucrose concentration in the growth medium affects the cell wall composition of tobacco pollen tubes. Plant Reproduction 27: 129–144. - PubMed
    1. Brewbaker JL, Kwack BH. 1963. The essential role of calcium ion in pollen germination and pollen tube growth. American Journal of Botany 50: 859–865.

Publication types

MeSH terms