Review
. 2018 Nov:369:90-102.
doi: 10.1016/j.heares.2018.03.024. Epub 2018 Mar 31.

A perspective on brain-behavior relationships and effects of age and hearing using speech-in-noise stimuli

Affiliations
Review

A perspective on brain-behavior relationships and effects of age and hearing using speech-in-noise stimuli

Curtis J Billings et al. Hear Res. 2018 Nov.

Abstract

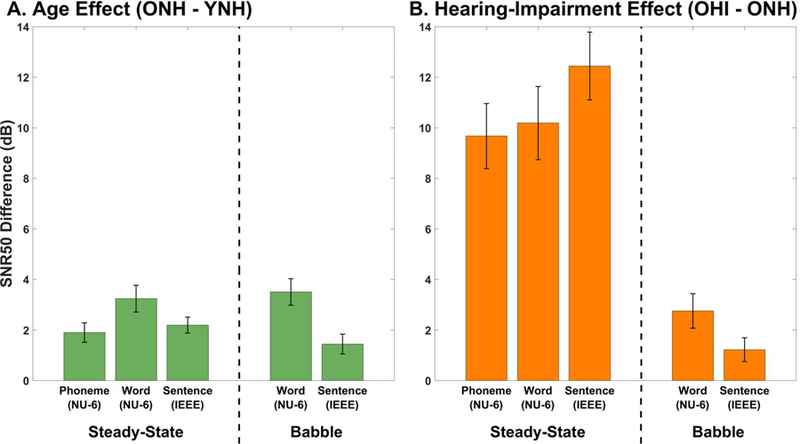
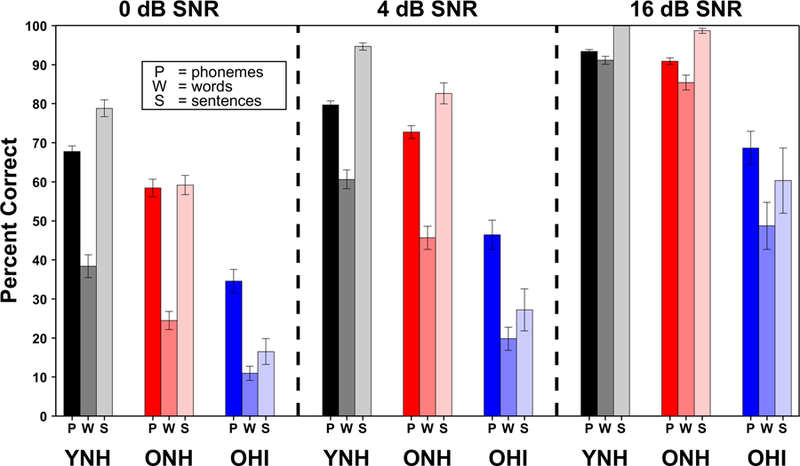
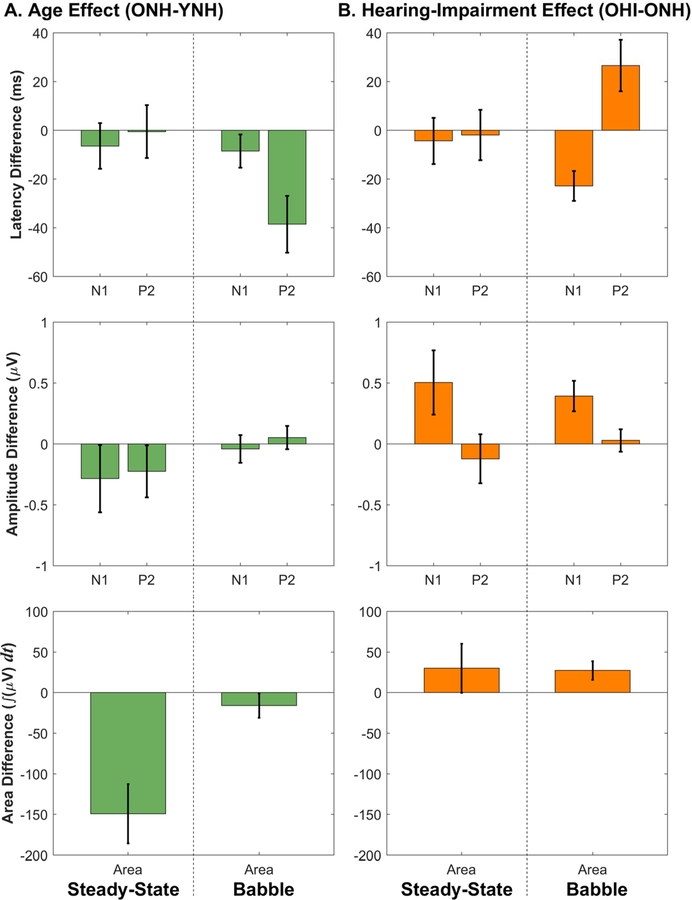
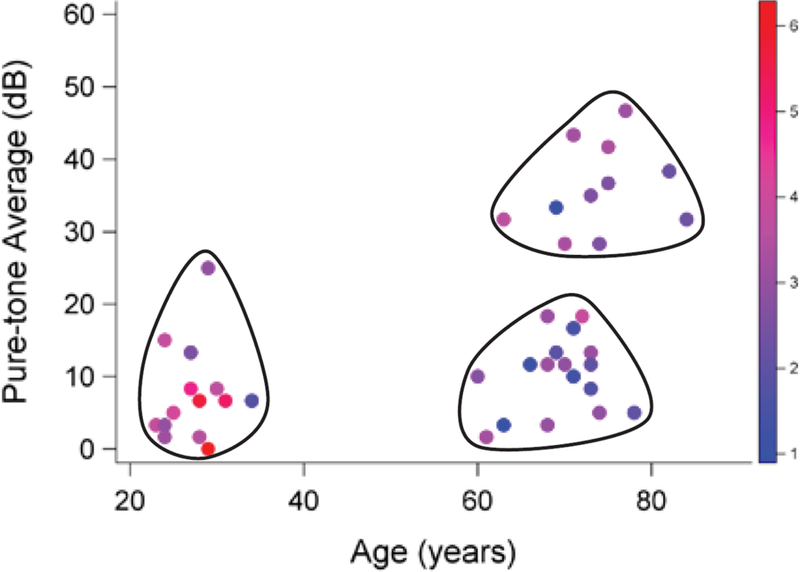
Understanding speech in background noise is often more difficult for individuals who are older and have hearing impairment than for younger, normal-hearing individuals. In fact, speech-understanding abilities among older individuals with hearing impairment varies greatly. Researchers have hypothesized that some of that variability can be explained by how the brain encodes speech signals in the presence of noise, and that brain measures may be useful for predicting behavioral performance in difficult-to-test patients. In a series of experiments, we have explored the effects of age and hearing impairment in both brain and behavioral domains with the goal of using brain measures to improve our understanding of speech-in-noise difficulties. The behavioral measures examined showed effect sizes for hearing impairment that were 6-10 dB larger than the effects of age when tested in steady-state noise, whereas electrophysiological age effects were similar in magnitude to those of hearing impairment. Both age and hearing status influence neural responses to speech as well as speech understanding in background noise. These effects can in turn be modulated by other factors, such as the characteristics of the background noise itself. Finally, the use of electrophysiology to predict performance on receptive speech-in-noise tasks holds promise, demonstrating root-mean-square prediction errors as small as 1-2 dB. An important next step in this field of inquiry is to sample the aging and hearing impairment variables continuously (rather than categorically) - across the whole lifespan and audiogram - to improve effect estimates.

Keywords: Aging; Brain and behavior; Correlation; Cortical auditory evoked potentials; Hearing impairment; Hearing loss; Prediction; Speech in noise; Speech perception in noise.


Figures

Figure 1
Figure 1
Signal-to-noise ratios (SNRs) measured in everyday listening situations across different studies. Specific environments from the reviewed studies have been grouped into broader categories and arranged according to mean or median SNR (depending on the study), with the highest (most favorable) on the left and the lowest (least favorable) on the right. See Appendices A and B for additional details about the recording procedures and listening situations from each study.
Figure 2
Figure 2
Variability in speech understanding in noise across listeners. SNR50s are plotted for different signal levels for a young, normal-hearing group (error bars show ±1 standard error of the mean) and for older hearing-impaired individuals. Points above the dashed line represent those individuals who remained below 50% performance at the maximum test SNR of 30 dB.
Figure 3
Figure 3
Psychometric functions for IEEE sentence understanding. Younger normal-hearing (solid black lines), older normal-hearing (long-dashed red lines), and older hearing-impaired (short-dashed blue lines) functions are shown both as a group average (thick) and for individuals (thin). (Figure modified from Billings et al., 2015).
Figure 4
Figure 4
Experiment 1: CAEP responses at the Cz electrode to speech token /ba/ in steady-state speech-spectrum noise as a function of SNR for three participant groups. A. Waveform morphology is affected by SNR (generally latencies increase and amplitudes decrease as SNR gets worse) and by age and hearing status. B. SNR growth functions for N1, P2, and area CAEP measures, reveal systematic effects of SNR and group. (Figure modified from Billings et al., 2015).
Figure 5
Figure 5
Age and hearing impairment effects on speech understanding, using data from all three experiments. Error bars represent the pooled mean standard error for the two sets of measurements used to calculate each difference value. A. Age effects on SNR50 values are shown for steady-state speech spectrum noise and four-talker babble using word (scored by word and phoneme) and sentence tests. B. Hearing-impairment effects on SNR50 values are shown as a function of signal and noise type. Hearing-impairment effects are 6–10 dB larger than the age effect for steady-state noise, whereas the effects are similar when four-talker babble is used.
Figure 6
Figure 6
Speech understanding accuracy at selected SNRs, derived from individual fitted logistic functions, grouped by signal type and participant group. All three SNRs are within the range that commonly occurs in everyday listening situations. Age and hearing-impairment effects in terms of percent correct illustrate the difficulty that may be experienced, especially by older hearing-impaired listeners. Error bars represent the standard error of the mean.
Figure 7
Figure 7
Age and hearing impairment effects on cortical AEPs. Error bars represent the pooled mean standard error for the two sets of measurements used to calculate each difference value. A. Age effects on N1, P2, and area are shown for the speech-syllable stimulus /ba/ presented in steady-state speech-spectrum noise (data from Experiment 1, collapsed across −5, 5, and 15 dB SNRs) and in four-talker babble (data from Experiment 3, collapsed across −3, 3, and 9 dB SNRs). Increased age is mostly associated with decreases in latency, amplitude, and area. Later P2 latencies for YNH participants are also seen. B. Hearing impairment appears to be associated with larger areas and peak amplitudes, shorter N1 latency, and longer P2 latency.
Figure 8
Figure 8
Age and pure-tone average (PTA) hearing thresholds for Experiment 1 participants. Each dot represents one of the individuals tested in the three participant groups: YNH, ONH, and OHI. Shading of each dot represents the magnitude of the auditory evoked response for each individual. Large portions of the PTA-age space are not represented (e.g., individuals between 35 and 59 years of age). Continuous (non-grouped) sampling of individuals with a wide range of ages and hearing thresholds would improve our estimates of aging and hearing impairment effects and expand the generalizability of a prediction model.

References

    1. Agrawal Y, Platz E, Niparko J, 2008. Prevalence of hearing loss and differences by demographic characteristics among US adults. Arch. Intern. Med 168, 1522–1530. - PubMed
    1. Anderson S, Parbery-Clark A, Yi HG, Kraus N, 2011. A neural basis of speech-in-noise perception in older adults. Ear Hear 32, 750–757. - PMC - PubMed
    1. Anderson S, Skoe E, Chandrasekaran B, Kraus N, 2010. Neural timing is linked to speech perception in noise. J. Neurosci 30, 4922–4926. - PMC - PubMed
    1. Arlinger S, 2003. Negative consequences of untreated hearing loss: a review. Int. J. Audiol 42, 2S17–2S21. - PubMed
    1. Armitage P, Allen I, 1950. Methods of estimating the LD 50 in quantal response data. J. Hygiene 48, 298–322. - PMC - PubMed

Publication types