. 2018 May 15;200(10):3568-3586.
doi: 10.4049/jimmunol.1701605. Epub 2018 Apr 16.

Oral NaHCO3 Activates a Splenic Anti-Inflammatory Pathway: Evidence That Cholinergic Signals Are Transmitted via Mesothelial Cells

Affiliations

Oral NaHCO3 Activates a Splenic Anti-Inflammatory Pathway: Evidence That Cholinergic Signals Are Transmitted via Mesothelial Cells

Sarah C Ray et al. J Immunol. .

Abstract

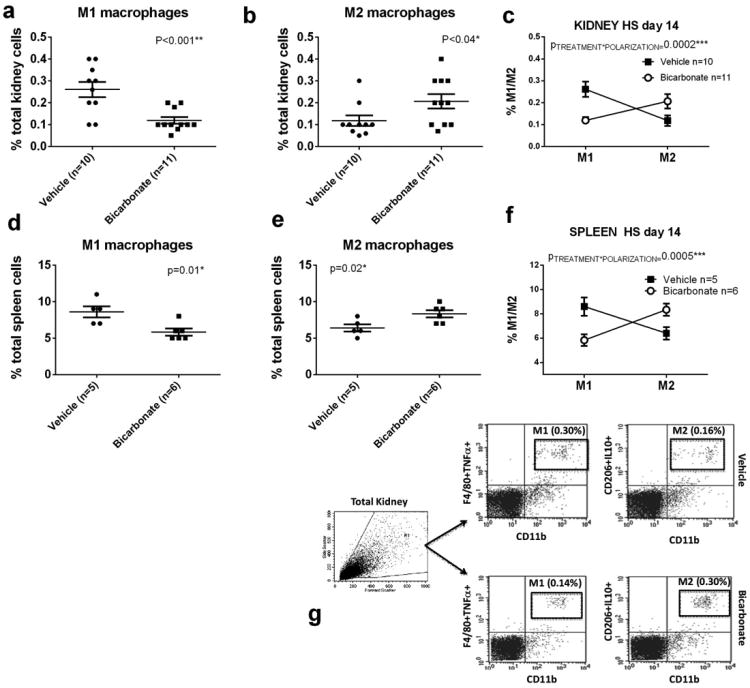
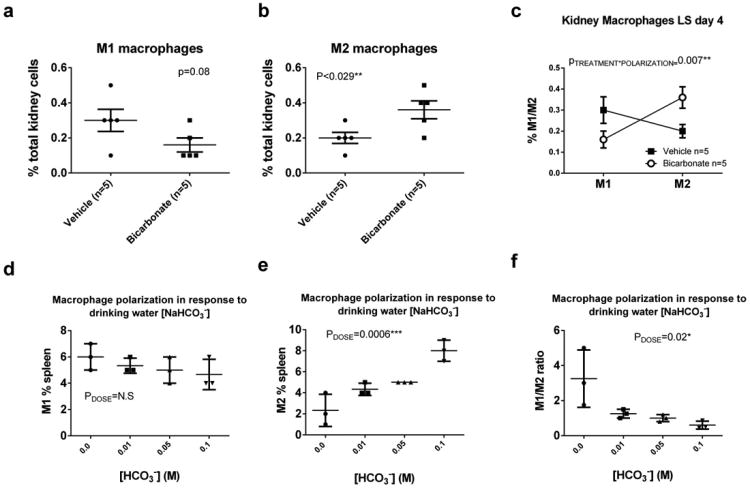
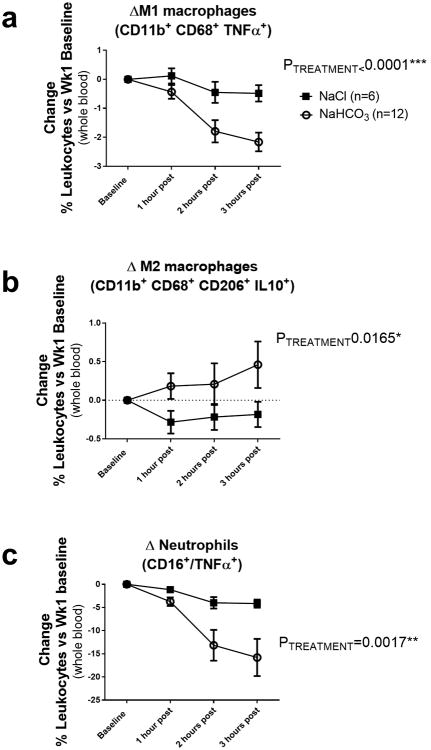
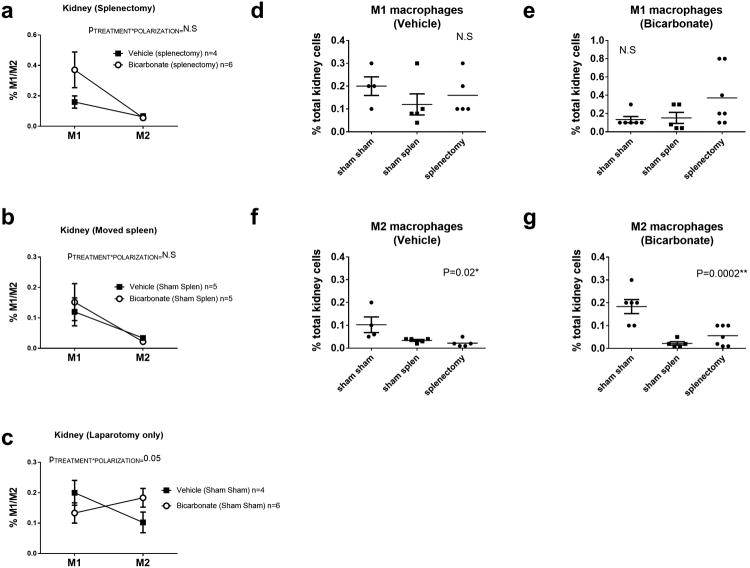
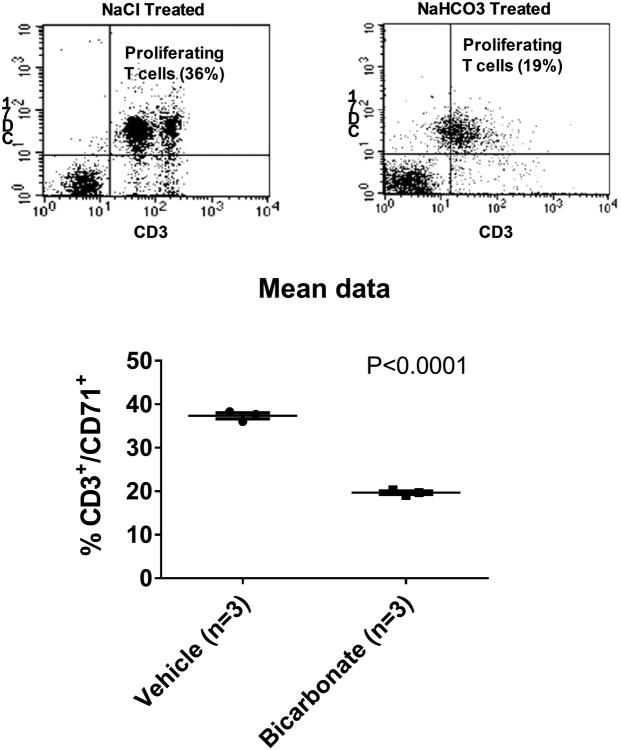
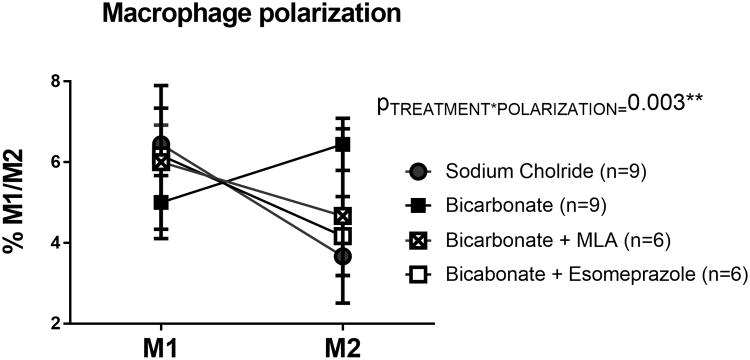
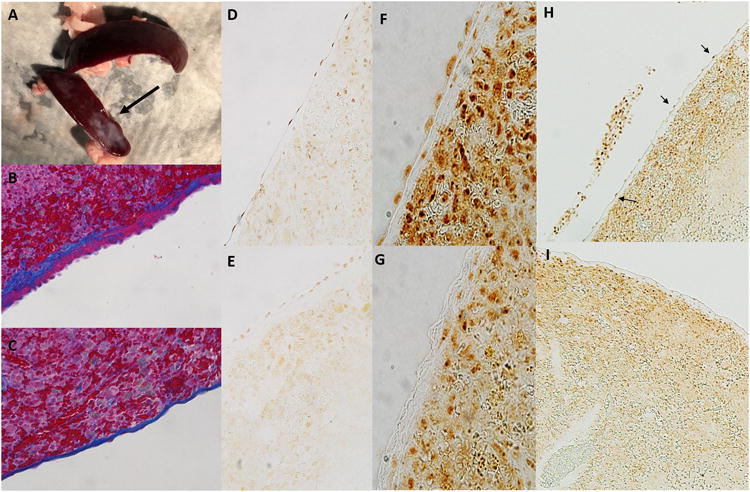
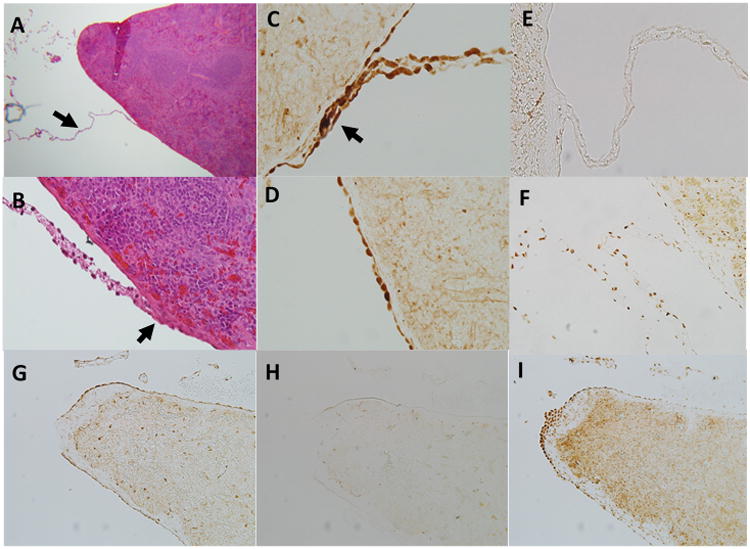
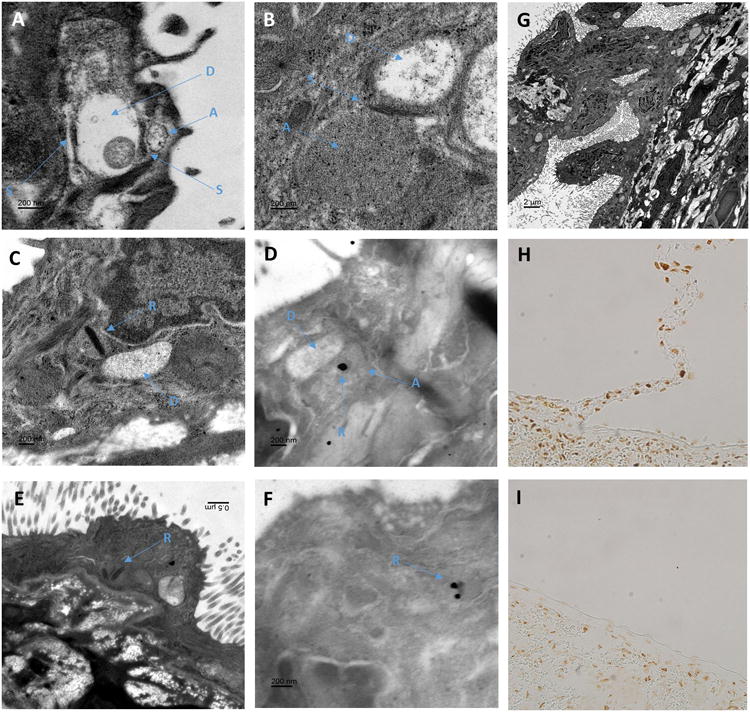
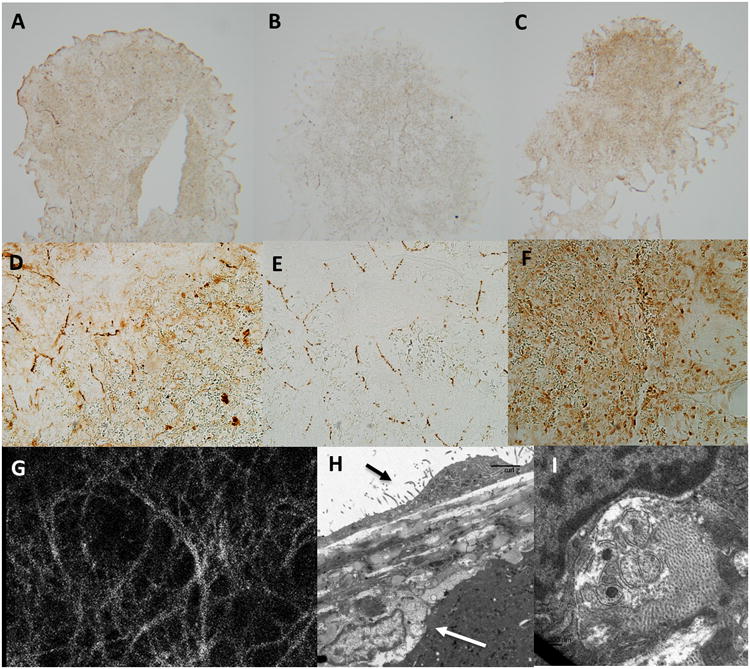
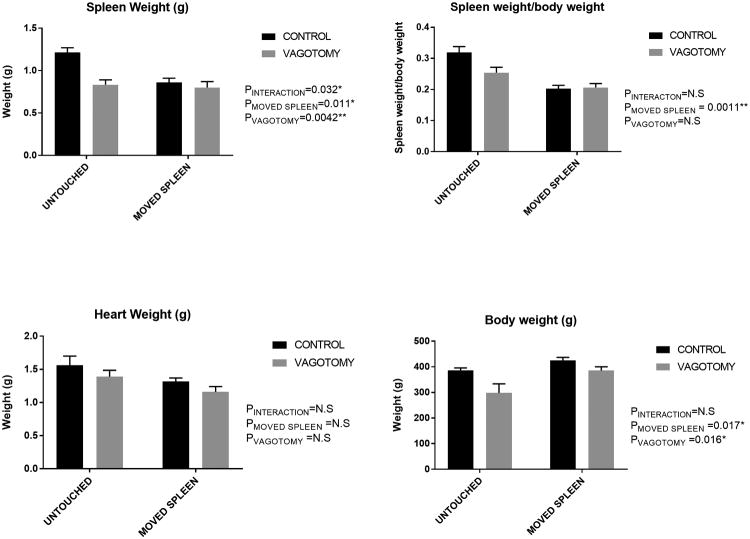
We tested the hypothesis that oral NaHCO3 intake stimulates splenic anti-inflammatory pathways. Following oral NaHCO3 loading, macrophage polarization was shifted from predominantly M1 (inflammatory) to M2 (regulatory) phenotypes, and FOXP3+CD4+ T-lymphocytes increased in the spleen, blood, and kidneys of rats. Similar anti-inflammatory changes in macrophage polarization were observed in the blood of human subjects following NaHCO3 ingestion. Surprisingly, we found that gentle manipulation to visualize the spleen at midline during surgical laparotomy (sham splenectomy) was sufficient to abolish the response in rats and resulted in hypertrophy/hyperplasia of the capsular mesothelial cells. Thin collagenous connections lined by mesothelial cells were found to connect to the capsular mesothelium. Mesothelial cells in these connections stained positive for the pan-neuronal marker PGP9.5 and acetylcholine esterase and contained many ultrastructural elements, which visually resembled neuronal structures. Both disruption of the fragile mesothelial connections or transection of the vagal nerves resulted in the loss of capsular mesothelial acetylcholine esterase staining and reduced splenic mass. Our data indicate that oral NaHCO3 activates a splenic anti-inflammatory pathway and provides evidence that the signals that mediate this response are transmitted to the spleen via a novel neuronal-like function of mesothelial cells.


Figures

Figure 1
Figure 1
Data from flow cytometric analysis of macrophage polarization (M1/M2) from kidneys and spleen from male Dahl SS rats drinking 0.1M NaHCO3 (bicarbonate) or equimolar NaCl (vehicle) are presented in figure 1a-g. All data are from rats placed on treated water (vehicle or bicarbonate) for 3 days before being switched to a HS diet for 14 days prior to tissue harvest. Panel a; the percentage of total kidney cells identified as M1 macrophages(CD11b/Figure 4/80+/TNFα+ cells) in vehicle (n=10; filled circles) and bicarbonate (n=11; filled squares) treated rats. Panel b; the percentage of total kidney cells identified as M2 macrophages (CD11b/CD206+/IL10+ cells) in vehicle (n=10; filled circles) and bicarbonate (n=11; filled squares) treated rats. Panel c; Relative expression of M1 and M2 macrophages expressed as a % of total kidney cells in vehicle (filled squares) and bicarbonate (open circles) treated rats. Panel d; the percentage of total spleen cells identified as M1 macrophages (CD11b/Figure 4/80+/TNFα+ cells) in vehicle (n=10; filled circles) and bicarbonate (n=11; filled squares) treated rats. Panel e; the percentage of total spleen cells identified as M2 macrophages (CD11b/CD206+/IL10+ cells) in vehicle (n=10; filled circles) and bicarbonate (n=11; filled squares) treated rats. Panel f; Relative expression of M1 and M2 macrophages expressed as % of total spleen cells in vehicle (filled squares) and bicarbonate (open circles) treated rats. Panel g; representative gating images from kidney of HS treated rats
Figure 2
Figure 2
Data from flow cytometric analysis of macrophage polarization (M1/M2) from kidneys and spleen from male Dahl SS rats drinking either 0.1M NaHCO3 (bicarbonate) or equimolar NaCl (vehicle) are presented in figure 2a-c. All data are from rats placed on treated water (vehicle or bicarbonate) for 3 days before tissue harvest. Panel a; the percentage of total kidney cells identified as M1 macrophages (CD11b/Figure 4/80+/TNFα+ cells) in vehicle (n=5; filled circles) and bicarbonate (n=5; filled squares) treated rats. Panel b; the percentage of total kidney cells identified as M2 macrophages (CD11b/CD206+/IL10+ cells) in vehicle (n=5; filled circles) and bicarbonate (n=5; filled squares) treated rats. Panel c; Relative expression of M1 and M2 macrophages expressed as % total kidney cells in vehicle (filled squares) and bicarbonate (open circles) treated rats. Panels (d-f) Data from flow cytometric analysis of macrophage polarization (M1/M2) in kidneys of male Sprague Dawley rats (Charles River Laboratories) drinking either 0.1M NaHCO3 (n=3), 0.05M NaHCO3/0.05M NaCl (n=3), 0.01M NaHCO3/0.09M NaCl (n=3) or 0.1M NaCl (n=3) for 4 days prior to tissue harvest. All rats were fed standard laboratory chow (Teklad). Panel d; the percentage of total kidney cells identified as M1 macrophages (CD11b/Figure 4/80+/TNFα+ cells) in response to increasing concentrations of NaHCO3 in drinking water (0M on right to 0.1M on left). All doses were made equimolar with addition of NaCl to the drinking water. Panel e; the percentage of total kidney cells identified as M2 macrophages (CD11b/CD206+/IL10+ cells) in response to increasing concentrations of NaHCO3 in drinking water (0M on right to 0.1M on left). Panel f; Ratio of M1 to M2 macrophages expressed as % of total kidney cells in response to increasing concentrations of NaHCO3 in drinking water.
Figure 3
Figure 3
Data from flow cytometric analysis of human blood from subjects drinking either NaHCO3 (bicarbonate) or equimolar NaCl (vehicle) are presented in figure 7a-c. Y axis, all data are expressed as change in % of total blood leukocytes compared to baseline values taken prior to any treatment. Baseline data for all subjects is given in Table 2. X axis, 1 hour post = data obtained 1 hour after ingesting 2g or NaHCO3 (n=12 subjects) or equimolar NaCl (n=6 subjects) solution in 250mL of bottled water. 2 hours post, data obtained 2 hours after ingesting 2g or NaHCO3 or equimolar NaCl solution in 250mL of bottled water. 3 hours post = data obtained 3 hours after ingesting 2g or NaHCO3 or equimolar NaCl solution in 250mL of bottled water (note not all subjects had blood drawn at 3 hours (n=10 for NaHCO3 at 3 hours in supplement). All data are mean±SE. PTREATMENT = the output of a 2-way ANOVA comparing treatment groups. P<0.05 was considered significant. Panel a; the change in percentage of total blood leukocytes identified as M1 macrophages (CD11b+/CD68+/TNFα+ cells) in vehicle (n=6; filled squares) and bicarbonate (n=12; open circles) treated subjects as compared to baseline. Panel b; the change in the percentage of total blood leukocytes identified as M2 macrophages (CD11b+, CD68+, CD206+ and IL-10+ cells) in vehicle (n=6; filled squares) and bicarbonate (n=12; open circles) treated subjects as compared to baseline. Panel c; the change in the percentage of total blood leukocytes identified as TNFα+ neutrophils (CD16+/TNFα+ cells) in vehicle (n=6; filled squares) and bicarbonate (n=12; open circles) treated subjects as compared to baseline.
Figure 4
Figure 4
Data from flow cytometric analysis of macrophage polarization (M1/M2) from kidneys of male Dahl SS rats drinking either 0.1M NaHCO3 (bicarbonate) or equimolar NaCl (vehicle) following removal of the spleen (splenectomy)/sham splenectomy and laparotomy only (spleen not moved during surgery) are presented in figure 3a-g. All data are from rats placed on treated water (vehicle or bicarbonate) for 3 days before being switched to a HS diet for an additional 14 days prior to tissue harvest. Panel a; the percentage of total kidney cells identified as M1 macrophages(CD11b/Figure 4/80+/TNFα+ cells) and M2 macrophages (CD11b/CD206+/IL10+ cells) in vehicle (n=4; filled circles) and bicarbonate (n=6; filled squares) treated rats in which the spleen was removed. Panel b; the percentage of total kidney cells identified as M1 macrophages(CD11b/Figure 4/80+/TNFα+ cells) and M2 macrophages (CD11b/CD206+/IL10+ cells) in vehicle (n=5; filled circles) and bicarbonate (n=5; filled squares) treated rats in which the spleen was moved to midline during surgery but not removed (sham splenectomy). Panel c; the percentage of total kidney cells identified as M1 macrophages(CD11b/Figure 4/80+/TNFα+ cells) and M2 macrophages (CD206+/IL10+ cells) in vehicle (n=5; filled circles) and bicarbonate (n=5; filled squares) treated rats in which the spleen was untouched during surgery (Sham Sham). Panel d; the percentage of total renal cells identified as M1 macrophages (CD11b/Figure 4/80+/TNFα+ cells) in vehicle treated rats in rats in which the spleen was removed (splenectomy), moved but not removed (sham spleen) and left untouched (Sham Sham) ∼28 days prior to tissue harvest. Individual animal data re shown (filled circles) with mean and SE. Panel e; the percentage of total renal cells identified as M1 macrophages (Figure 4/80+/TNFα+ cells) in bicarbonate treated rats in rats in which the spleen was removed (splenectomy), moved but not removed (sham spleen) and left untouched (Sham Sham) ∼28 days prior to tissue harvest. Individual animal data re shown (filled circles) with mean and SE. Panel f; the percentage of total renal cells identified as M2 macrophages (CD206+/IL10+ cells) in vehicle treated rats in rats in which the spleen was removed (splenectomy), moved but not removed (sham spleen) and left untouched (Sham Sham) ∼28 days prior to tissue harvest. Individual animal data re shown (filled circles) with mean and SE. Panel g; the percentage of total renal cells identified as M2 macrophages (CD206+/IL10+ cells) in bicarbonate rats in rats in which the spleen was removed (splenectomy), moved but not removed (sham spleen) and left untouched (Sham Sham) ∼28 days prior to tissue harvest. Individual animal data re shown (filled circles) with mean and SE.
Figure 5
Figure 5
Mixed lymphocyte reaction. (Top) Representative flow cytometry dotplots depict cellular proliferation of T cells after 96 hours of incubation with mixed splenocytes from animals either treated with oral Nacl (Left: 0.1M for 3 days) or NaHCO3 (Right; 0.1M for 3 days). X axis CD71+ cells. Y axis CD3+ cells. Mean data ± SE as well as individual animal data (circles; n=3 for each treatment group), are shown in the lower panel. P = result of unpaired t-test.
Figure 6
Figure 6
Data from flow cytometric analysis of macrophage polarization (M1/M2) from spleens of male Sprague Dawley rats drinking either 0.1M NaHCO3 (bicarbonate; filled squares; n=9) or equimolar NaCl (vehicle; filled circles; n=9) or bicarbonate with inhibition with methyllycaconitine (MLA: 5mg/kg; Sigma; bicarbonate + MLA; crossed squares; n=6) and bicarbonate + esomeprazole (20mg/kg; Sigma; empty squares; n=6). All data are from rats placed on treated water (vehicle or bicarbonate) for 3 days. Y axis, the percentage of total kidney cells identified as M1 macrophages (CD68+/CD163+/CD206-/TNFα+ cells) and M2 macrophages (CD68+/CD163+/CD206+/IL-10+ cells). PTREATMENT*POLARIZATION = the output of a 2-way ANOVA comparing all treatment groups. P<0.05 was considered significant.
Figure 7
Figure 7
Effect of splenic movement/vagal denervation on the splenic mesothelium. Panel a; Shown is a spleen harvested from a surgical control rat (top; laparotomy only) and rat in which the spleen was moved to midline during surgery. Surgery was performed on both rats 28 days prior to tissue harvest. Fibrosis of parts of the splenic capsule (arrow) can be observed in spleens harvested from rats in which the spleen was manipulated to midline during surgery. Panel b; Shown is trichrome stained image of the splenic capsule (original magnification 20×) demonstrating thickening on the capsule (blue staining) and mesothelial cell hypertrophy and hyperplasia (pink on capsule) typical of a spleen that has been manipulated to midline during surgical laparotomy. Panel c; Shown is normal capsule histology (original magnification 20×) in a surgical sham rat in which the spleen was not moved (trichrome staining). Not the thin capsule and flattened mesothelial cell layer when compared to the image shown in b. Panel d; Acetylcholine esterase staining of capsular mesothelial cells in a surgical sham rat. Note the flattened appearance of the mesothelial cells and strong positive staining for acetylcholine esterase. Original image magnification 20×. Panel e; Acetylcholine esterase staining of capsular mesothelial cells in a rat in which the spleen had been moved to midline during surgery. Note the thickened capsular layer and hypertrophied appearance of the mesothelial cells. Positive staining for acetylcholine esterase is present but markedly less than that observed in control tissue. Original image magnification 20×. Panel f; Acetylcholine esterase staining of capsular mesothelial cells in a surgical sham rat in which the esophagus was visualized but the vagal nerves left untouched without moving the spleen. Note the flattened appearance of the mesothelial cells and strong positive staining for acetylcholine esterase. Original image magnification 40×. Panel g; Acetylcholine esterase staining of capsular mesothelial cells in a rat in which the vagal nerves were transected below the diaphragm without moving the spleen 14 days prior to tissue harvest. Note the absence of positive staining for acetylcholine esterase specifically in the surface mesothelial layer. Original image magnification 40×. Panel h; Low power image of spleen described in panel f. Mesothelial cells staining positive for acetylcholine esterase can be observed as a necklace like appearance along the splenic capsule (indicated by arrows). Original magnification 10×. Panel i; Low power image of spleen described in panel g. Note the lack of positive stained mesothelial cells on the splenic capsule. Acetylcholine esterase staining remains similar to control tissue in all other regions of the splenic parenchyma. Cells within and immediately below the capsule continue to stain positive for acetylcholine esterase. Original magnification 10×.
Figure 8
Figure 8
Evidence of neuronal connections to the splenic mesothelium. Panel a; Thin connections to the splenic capsule can be observed in trichrome stained rat spleens at low power (original magnification 5×) that are not observed by the naked eye (arrow). The origin of these connections is uncertain but they appear to be common at the splenic poles and along the inferior edge of the spleen surface. Panel b; A connection at higher magnification (original magnification 40×). Trichrome stained tissue connects on the capsular surface often forming a ‘raised nodule’ which protrudes from the capsule more than the surrounding mesothelial layer. Panel c; These connections stain strongly positive for the pan neuronal marker PGP9.5. Shown is a connection from a control rat stained for PGP9.5. Note also positive staining on the surrounding mesothelial layer. This was present only on the inferior axis of the spleen and was most evident in areas where connections such as this were observed. Original magnification 40×. Panel d; PGP9.5 staining of capsular mesothelial cells in a surgical sham rat. Note the flattened appearance of the mesothelial cells and strong positive staining for PGP9.5. Original image magnification 40×. Panel e; These connections stain negative positive for the sympathetic neuronal marker tyrosine hydroxylase. Note strong positive staining was observed around blood vessels in the splenic parenchyma (one can be observed directly below the intersection point of this connection). Original image magnification 20×. Panel f; Acetylcholine esterase staining within a connection to the splenic capsule in a control rat. Note punctate positive staining for acetylcholine esterase throughout the connection. Positive staining for acetylcholine esterase can also be observed in the surrounding capsular mesothelial cells and underlying splenic parenchyma. Original image magnification 40×. Panel g; PGP9.5 staining at the inferior edge of the spleen. Mesothelial cells in this region stain strongly positive for the pan neuronal marker PGP9.5. Original image magnification 5×. Panel h; Tyrosine hydroxylase staining at the inferior edge of the spleen. Mesothelial cells in this region stain negative for the sympathetic neuronal marker tyrosine hydroxylase. Original image magnification 5×. Panel I; Acetylcholine esterase staining at the inferior edge of the spleen. Mesothelial cells in this region stain strongly positive for the para-sympathetic neuronal marker acetylcholine esterase. Original image magnification 5×.
Figure 9
Figure 9
Neuronal like structures identified within mesothelial cells connecting to the splenic capsule. Panel A-B; Osmium stained electron micrographs of mesothelial cells on the inferior edge of a Sprague Dawley rat splenic capsule located close to the branch point of a connection. Mesothelial cells were identified by their location above the collagen layer of the splenic capsule and their numerous micro villi. Structures within the mesothelial cell cytoplasm resemble similar structures fond in neuronal tissue. In these images electron dense structures similar to that of synaptic junctions (S) can be observed between two circular structures. In panel A, one of these low density circular structures contains a single mitochondrion. These structures are similar to that observed in dendrites of neuronal cells (d). More densely filled structures run adjacent to the dendritic structure separated by (S), which resemble axons (a) in their arrangement with the dendritic structures and greater electron density. No clear vesicular structures were observed within (a). Panel C and E; Many of the ‘axonal looking’ structures (a) were found to contain a dense elongated core, similar to synaptic ribbons (r) observed in the axons of rapidly firing neural cells. Panel D and F; Shown in panel d and f are urethane stained sections which provide less ultrastructural contrast but allow antigen specific staining. Immuno-gold labeling of antibodies against ribeye, a core component of synaptic ribbons, demonstrated gold particle deposition on the dark banded structures within mesothelial cells that resembled synaptic ribbons (r). Panel G; In this low magnification osmium stained section, a tissue connection with the splenic capsule can be observed. Mesothelial cells, identified by their microvilli can be seen lining the entire length connection before making contact with other mesothelial cells on the splenic surface. At higher magnification more than 15 object pairs, similar to that observed in panels c and d containing all of axon (a), ribbon (r) and dendritic (d) like structures can be seen in this image. Panels H and I; Paraffin embedded sections of rat spleen stained with anti-ribeye, a core component of synaptic ribbons. As shown in panel H, mesothelial cells located on structures that connect to the splenic capsule as well as mesothelial cells immediately adjacent to these junctions, stain positive for ribeye. As demonstrated in panel I, mesothelial in areas where these junctions are not present are negative for ribeye while the splenic parenchyma is positive.
Figure 10
Figure 10
Dense network of acetylcholine esterase positive nerves immediately below the splenic capsule. Panel a and d; Thin (5mm) sections through the frontal plane of the splenic capsule indicate strong and diffuse positive staining for the pan neuronal marker PGP9.5 in the capsular layer. Panel a, original magnification 5×. Panel d, original magnification 20×. Panel b and e; Thin (5mm) sections through the frontal plane of the splenic capsule indicate strong positive staining for the sympathetic neuronal marker tyrosine hydroxylase in the capsular layer with tyrosine hydroxylase positive tissue forming a lose web of interconnected nerves. Panel b, original magnification 5×. Panel e, original magnification 20×. Panel c and f; Thin (5mm) sections through the frontal plane of the splenic capsule indicate strong and diffuse positive staining for the para-sympathetic neuronal marker acetylcholine esterase in the capsular layer. Panel c, original magnification 5×. Panel f, original magnification 20×. Panel g; The splenic capsule viewed at 40X on a confocal microscope. Tissue was loaded with the Ca2+ sensitive indicator fluo-4. Note a dense layer of nerve tissue can be observed directly below the mesothelial cell layer across the entire splenic capsule. The density of this neural web is much greater than that observed in panel b and e in tissue stained positive for tyrosine hydroxylase, indicating additional nerve tissue is present. Activation of these nerves can be stimulated by electrical field stimulation (see supplement) Panel h; Transmission electron microscopy indicates that nerves sit directly below the splenic capsule. Black arrow indicates capsular mesothelial cell. White arrow indicates nerve closely associated with the splenic capsule. Bar=5μm. Panel i; Nerves are identified by the presence intracellular vesicles typical of synaptic junctions.
Figure 11
Figure 11
Tissue weights 2 weeks following surgery in Sprague Dawley rats. Data are mean±SE. P values represent results of 2-way ANOVA comparing groups as indicated. P<0.05 was considered significant. N=15/9/5/5 for control (laparotomy only), vagotomy only, moved spleen o

References

    1. Cao Q, Harris DC, Wang Y. Macrophages in kidney injury, inflammation, and fibrosis. Physiology (Bethesda) 2015;30:183–194. - PubMed
    1. Amdur RL, Feldman HI, Gupta J, Yang W, Kanetsky P, Shlipak M, Rahman M, Lash JP, Townsend RR, Ojo A, Roy-Chaudhury A, Go AS, Joffe M, He J, Balakrishnan VS, Kimmel PL, Kusek JW, Raj DS. Inflammation and Progression of CKD: The CRIC Study. Clin J Am Soc Nephrol. 2016;11:1546–1556. - PMC - PubMed
    1. Kim HW, Lee CK, Cha HS, Choe JY, Park EJ, Kim J. Effect of anti-tumor necrosis factor alpha treatment of rheumatoid arthritis and chronic kidney disease. Rheumatol Int. 2014;35:727–734. - PubMed
    1. Tracey KJ. The inflammatory reflex. Nature. 2002;420:853–859. - PubMed
    1. Inoue T, Abe C, Sung SS, Moscalu S, Jankowski J, Huang L, Ye H, Rosin DL, Guyenet PG, Okusa MD. Vagus nerve stimulation mediates protection from kidney ischemia-reperfusion injury through alpha7nAChR+ splenocytes. J Clin Invest. 2016;126:1939–1952. - PMC - PubMed

Publication types

MeSH terms