. 2018 May 21;131(10):jcs213587.
doi: 10.1242/jcs.213587.

Lysosome enlargement during inhibition of the lipid kinase PIKfyve proceeds through lysosome coalescence

Affiliations

Lysosome enlargement during inhibition of the lipid kinase PIKfyve proceeds through lysosome coalescence

Christopher H Choy et al. J Cell Sci. .

Abstract

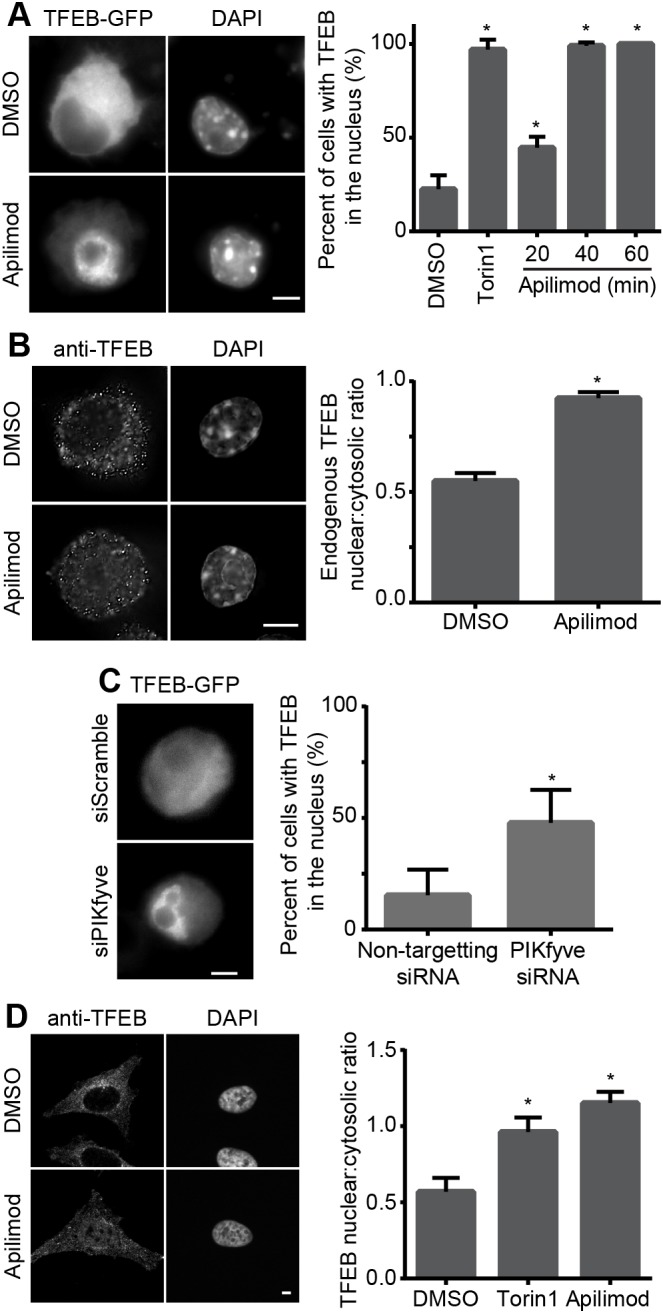
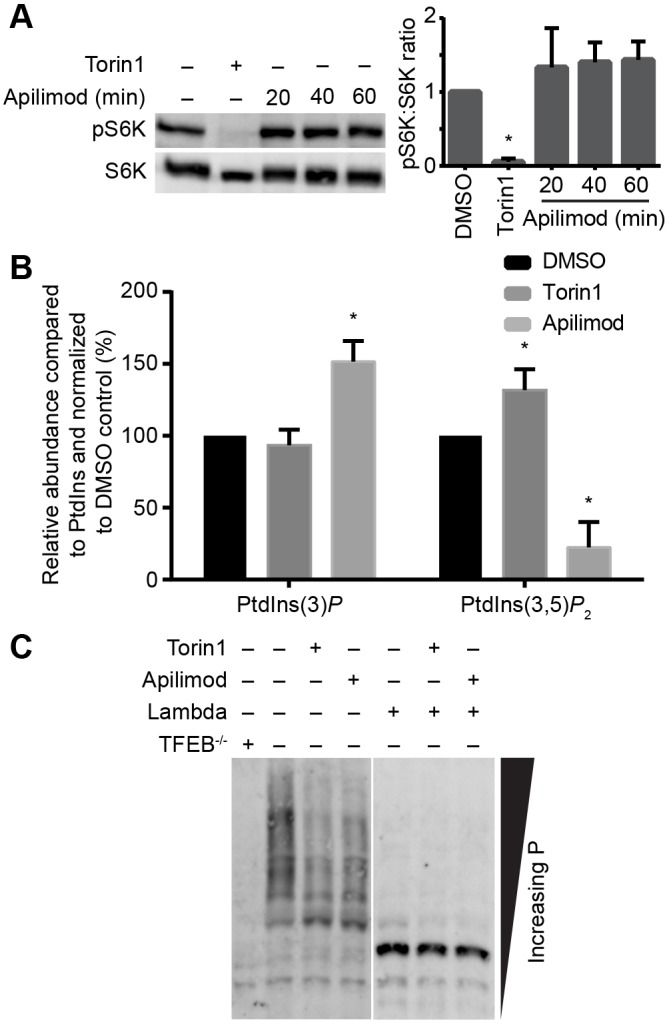
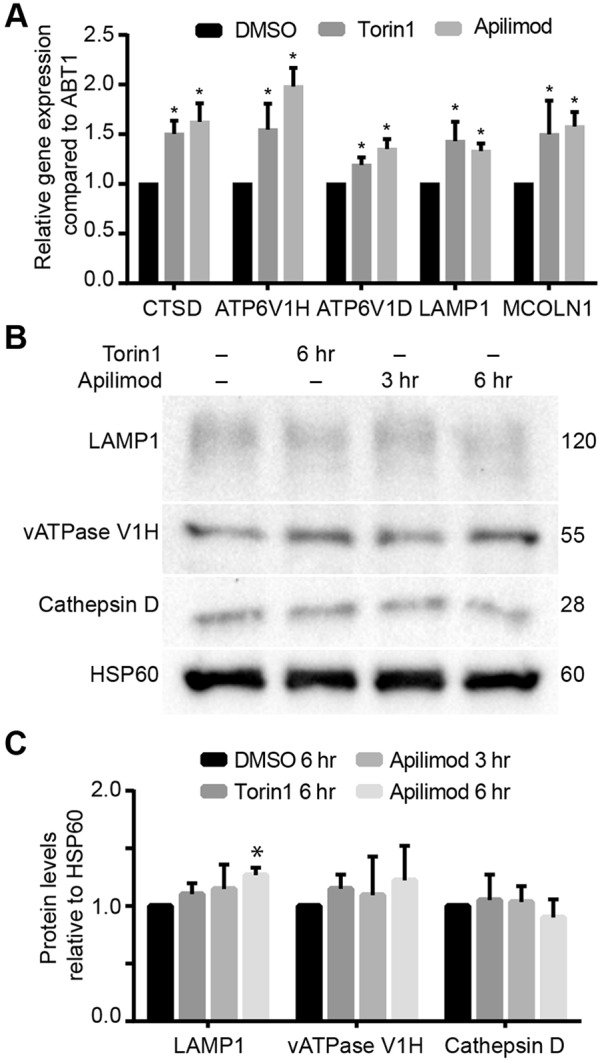
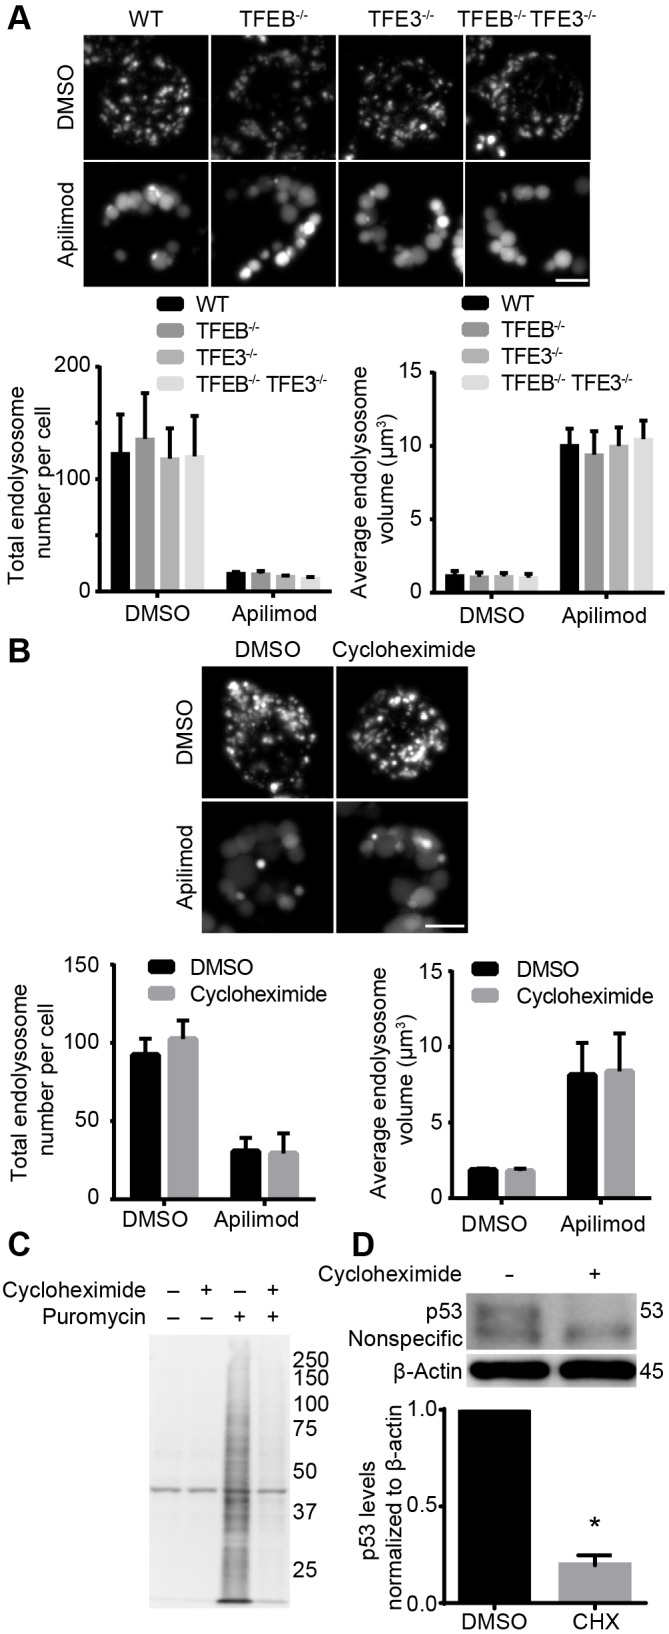
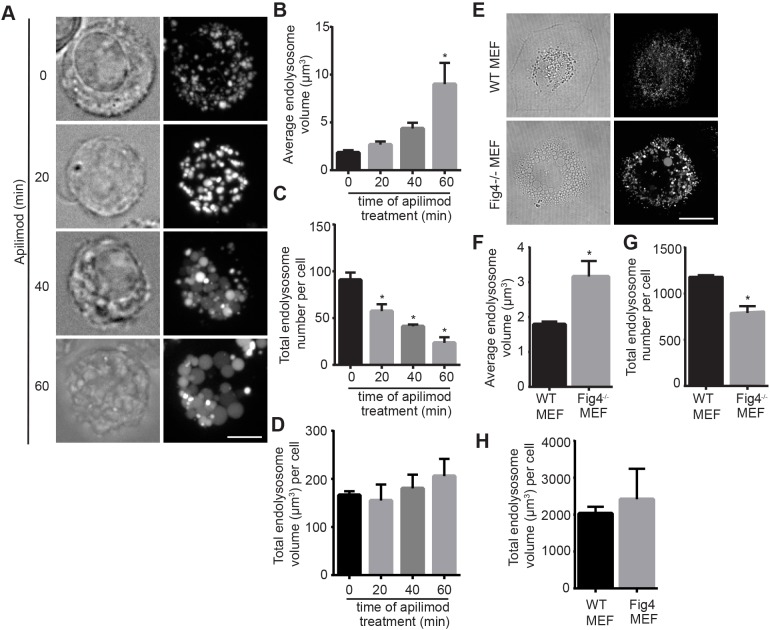
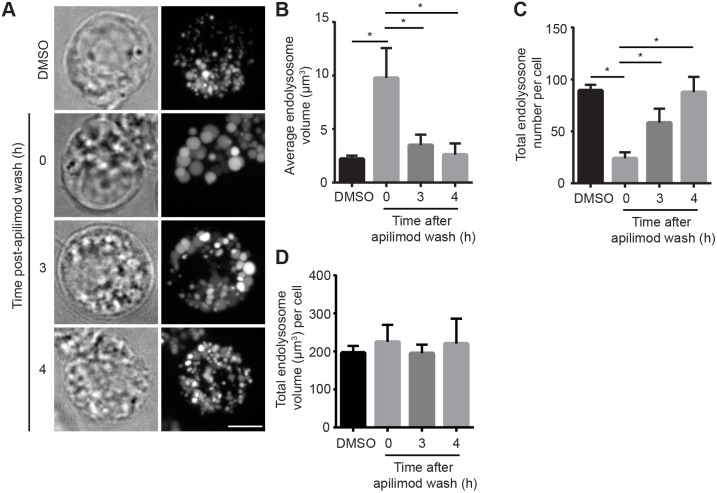
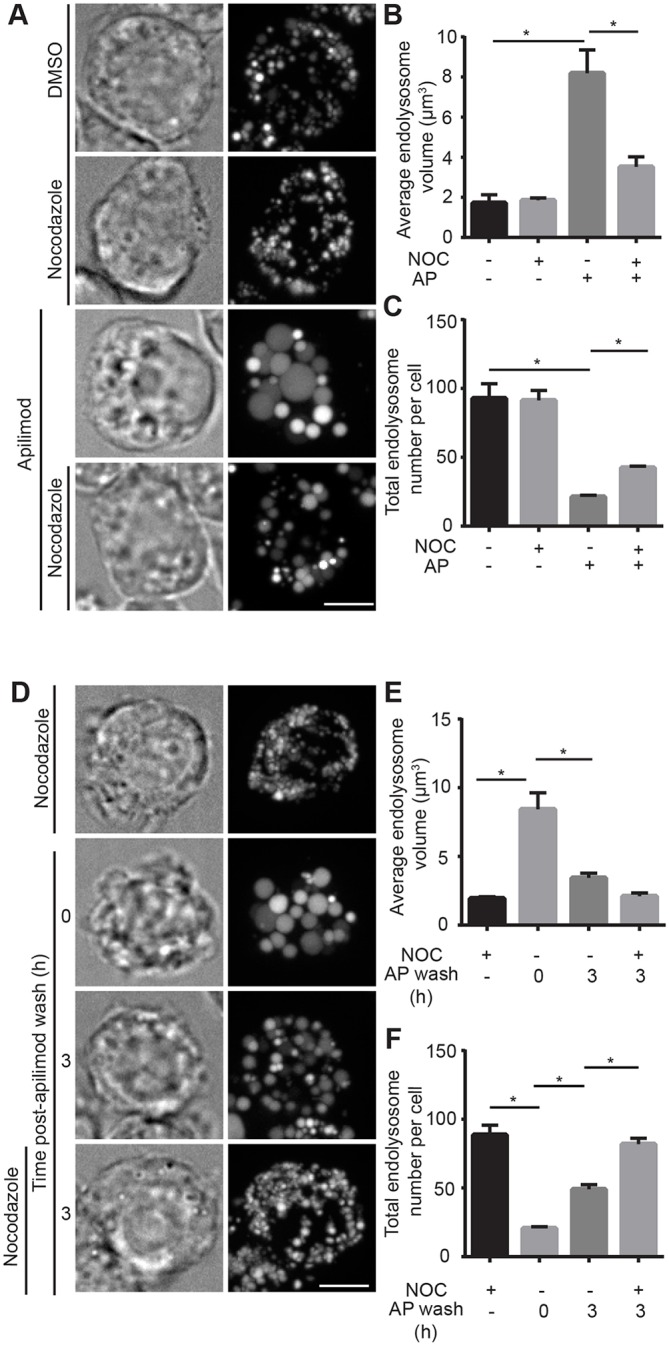
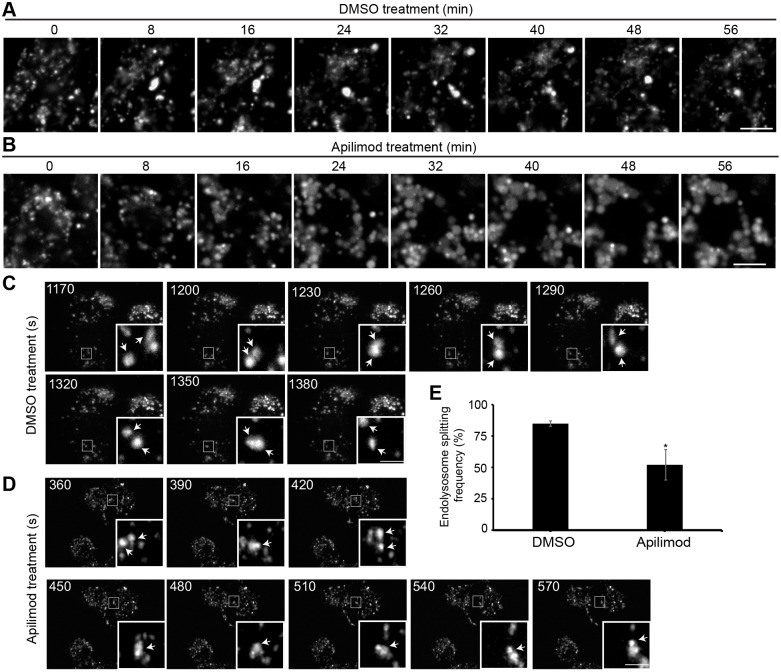
Lysosomes receive and degrade cargo from endocytosis, phagocytosis and autophagy. They also play an important role in sensing and instructing cells on their metabolic state. The lipid kinase PIKfyve generates phosphatidylinositol-3,5-bisphosphate to modulate lysosome function. PIKfyve inhibition leads to impaired degradative capacity, ion dysregulation, abated autophagic flux and a massive enlargement of lysosomes. Collectively, this leads to various physiological defects, including embryonic lethality, neurodegeneration and overt inflammation. The reasons for such drastic lysosome enlargement remain unclear. Here, we examined whether biosynthesis and/or fusion-fission dynamics contribute to swelling. First, we show that PIKfyve inhibition activates TFEB, TFE3 and MITF, enhancing lysosome gene expression. However, this did not augment lysosomal protein levels during acute PIKfyve inhibition, and deletion of TFEB and/or related proteins did not impair lysosome swelling. Instead, PIKfyve inhibition led to fewer but enlarged lysosomes, suggesting that an imbalance favouring lysosome fusion over fission causes lysosome enlargement. Indeed, conditions that abated fusion curtailed lysosome swelling in PIKfyve-inhibited cells.

Keywords: Fission; Fusion; Lysosomes; Organelles; Phosphoinositides; Transcription factors.


Conflict of interest statement

Competing interestsThe authors declare no competing or financial interests.

Figures

Fig. 1.
Fig. 1.
PIKfyve inhibition causes nuclear translocation of TFEB. (A,B) RAW cells expressing TFEB-GFP (A) or stained for endogenous TFEB (B) treated with vehicle or 20 nM apilimod for 1 h. (C) RAW cells silenced for PIKfyve or mock-silenced and expressing TFEB-GFP. (D) HeLa cells stained for endogenous TFEB treated with vehicle or 20 nM apilimod for 1 h. DAPI was used to stain the nuclei. Nuclear translocation of TFEB was quantified either as percentage of cells containing nuclear GFP-tagged TFEB (A,C) or as the nuclear-to-cytosol fluorescence intensity ratio for endogenous TFEB (B,D). Shown is the mean and s.e.m. from at least three independent experiments and based on 50-300 cells per condition per experiment. *P<0.05 compared with respective control conditions using one-way ANOVA and Tukey's post hoc test or with an unpaired Student's t-test, as appropriate. Scale bars: 5 µm.
Fig. 2.
Fig. 2.
mTOR and PIKfyve function independently. (A) Western blot detection of phosphoThr389-p70S6K and total p70S6K in PIKfyve-inhibited cells treated as indicated. The ratio of phospho-S6K to total S6K was quantified from three independent blots. Shown is the mean ratio and s.d. normalized to DMSO-treated cells. (B) Quantification of PtdIns(3)P and PtdIns(3,5)P2 levels using 3H-myo-inositol incorporation and HPLC-coupled flow scintillation. Results are shown as the mean and s.d. from three independent experiments, normalized to their PtdInsP levels and to the respective DMSO-treated controls. *P<0.05 compared with respective control conditions using multiple Student's t-test with the Bonferroni correction. (C) Western blot showing TFEB expression in whole-cell lysates resolved on a Phos-tag gel. Shown in a representative blot from three independent experiments showing differential migration of TFEB in lysates from control relative to torin1- and apilimod-treated cells. Anti-TFEB antibody specificity was confirmed by the loss of most bands in Tfeb−/− RAW whole-cell lysates. In addition, most bands represent phosphorylated isoforms of TFEB since pre-treatment of lysates with λ protein phosphatase led to a single fast-running band.
Fig. 3.
Fig. 3.
Acute PIKfyve inhibition enhances lysosomal gene transcription but not protein levels. (A) Expression of selected lysosomal genes quantified by qRT-PCR and normalized against Abt1. Shown is the mean±s.e.m. from seven independent experiments. (B) Western blot of selected lysosomal proteins in RAW cells treated as indicated. Numbers on the right represent relative molecular mass (kDa). (C) Quantification of indicated proteins demonstrated in B and shown as the mean±s.e.m. intensity from four independent blots. *P<0.05 compared with respective control conditions using multiple Student's t-test with the Bonferroni correction.
Fig. 4.
Fig. 4.
Volumetric analysis of endo/lysosomes in PIKfyve-curtailed wild-type, Tfeb−/−, Tfe3−/− and Tfeb−/−Tfe3−/− RAW cells. (A) Cells were pre-labelled with Lucifer Yellow and then treated with apilimod to induce lysosome vacuolation. Lysosome number and lysosome volume were quantified from 100 cells from three independent experiments. (B) Lysosome morphology in wild-type RAW cells treated as indicated. Lysosome volume and number were quantified. In all cases, data shown are the mean±s.e.m. from three independent experiments, with at least 100 cells per condition per experiment. (C) Puromycylation of proteins in the absence and presence of cycloheximide. Puromycin is incorporated into elongating proteins by the ribosome, which can be detected by anti-puromycin antibodies during western blotting. Cycloheximide treatment eradicated puromycylation of proteins by blocking protein synthesis. The first two lanes resolved lysates unexposed to puromycin and thus accounts for non-specific bands detected by anti-puromycin antibodies. Representative blot shown from three independent experiments. (D) Cycloheximide reduces p53 abundance relative to β-actin. Representative blot shown from three independent experiments. Numbers on the right represent relative molecular mass (in kDa). Data are mean±s.e.m. abundance by measuring p53 signal as a ratio against β-actin. *P<0.05 compared with respective control conditions using Student's t-test. Scale bars: 5 µm.
Fig. 5.
Fig. 5.
Volumetric analysis of endo/lysosomes during acute and chronic PIKfyve suppression. (A) RAW cells were pre-labelled with Lucifer Yellow and exposed to vehicle only or to 20 nM apilimod for the indicated times. Fluorescence micrographs are z-projections of 45-55 z-planes acquired by spinning disc confocal microscopy. Scale bar: 5 µm. (B-D) Quantification of individual endo/lysosome volume (B), endo/lysosome number per RAW macrophage (C) and total endo/lysosome volume (D). (E) Wild-type and Fig4−/− mouse embryonic fibroblasts labelled with Lucifer Yellow. Scale bar: 30 µm. (F-H) Analysis of individual endo/lysosome volume (F), endo/lysosome number per cell (G) and total endo/lysosome volume per cell (H) in wild-type and Fig4−/− mouse embryonic fibroblasts. In all cases, data shown are the mean±s.e.m. from three independent experiments, with at least 15-20 cells per condition per experiment. *P<0.05 compared with respective control conditions using one-way ANOVA and Tukey's post hoc test for B-D, and unpaired Student's t-test for F-H.
Fig. 6.
Fig. 6.
Volumetric analysis of endo/lysosome number and volume during PIKfyve reactivation. (A) Cells were pre-labelled with Lucifer Yellow as before and then exposed to vehicle only or to 20 nM apilimod for 1 h, followed by removal and chase in fresh medium for the indicated times. Fluorescence micrographs are z-projections of 45-55 z-planes acquired by spinning disc confocal microscopy. Scale bar: 5 µm. (B-D) Volumetric quantification of individual endo/lysosome volume (B), endo/lysosome number per cell (C) and total endo/lysosome volume per cells (D). Data shown are the mean±s.e.m. from three independent experiments, with at least 15-20 cells per condition per experiment. *P<0.05 between data indicated by lines using one-way ANOVA and Tukey's post hoc test.
Fig. 7.
Fig. 7.
Volumetric analysis of endo/lysosome number and volume in cells disrupted for microtubule function. (A) Cells were pre-labelled with Alexa Fluor 488-conjugated dextran, followed by vehicle alone, 10 µM nocadozole for 60 min, or co-treated with apilimod and vehicle or nocadozole for 1 h. Fluorescence micrographs are z-projections of 45-55 z-planes acquired by spinning disc confocal microscopy. (B,C) Quantification of individual endo/lysosome volume (B) and endo/lysosome number per RAW macrophage (C). (D) Cells were pre-labelled with Alexa Fluor 488-conjugated dextran as before, followed by 20 nM apilimod for 1 h and then replaced with fresh medium or medium containing nocadozole for the indicated time period. (E,F) Volumetric quantification of individual endo/lysosome volume (E) and endo/lysosome number per cell (D). In all cases, data shown are the mean±s.e.m. from three independent experiments, with at least 15-20 cells per condition per experiment. *P<0.05 statistical difference between conditions indicated by lines using one-way ANOVA and Tukey's post hoc test. Scale bars: 5 µm.
Fig. 8.
Fig. 8.
Live-cell imaging of apilimod-induced lysosome swelling. (A,B) Cells were pre-labelled with Alexa Fluor 546-conjugated dextran, followed by (A) vehicle alone or (B) 20 nM apilimod at time 0 min. Single-plane images were obtained by spinning disc microscopy at 1 frame/2 min. Time in min refers to time after adding vehicle or apilimod. See Movies 3 and 4 for full capture. Scale bars: 5 µm. (C,D) Swep-tfield imaging of RAW cells exposed to (C) vehicle or (D) 20 nM apilimod. See Movies 5 and 6 for full capture. Shown are z-collapsed frames at 30 s intervals. The inset is a magnified portion of the field-of-view tracking a few endo/lysosomes (arrows) undergoing contact and split events, which may represent fusion or fission. Scale bars: 3 µm. (E) Rate of ‘splitting’ events over 30 min in vehicle- or apilimod-treated cells showing a reduction in splitting in PIKfyve-inhibited cells, which may reflect reduced fission. *P<0.05 by Student's t-test.

References

    1. Bagshaw R. D., Callahan J. W. and Mahuran D. J. (2006). The Arf-family protein, Arl8b, is involved in the spatial distribution of lysosomes. Biochem. Biophys. Res. Commun. 344, 1186-1191. 10.1016/j.bbrc.2006.03.221 - DOI - PubMed
    1. Bissig C., Hurbain I., Raposo G. and van Niel G. (2017). PIKfyve activity regulates reformation of terminal storage lysosomes from endolysosomes. Traffic. 11, 747-757. 10.1111/tra.12525 - DOI - PubMed
    1. Bridges D., Ma J.-T., Park S., Inoki K., Weisman L. S. and Saltiel A. R. (2012). Phosphatidylinositol 3,5-bisphosphate plays a role in the activation and subcellular localization of mechanistic target of rapamycin 1. Mol. Biol. Cell 23, 2955-2962. 10.1091/mbc.E11-12-1034 - DOI - PMC - PubMed
    1. Bright N. A., Gratian M. J. and Luzio J. P. (2005). Endocytic delivery to lysosomes mediated by concurrent fusion and kissing events in living cells. Curr. Biol. 15, 360-365. 10.1016/j.cub.2005.01.049 - DOI - PubMed
    1. Bryant N. J., Piper R. C., Weisman L. S. and Stevens T. H. (1998). Retrograde traffic out of the yeast vacuole to the TGN occurs via the prevacuolar/endosomal compartment. J. Cell Biol. 142, 651-663. 10.1083/jcb.142.3.651 - DOI - PMC - PubMed

Publication types

MeSH terms

Substances