Randomized Controlled Trial
. 2018 Jun 26;62(7):e02476-17.
doi: 10.1128/AAC.02476-17. Print 2018 Jul.

Characterizing Blood-Stage Antimalarial Drug MIC Values In Vivo Using Reinfection Patterns

Affiliations
Randomized Controlled Trial

Characterizing Blood-Stage Antimalarial Drug MIC Values In Vivo Using Reinfection Patterns

James Watson et al. Antimicrob Agents Chemother. .

Abstract

The MIC is an essential quantitative measure of the asexual blood-stage effect of an antimalarial drug. In areas of high malaria transmission, and thus frequent individual infection, patients who are treated with slowly eliminated antimalarials become reinfected as drug concentrations decline. In the frequent relapse forms of Plasmodium vivax and in Plasmodium ovale malaria, recurrent infection occurs from relapses which begin to emerge from the liver approximately 2 weeks after the primary illness. An important determinant of the interval from starting treatment of a symptomatic infection to the patency of these recurrent infections is the in vivo concentration-response relationship and thus the in vivo MIC. Using mechanistic knowledge of parasite asexual replication and the pharmacokinetic and pharmacodynamic properties of the antimalarial drugs, a generative statistical model was derived which relates the concentration-response relationship to time of reinfection patency. This model was used to estimate the in vivo MIC of chloroquine in the treatment of Plasmodium vivax malaria.

Keywords: MIC; antimalarial agents; chloroquine; pharmacodynamics; pharmacokinetics.


Figures

FIG 1
FIG 1
The theoretical dynamics of temporal clustering or bunching of new infections for a hypothetical slowly eliminated drug. (Top left) Mean pharmacokinetic profile of the drug, a first-order elimination with a half-life of 6 days. The IC50 (parasite reduction ratio of 1/5), MIC (parasite reduction ratio of 1), and EC50 (parasite reduction ratio of 500) are shown by dashed horizontal red lines. (Top right) Response-concentration function of the drug on a log10 scale. (Bottom left) time trajectories of total parasite biomass for daily new infections emerging from liver at a biomass of 104 parasites where 108 is the total parasite biomass in an adult associated with the onset of illness (pyrogenic threshold) and is also the lowest number of parasites readily detectable by microscopy. (Bottom right) Histogram of patent infections over time.
FIG 2
FIG 2
All pharmacokinetic samples up to day 60 from symptomatic patients with P. vivax malaria treated with chloroquine on the Thailand-Myanmar border. The whole-blood chloroquine concentration is plotted on a log10 scale. Outliers have been removed (see Materials and Methods).
FIG 3
FIG 3
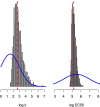
Prior and posterior distributions from ABC algorithm of concentration-response (PD) of chloroquine in vivax malaria patients from the Thai-Myanmar border. The algorithm estimates two pharmacodynamic parameters: the natural logarithm of the slope of the concentration-response (left) and the natural logarithm of the EC50 (right). The vertical dashed red line shows the median posterior value. The histogram shows the estimate of the posterior distribution and the thick blue line shows the prior distribution.
FIG 4
FIG 4
Estimated pharmacokinetics and pharmacodynamics of chloroquine (CQ) in the treatment of Plasmodium vivax in symptomatic patients from the Thailand-Myanmar border. (Left) fitted population pharmacokinetics showing median and 90% coverage intervals over time. The horizontal red dashed line shows the estimated whole-blood MIC of chloroquine in this series, with the vertical dashed lines showing the time window at which the whole blood drug concentrations of 90% of patients go below the MIC (14 to 29 days posttreatment). (Right) concentration-response curve for estimated parameter values. The locations of the IC50, MIC, and EC50 are shown by the dashed red lines.
FIG 5
FIG 5
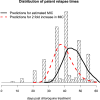
Predicting the shortening in the interval to patent relapse associated with reduced chloroquine susceptibility of P. vivax on the Thailand-Myanmar border. The observed distribution of times until detected relapse is shown by the histogram (note the effect of weekly active detection). The model fit of the distribution of relapse times is shown by the thick black line under current pharmacodynamic parameters. The model predicted distribution of relapse intervals with a doubling of the current estimated MIC parameter is shown by the dashed red line. This corresponds to median shift of 6 days.

References

    1. Beadle C, McElroy PD, Oster CN, Beier JC, Oloo AJ, Onyango FK, Chumo DK, Bales JD, Sherwood JA, Hoffman SL. 1995. Impact of transmission intensity and age on Plasmodium falciparum density and associated fever: implications for malaria vaccine trial design. J Infect Dis 172:1047–1054. doi:10.1093/infdis/172.4.1047. - DOI - PubMed
    1. White NJ. 2008. How antimalarial drug resistance affects post-treatment prophylaxis. Malar J 7:9. doi:10.1186/1475-2875-7-9. - DOI - PMC - PubMed
    1. White NJ. 2013. Pharmacokinetic and pharmacodynamic considerations in antimalarial dose optimization. Antimicrob Agents Chemother 57:5792–5807. doi:10.1128/AAC.00287-13. - DOI - PMC - PubMed
    1. Pukrittayakamee S, Wanwimolruk S, Stepniewska K, Jantra A, Huyakorn S, Looareesuwan S, White NJ. 2003. Quinine pharmacokinetic-pharmacodynamic relationships in uncomplicated falciparum malaria. Antimicrob Agents Chemother 47:3458–3463. doi:10.1128/AAC.47.11.3458-3463.2003. - DOI - PMC - PubMed
    1. Hien TT, White NJ, Thuy-Nhien NT, Hoa NT, Thuan PD, Tarning J, Nosten F, Magnusson B, Jain JP, Hamed K. 2017. Estimation of the in vivo MIC of cipargamin in uncomplicated Plasmodium falciparum malaria. Antimicrob Agents Chemother 61:e01940-16. doi:10.1128/AAC.01940-16. - DOI - PMC - PubMed

Publication types

LinkOut - more resources