. 2018 Apr 16;9(1):1471.
doi: 10.1038/s41467-018-03843-3.

Quantitative assessment of protein activity in orphan tissues and single cells using the metaVIPER algorithm

Affiliations

Quantitative assessment of protein activity in orphan tissues and single cells using the metaVIPER algorithm

Hongxu Ding et al. Nat Commun. .

Abstract

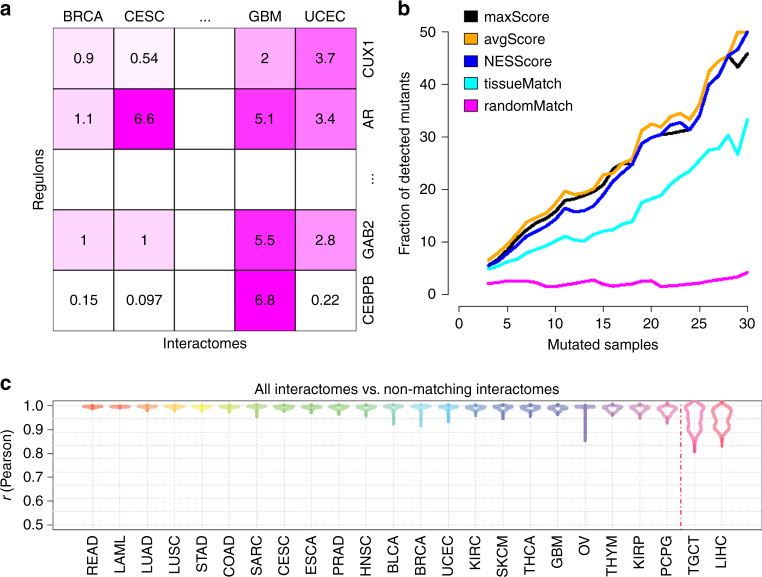
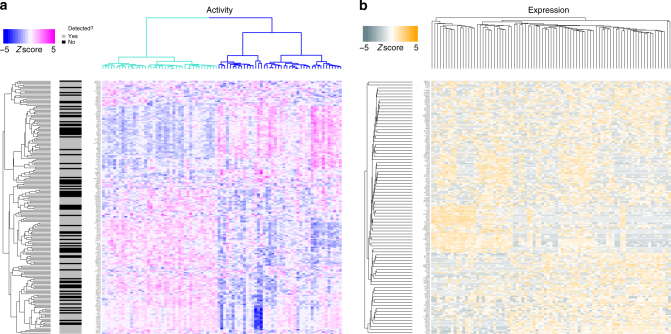
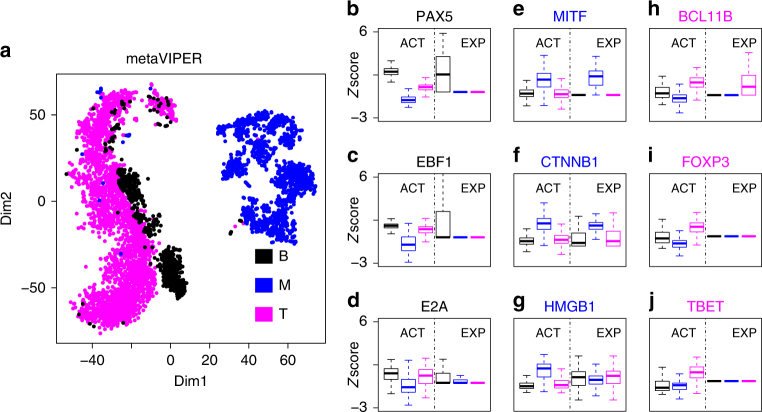
We and others have shown that transition and maintenance of biological states is controlled by master regulator proteins, which can be inferred by interrogating tissue-specific regulatory models (interactomes) with transcriptional signatures, using the VIPER algorithm. Yet, some tissues may lack molecular profiles necessary for interactome inference (orphan tissues), or, as for single cells isolated from heterogeneous samples, their tissue context may be undetermined. To address this problem, we introduce metaVIPER, an algorithm designed to assess protein activity in tissue-independent fashion by integrative analysis of multiple, non-tissue-matched interactomes. This assumes that transcriptional targets of each protein will be recapitulated by one or more available interactomes. We confirm the algorithm's value in assessing protein dysregulation induced by somatic mutations, as well as in assessing protein activity in orphan tissues and, most critically, in single cells, thus allowing transformation of noisy and potentially biased RNA-Seq signatures into reproducible protein-activity signatures.


Conflict of interest statement

M.J.A. is chief scientific officer of DarwinHealth Inc. A.C. is founder and equity holder of DarwinHealth Inc., a company that has licensed some of the algorithms used in this manuscript from Columbia University. Columbia University is also an equity holder in DarwinHealth Inc. The remaining authors declare no competing interests.

Figures

Fig. 1
Fig. 1
Inferring protein activity with metaVIPER. a Overview of metaVIPER. The set of transcriptional targets for each regulatory protein (its regulon) constitutes the fundamental building blocks of an interactome, which reflect its overall, context-specific regulatory control structure. MetaVIPER identifies the regulon that best recapitulates the regulatory targets of a protein by assessing its enrichment in the tissue-specific differential expression signature. In the example shown here, for instance, the regulon for protein CUX1 in an unknown or orphan tissue is better recapitulated by the uterine corpus endometrial carcinoma (UCEC)-based regulon, while the transcriptional program for the androgen receptor protein (AR) is better recapitulated by the cervical squamous cell carcinoma and endocervical adenocarcinoma (CESC) and glioblastoma (GBM)-based regulons. The numbers indicate –log10(p-value) for enrichment of the regulons on the gene expression signature, as computed by VIPER. b Impact of recurrent coding somatic mutations on metaVIPER-inferred protein activity. Fraction of proteins showing significant association between metaVIPER-inferred protein activity and somatic mutations (p < 0.01) is presented. VIPER analysis was performed using the tissue-matched network (tissueMatch), metaVIPER was performed by integrating the results from individual interactomes using maxScore, avgScore, and NESScore methods; the baseline control was computed by using intercatomes selected at random (randomMatch). The X-axis represents the minimum number of TCGA samples presenting the specific gene mutation required for inclusion of the encoded protein in the analysis. c Inference of protein activity for orphan tissues. MetaVIPER can effectively reproduce differential protein activity in TCGA tissues, even when the corresponding matched interactome is removed from the analysis. The only partial exception is represented by two tissue lineages—liver hepatocellular carcinoma (LIHC) and testicular germ cell tumors (TGCT)—which are defined by highly specific regulatory programs. The probability density distribution for the correlation between protein activities (NES) inferred by metaVIPER using all available interactomes vs. metaVIPER using all, but the tissue-matched interactome (Pearson’s correlation) across all samples is shown by the violin plots
Fig. 2
Fig. 2
Inference of protein activity for single cells from GBM mouse model. a MetaVIPER-based protein activity analysis of single cells from a mouse GBM model, by unsupervised clustering using all annotated transcriptional factors, co-transcriptional factors, and signaling proteins. Two major clusters were identified, corresponding to established mesenchymal (MES, blue) and proneural (PN, turquoise) subtypes, with varying proliferative (Prolif) potential. Indeed, among the top 200 transcriptional factors (i.e., with the highest inter-cluster activity variability), we found established master regulatory transcriptional factors of the MES (FOSL1, FOSL2, RUNX1, CEBPB, CEBPD, MYCN, ELF4), PN (OLIG2, ZNF217), and Prolif (HMGB2, SMAD4, PTTG1, E2F1, E2F8, FOXM1) subtypes. b Subtype representation is lost when clustering is performed based on gene expression profiles
Fig. 3
Fig. 3
Inference of protein activity for single cells profiled by Tirosh et al.. a Annotated cell types (B: B lymphocyte, T: T lymphocyte, M: melanoma cell) were separated by t-SNE analysis, using metaVIPER-inferred activity for all annotated transcriptional factors, co-transcriptional factors, and signaling proteins. Boxplots show metaVIPER-inferred activity, as well as gene expression for tissue-specific lineage markers, including PAX5, EBF1, and E2A for B lymphocyte (bd), MITF, CTNNB1, and HMGB1 for melanocyte (eg), BCL11B, FOXP3, and TBET for T lymphocyte (hj). While these markers are significantly differentially active in these tissues, they could not be effectively assessed at the single cell level, either because no mRNA reads were detected or because markers were not statistically significant in terms of differential gene expression. Boxplots showed the median, lower/upper whiskers, and hinges of z-scores
Fig. 4
Fig. 4
Comparative analysis of single cell metaVIPER performance compared to gene expression based methods. We identified the 100 most differentially expressed genes and differentially active proteins based on the analysis of five synthetic bulk samples created by averaging the expression of 100 randomly selected single cells from the melanoma, B cell, and T cell population clusters, respectively. a, b Based on t-SNE analysis, synthetic bulk samples clustered more tightly when analyzed based on VIPER-inferred protein activity than based on gene expression. c This panel shows the percent of the top 100 most differentially expressed genes/active proteins recapitulated as significantly differentially expressed/active in a given fraction of individual cells against the average expression/activity in a distinct cluster (e.g., a T cell vs. the average of all B cells). The yellow and turquoise curves (1-ECDF) and boxplots (median, lower/upper whiskers, and hinges) summarized the results of RSEM and metaVIPER-based analyses, respectively. d The same analyses were repeated to assess reproducible differential expression/activity of a gene/protein pair, as relevant for virtual FACS analyses. ef Virtual FACS analyses using expression and activity of established lineage marker TFs by RSEM and metaVIPER-based analysis (see main text and Fig. 3 for details). g, h Virtual FACS analysis using expression and activity of STAT4 and POU2F—both identified as differentially expressed and active candidate biomarkers from bulk sample analyses—using the same methods. i, j Virtual FACS analysis based on expression and activity of CD3 and CD19 cell surface markers, as used in standard FACS analyses, using the same methods

References

    1. Clevers H. Wnt/beta-catenin signaling in development and disease. Cell. 2006;127:469–480. doi: 10.1016/j.cell.2006.10.018. - DOI - PubMed
    1. Thiery JP, Acloque H, Huang RY, Nieto MA. Epithelial-mesenchymal transitions in development and disease. Cell. 2009;139:871–890. doi: 10.1016/j.cell.2009.11.007. - DOI - PubMed
    1. Hanahan D, Weinberg RA. Hallmarks of cancer: the next generation. Cell. 2011;144:646–674. doi: 10.1016/j.cell.2011.02.013. - DOI - PubMed
    1. Thiery JP. Epithelial-mesenchymal transitions in tumour progression. Nat. Rev. Cancer. 2002;2:442–454. doi: 10.1038/nrc822. - DOI - PubMed
    1. Califano A, Alvarez MJ. The recurrent architecture of tumour initiation, progression and drug sensitivity. Nat. Rev. Cancer. 2017;17:116–130. doi: 10.1038/nrc.2016.124. - DOI - PMC - PubMed

Publication types

MeSH terms

Substances