. 2018 Apr 16;9(1):1476.
doi: 10.1038/s41467-018-03924-3.

Greenland records of aerosol source and atmospheric lifetime changes from the Eemian to the Holocene

Affiliations

Greenland records of aerosol source and atmospheric lifetime changes from the Eemian to the Holocene

S Schüpbach et al. Nat Commun. .

Abstract

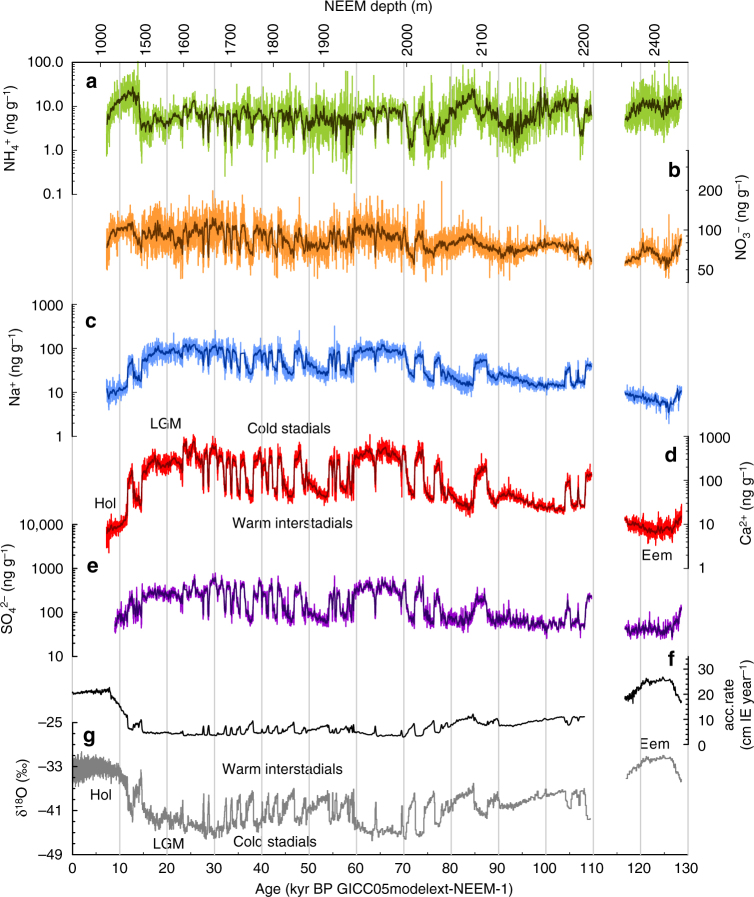
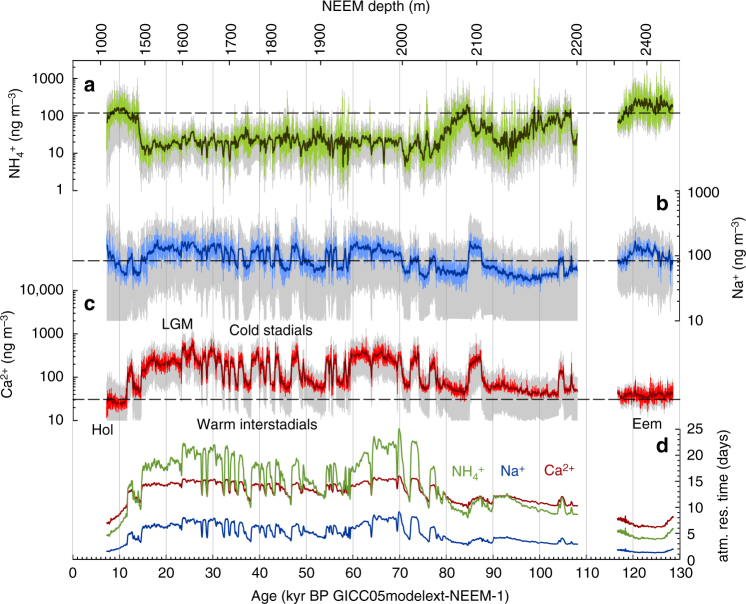
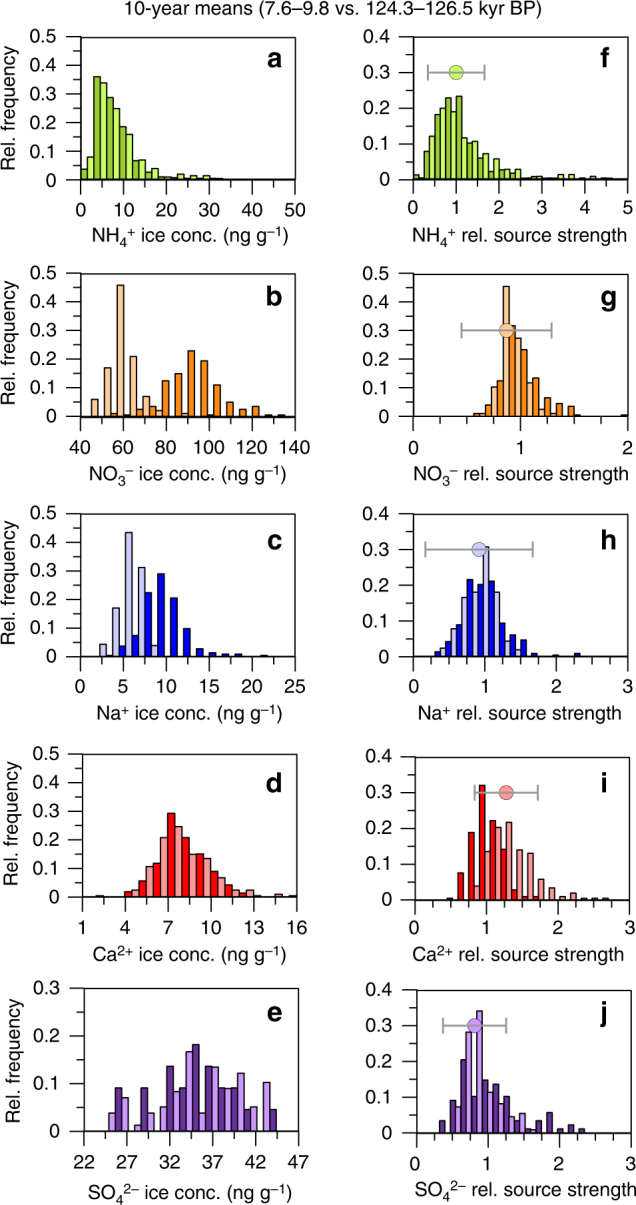
The Northern Hemisphere experienced dramatic changes during the last glacial, featuring vast ice sheets and abrupt climate events, while high northern latitudes during the last interglacial (Eemian) were warmer than today. Here we use high-resolution aerosol records from the Greenland NEEM ice core to reconstruct the environmental alterations in aerosol source regions accompanying these changes. Separating source and transport effects, we find strongly reduced terrestrial biogenic emissions during glacial times reflecting net loss of vegetated area in North America. Rapid climate changes during the glacial have little effect on terrestrial biogenic aerosol emissions. A strong increase in terrestrial dust emissions during the coldest intervals indicates higher aridity and dust storm activity in East Asian deserts. Glacial sea salt aerosol emissions in the North Atlantic region increase only moderately (50%), likely due to sea ice expansion. Lower aerosol concentrations in Eemian ice compared to the Holocene are mainly due to shortened atmospheric residence time, while emissions changed little.


Conflict of interest statement

The authors declare no competing interests.

Figures

Fig. 1
Fig. 1
Measured ion concentrations in the ice. Variations of the aerosol concentration records in the ice in 10-year resolution (light coloured lines) for a NH4+, b NO3, c Na+, and d Ca2+ (note the smaller logarithmic range of the NO3 axis). In the case of SO42− (e) the light thin line represents a five point running mean of the 10 year data, representative of the maximum 40 year resolution that can be achieved with the SO42− data over the entire length of the record. The dark bold lines represent 21 point running means of the 10 year data. The record of the glacial inception is missing due to folding in the ice. In addition, the accumulation rate (black line) is plotted in f for 0–108 kyr BP according to ref. . For the Eemian interval the accumulation is based on an exponential fit of the north west Greenland accumulation and δ18O relationship. In g NEEM δ18O is shown as a grey line in 55 cm resolution for the time period 0–110 kyr BP and for the Eemian period. All data are shown on the GICC05modelext-NEEM-1 age scale in years BP
Fig. 2
Fig. 2
Reconstructed source concentrations. Variations of the source concentration records in 10 year resolution (light coloured lines) for a NH4+, b Na+, and c Ca2+ (note the smaller logarithmic range of the Na+ axis). The dark bold lines represent 21 point running means of the 10 year data. The dashed straight line indicates the early Holocene average. The grey area represents the uncertainty band (1 sigma) as calculated from Gaussian error propagation of the deposition parameters. Note that in the error propagation for the Eemian section only the uncertainty in the past precipitation rate is included, while we assumed that the other deposition parameters in the model were the same for the Eemian and the Holocene and, thus, do not introduce an additional error when comparing Eemian and Holocene values. In panel d the calculated atmospheric residence time for each of the aerosol species is plotted
Fig. 3
Fig. 3
Comparison of Eemian and Holocene concentrations. Histograms of 10-year means in the concentrations in the ice for a NH4+, b NO3, c Na+, d Ca2+, and e SO42− for the early Holocene reference period (dark colors) and the Eemian reference period (light colors). fj shows histograms of the reconstructed source concentration for these aerosol species in 10 year resolution relative to the early Holocene mean for the early Holocene reference period (dark colors) and the Eemian reference period (light colors). The dots indicate the median of the reconstructed relative source concentrations for the Eemian period. The error bars indicate the median of the uncertainty of the calculated relative source concentrations, where only the uncertainty in the past precipitation rate is included in the error propagation assuming that the other deposition parameters were the same for the Eemian and the Holocene. Note that in contrast to Figs. 1 and 2 the accumulation rate used to quantify the wet deposition during the early Holocene is also based on an exponential fit of the north west Greenland accumulation and δ18O relationship

References

    1. Dahl-Jensen D, et al. Past temperatures directly from the Greenland Ice Sheet. Science. 1998;282:268–271. doi: 10.1126/science.282.5387.268. - DOI - PubMed
    1. North Greenland Ice Core Project members. High resolution climate record of the northern hemisphere reaching into the last interglacial period. Nature. 2004;431:147–151. doi: 10.1038/nature02805. - DOI - PubMed
    1. Grootes PM, Stuiver M, White JWC, Johnsen S, Jouzel J. Comparison of oxygen isotope records from the GISP2 and GRIP Greenland ice cores. Nature. 1993;366:552–554. doi: 10.1038/366552a0. - DOI
    1. NEEM community members. Eemian interglacial reconstructed from a Greenland folded ice core. Nature. 2013;493:489–494. doi: 10.1038/nature11789. - DOI - PubMed
    1. de Angelis M, Steffensen JP, Legrand M, Clausen H, Hammer C. Primary aerosol (sea salt and soil dust) deposited in Greenland ice during the last climatic cycle: comparison with east Antarctic records. J. Geophys. Res. 1997;102:26681–26698. doi: 10.1029/97JC01298. - DOI

Publication types

LinkOut - more resources