. 2018 Apr 16;8(1):5992.
doi: 10.1038/s41598-018-23649-z.

Diffusion-Limited Growth of Microbial Colonies

Affiliations

Diffusion-Limited Growth of Microbial Colonies

Hayden Tronnolone et al. Sci Rep. .

Abstract

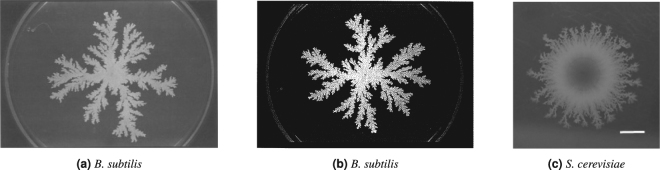
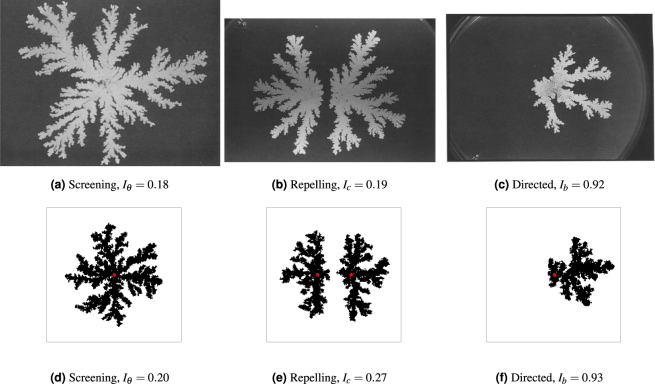
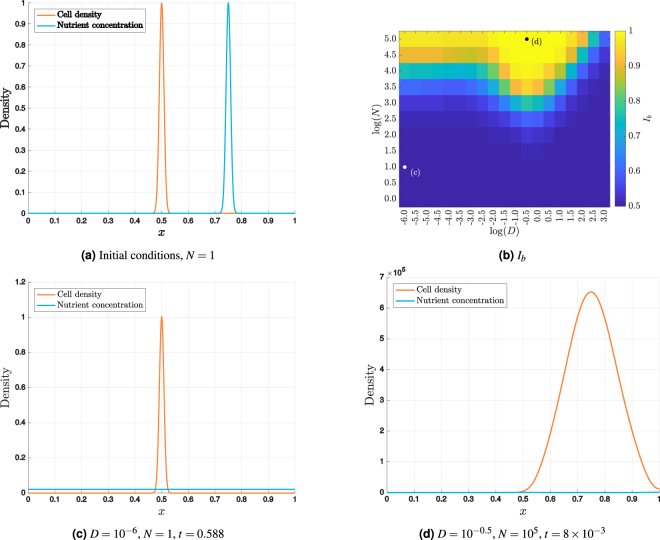
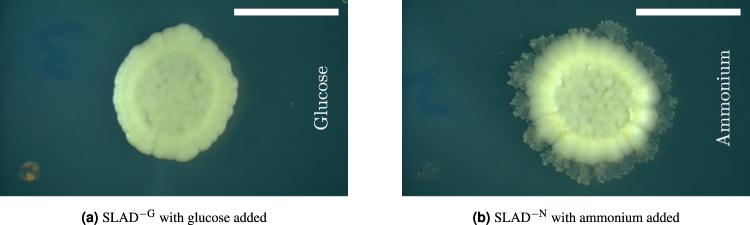
The emergence of diffusion-limited growth (DLG) within a microbial colony on a solid substrate is studied using a combination of mathematical modelling and experiments. Using an agent-based model of the interaction between microbial cells and a diffusing nutrient, it is shown that growth directed towards a nutrient source may be used as an indicator that DLG is influencing the colony morphology. A continuous reaction-diffusion model for microbial growth is employed to identify the parameter regime in which DLG is expected to arise. Comparisons between the model and experimental data are used to argue that the bacterium Bacillus subtilis can undergo DLG, while the yeast Saccharomyces cerevisiae cannot, and thus the non-uniform growth exhibited by this yeast must be caused by the pseudohyphal growth mode rather than limited nutrient availability. Experiments testing directly for DLG features in yeast colonies are used to confirm this hypothesis.


Conflict of interest statement

The authors declare no competing interests.

Figures

Figure 1
Figure 1
Experimental examples of microbial colonies. Shown are colonies of (a) B. subtilis, (b) B. subtilis, and (c) S. cerevisiae. The petri dishes shown (a and b) were 88 mm in diameter, while the scale bar (c) represents 2 mm. The growth at the edge of the S. cerevisiae colony closely resembles that of the B. subtilis colonies. Figure 1(a) is reprinted from Physica A: Statistical Mechanics and its Applications, 168, Mitsugu Matsushita and Hiroshi Fujikawa, Diffusion-limited growth in bacterial colony formation, 498–506, 1990, with permission from Elsevier. Figure 1(b) is reproduced with permission from The Physical Society of Japan (J. Phys. Soc. Jpn. 58, 3875–3878, 1989.)
Figure 2
Figure 2
Experimental results by Matsushita & Fujikawa (top row) with corresponding model simulations (bottom row). Shown are (a) larger branches screening smaller branches from nutrient (phenomenon I), (b) two colonies seeded close together appearing to repel each other (phenomenon II), and (c) a single colony growing towards the nutrient source on the right-hand side of the petri dish (phenomenon III). Simulations of (d) screening branches, (e) two colonies in close proximity and (f) growth with nutrient on the right-hand side are computed using the lattice-based model. The seed cells are marked by a red dot. The simulations were computed on lattices with dimensions Lx = Ly = 200 with parameters s = 3 and c0 = 1, which result in a value of Δ of the same order of magnitude as in the experiments. Figures 2(a), 2(b) and 2(c) are reprinted from Physica A: Statistical Mechanics and its Applications, 168, Mitsugu Matsushita and Hiroshi Fujikawa, Diffusion-limited growth in bacterial colony formation, 498–506, 1990, with permission from Elsevier.
Figure 3
Figure 3
Measures of DLG effects in simulated microbial colonies. All simulations are computed using the lattice-based model using a range of nutrient steps s and initial nutrient concentrations c0. Shown are (a) the mean index I¯θ for branch screening (phenomenon I), (b) the mean index I¯c for repelling colonies (phenomenon II), and (c) the mean index I¯b for directed growth (phenomenon III).
Figure 4
Figure 4
Results from the one-dimensional reaction–diffusion model. (a) The initial condition for N = 1 shows the cells concentrated in the centre of the domain with the nutrient to the right. (b) The maximum values of Ib up to time t = 1, plotted against the base 10 logarithm of D and N, suggest that DLG only occurs at particular parameter values. Two representative examples are shown marked. (c) At the the largest value of Ib when D = 10−6 and N = 1, the cells are still almost symmetrical about x = 0, while the nutrient concentration has become effectively uniform. (d) Using D = 10−0.5 and N = 105 results in a significant bias towards the right-hand side, where the nutrient was initially concentrated.
Figure 5
Figure 5
Images from the directed growth experiments using S. cerevisiae. The images are orientated so that the corresponding nutrient is on the right-hand side of the colony, as indicated by the vertical text. The colonies were grown on (a) SLAD−G with glucose added to the right and (b) SLAD−N with ammonium sulphate added to the right. The scale bars represent 5 mm.

References

    1. Fujikawa H, Matsushita M. Fractal growth of Bacillus subtilis on agar plates. Journal of the Physical Society of Japan. 1989;58:3875–3878. doi: 10.1143/JPSJ.58.3875. - DOI
    1. Gimeno CJ, Ljungdahl PO, Styles CA, Fink GR. Unipolar cell divisions in the yeast S. cerevisiae lead to filamentous growth: Regulation by starvation and RAS. Cell. 1992;68:1077–1090. doi: 10.1016/0092-8674(92)90079-R. - DOI - PubMed
    1. Cullen PJ, Sprague GF. The regulation of filamentous growth in yeast. Genetics. 2012;190:23–49. doi: 10.1534/genetics.111.127456. - DOI - PMC - PubMed
    1. Butcher, S. S., Charlson, R. J., Orians, G. H. & Wolfe, G. V. (eds) Global biogeochemical cycles. International Geophysics (Elsevier Science, 1992).
    1. Taylor, J. Microorganisms and Biotechnology. Bath advanced science (Nelson Thornes, 2001).

Publication types

LinkOut - more resources