. 2018 May;50(5):682-692.
doi: 10.1038/s41588-018-0086-z. Epub 2018 Apr 16.

Sequencing of prostate cancers identifies new cancer genes, routes of progression and drug targets

David C Wedge #  1   2   3 Gunes Gundem #  4   5 Thomas Mitchell #  4   6   7 Dan J Woodcock  8 Inigo Martincorena  4 Mohammed Ghori  4 Jorge Zamora  4 Adam Butler  4 Hayley Whitaker  9 Zsofia Kote-Jarai  10 Ludmil B Alexandrov  4 Peter Van Loo  4   11 Charlie E Massie  7   12 Stefan Dentro  8   4   11 Anne Y Warren  13 Clare Verrill  14   15 Dan M Berney  16 Nening Dennis  17 Sue Merson  10 Steve Hawkins  7 William Howat  13 Yong-Jie Lu  16 Adam Lambert  15 Jonathan Kay  9 Barbara Kremeyer  4 Katalin Karaszi  15 Hayley Luxton  9 Niedzica Camacho  5   10 Luke Marsden  15 Sandra Edwards  10 Lucy Matthews  15 Valeria Bo  18 Daniel Leongamornlert  4   10 Stuart McLaren  4 Anthony Ng  19 Yongwei Yu  20 Hongwei Zhang  20 Tokhir Dadaev  10 Sarah Thomas  17 Douglas F Easton  21 Mahbubl Ahmed  10 Elizabeth Bancroft  10   17 Cyril Fisher  17 Naomi Livni  17 David Nicol  17 Simon Tavaré  18 Pelvender Gill  15 Christopher Greenman  22 Vincent Khoo  17 Nicholas Van As  17 Pardeep Kumar  17 Christopher Ogden  17 Declan Cahill  17 Alan Thompson  17 Erik Mayer  17 Edward Rowe  17 Tim Dudderidge  17 Vincent Gnanapragasam  6   23 Nimish C Shah  6 Keiran Raine  4 David Jones  4 Andrew Menzies  4 Lucy Stebbings  4 Jon Teague  4 Steven Hazell  17 Cathy Corbishley  24 CAMCAP Study GroupJohann de Bono  10 Gerhardt Attard  10 William Isaacs  25 Tapio Visakorpi  26 Michael Fraser  27 Paul C Boutros  28   29   30 Robert G Bristow  27   29   31 Paul Workman  10 Chris Sander  32 TCGA ConsortiumFreddie C Hamdy  15 Andrew Futreal  4 Ultan McDermott  4 Bissan Al-Lazikani  10 Andrew G Lynch  18   33 G Steven Bova  25   26 Christopher S Foster  34   35 Daniel S Brewer  10   22   36 David E Neal  7   23 Colin S Cooper  10   22 Rosalind A Eeles  37   38
Affiliations

Sequencing of prostate cancers identifies new cancer genes, routes of progression and drug targets

David C Wedge et al. Nat Genet. 2018 May.

Abstract

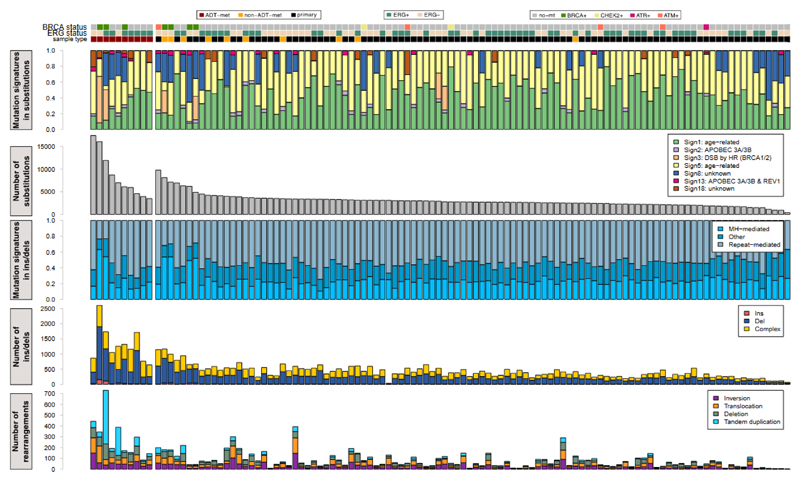
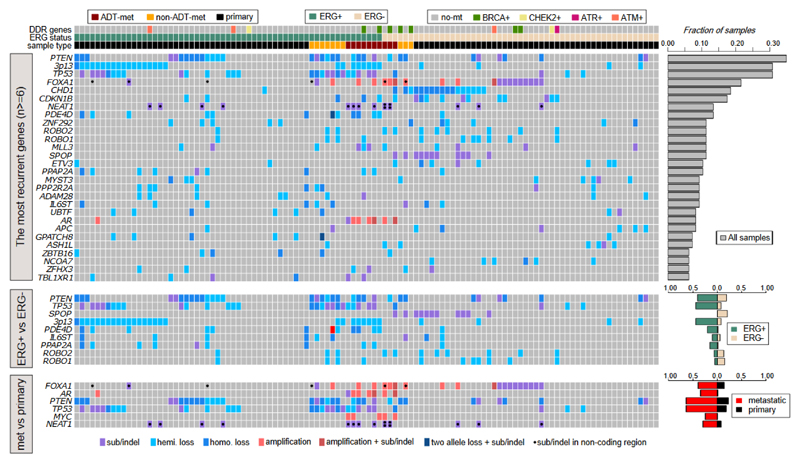
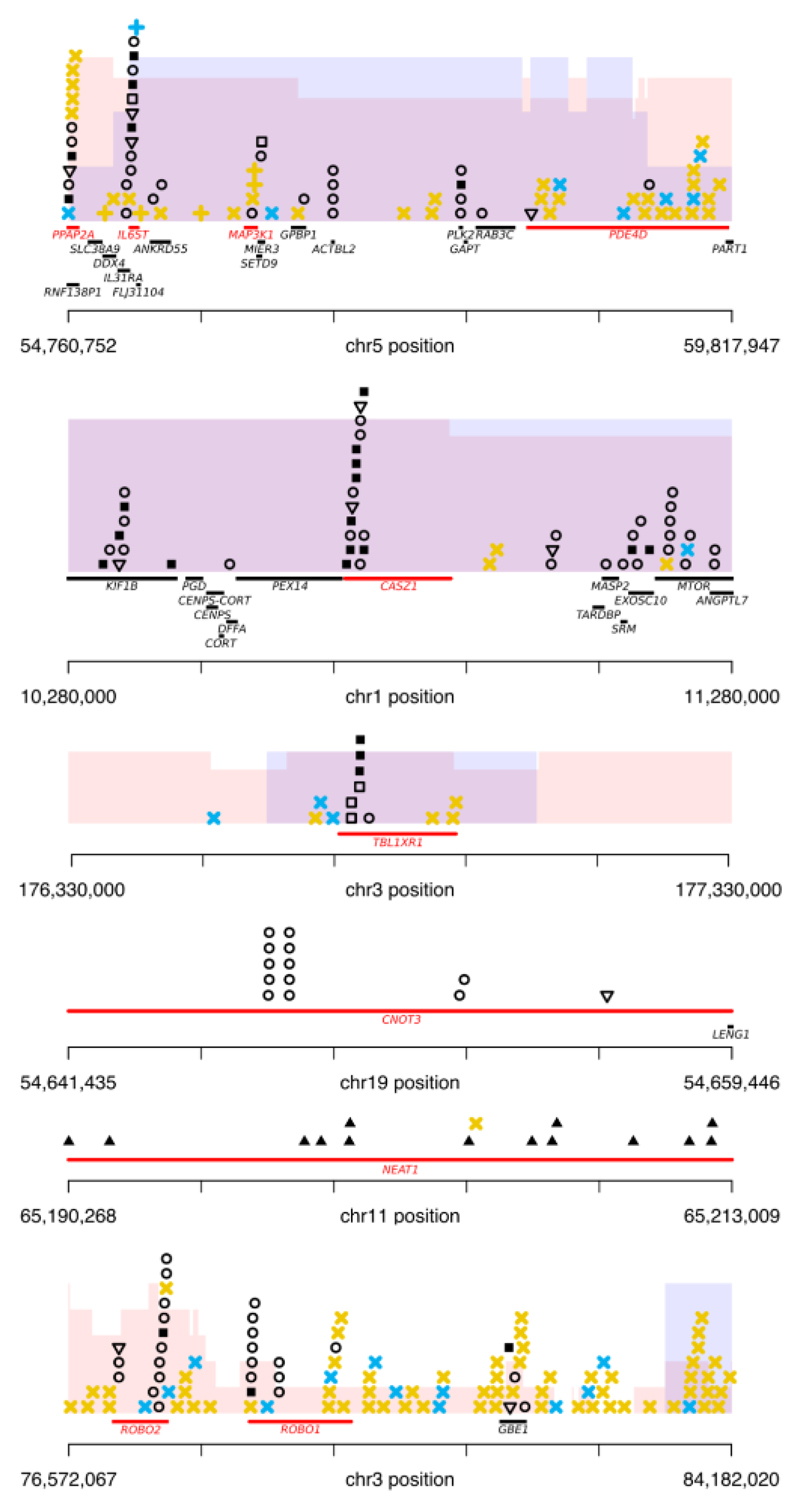
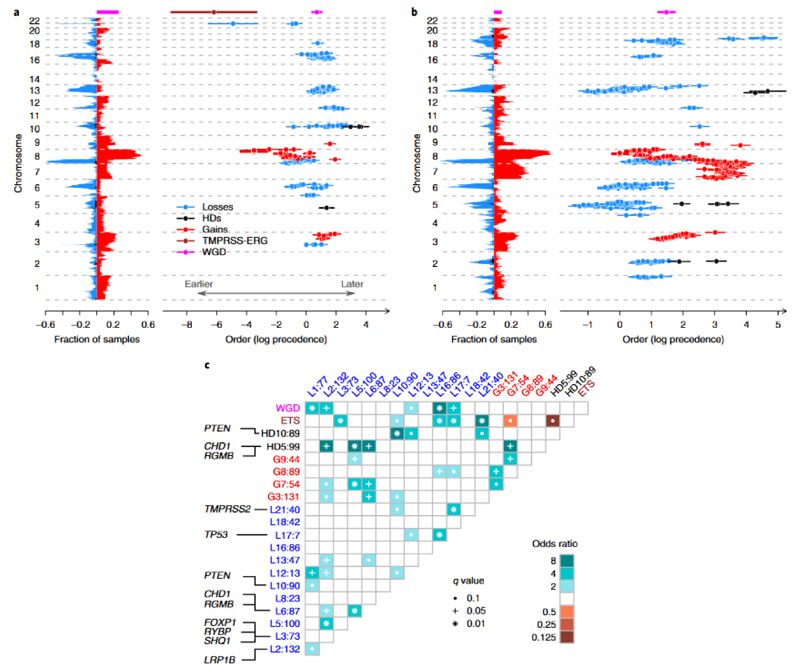
Prostate cancer represents a substantial clinical challenge because it is difficult to predict outcome and advanced disease is often fatal. We sequenced the whole genomes of 112 primary and metastatic prostate cancer samples. From joint analysis of these cancers with those from previous studies (930 cancers in total), we found evidence for 22 previously unidentified putative driver genes harboring coding mutations, as well as evidence for NEAT1 and FOXA1 acting as drivers through noncoding mutations. Through the temporal dissection of aberrations, we identified driver mutations specifically associated with steps in the progression of prostate cancer, establishing, for example, loss of CHD1 and BRCA2 as early events in cancer development of ETS fusion-negative cancers. Computational chemogenomic (canSAR) analysis of prostate cancer mutations identified 11 targets of approved drugs, 7 targets of investigational drugs, and 62 targets of compounds that may be active and should be considered candidates for future clinical trials.


Conflict of interest statement

Competing Financial Interests

There are no competing financial interests.

Figures

Figure 1
Figure 1. Mutational landscape of prostate cancers.
From top-to-bottom: mutation status of DNA repair genes, ETS fusion status and sample type; proportion of mutations assigned to each signature; number of SNVs identified in each sample; proportion of small insertions/deletions associated with microhomology or repetitive regions; number of insertions, deletions and complex insertions/deletions in each sample; total number of structural variants in each sample, separated into inversions, translocations, deletions and tandem duplications. Sample ordering is reported in Supplementary Table 7.
Figure 2
Figure 2. Landscape of driver genes in prostate cancer.
Genes were identified using three different methods: upper panel shows genes that have undergone genetic aberration in at least 6 samples (n=112 biologically independent samples); middle panel shows genes with aberrations enriched in either ERG+ or ERG- cancers (Fisher exact test for PTEN, TP53, SPOP, 3p13, PDE4D, PPAP2A; ROBO1 and ROBO2 are in a region enriched for SVs in ETS- tumors; IL6ST is in a region enriched for SVs in ETS+ tumors; n=59 ETS+, n=53 ETS biologically independent samples); lower panel shows genes enriched in metastatic samples (Fisher exact test, n=20 metastatic, n=98 primary biologically independent samples). Right-hand bar graphs show the fraction of samples bearing each type of aberration. DDR = DNA damage response, ‘hemi.loss’ = loss of heterozygosity resulting from copy number change, ‘homo.loss’ = homozygous deletion resulting from copy number aberration, ‘two allele loss + sub/indel’ indicates genes in triploid regions bearing aberrations of all 3 gene copies. Sample ordering is reported in Supplementary Table 7.
Figure 3
Figure 3. Putative novel driver genes.
Putative drivers are shown in red and genomic aberrations are displayed as: missense SNVs – circles; nonsense SNVs – open triangles; essential splice site mutations – open squares; indels – closed squares; non-coding mutations – closed triangles; simple SV - yellow cross; chromoplexy event – blue cross; region enriched for loss of heterozygosity, with height proportional to the number samples containing LOH - pink shading; region enriched for homozygous deletions, with height proportional to the number of samples containing homozygous deletion – blue shading.
Figure 4
Figure 4. Temporal evolution of copy number aberrations in ETS+ and ETS- prostate cancer.
For (a) ETS+ cancers (n=45 biologically independent primary cancer samples), and b) ETS- cancers (n=47 biologically independent primary cancer samples): Left: The landscape of copy number aberrations with genomic loci plotted against fraction of cancers. Loss-of-heterozygosity is depicted in blue, homozygous deletions in black, gains in red, TMPRSS2-ERG deletion in brown and whole genome duplication in green. Right: The temporal evolution of significantly recurrent (p < 0.05, permutation test with Benjamini-Hochberg procedure) copy number aberrations by genomic loci over time (mean with 95% confidence intervals, log precedence relative to arbitrary reference). Lower values indicate earlier events (c) Pairwise associations among copy number aberrations. Recurrently aberrant regions with a false discovery rate < 0.1 are shown. Associations are indicated by odds ratio (OR) with brown colors depicting mutually exclusive events and blue-green colors depicting correlated events. Genomic loci annotated by: type of aberration (G=gain, L=loss, HD=homozygous deletion); chromosome; median position in Mb. For focal events the putative target genes are annotated.
Figure 5
Figure 5. Heterogeneity and subclonal mutations.
(a) Metastatic tumors have less heterogeneity than primary tumors, whether assessed from SNVs or indels. Each dot represents a different sample, colored by sample type. x-axis = fraction of SNVs that are subclonal, y-axis = fraction of indels that are subclonal, contour lines calculated using R package kde2d. n= 93 biologically independent samples (10 ADT metastases, 9 hormone naïve metastases, 74 primary tumors) (b) Samples with multiple subclonal mutations in driver genes. Fraction of cancer cells carrying mutation is shown as grey histogram for all mutations and as red ovals for mutations in known driver genes. Mutations are clustered using a Dirichlet process as previously described, with thick plum-colored lines indicating fitted distribution and pale blue regions indicating 95% posterior confidence intervals. Peaks with a subclonal fraction close to 1 are clonal, whereas peaks at lower subclonal fractions indicate subclonal mutations.
Figure 6
Figure 6. Clinical outcome. Kaplan-Meier plots for biochemical recurrence.
Kaplan-Meier plots of recurrent mutated genes where there is a significant correlation with time to biochemical recurrence after prostatectomy, CDH12 (left, p=0.006) and ANTXR2 (right, p=0.012) (Cox regression model; Benjamini-Hochberg multiple testing correction). Clinical information was available for 89 prostatectomy samples with WGS data, with a median follow up of 1108 days in which biochemical recurrence occurred in 26 patients. The mutations in both genes consisted of a frameshift deletion in one sample and structural variants in the remaining samples.

References

    1. Attard G, et al. Prostate cancer. Lancet. 2016;387:70–82. - PubMed
    1. Weischenfeldt J, et al. Integrative genomic analyses reveal an androgen-driven somatic alteration landscape in early-onset prostate cancer. Cancer Cell. 2013;23:159–70. - PubMed
    1. Grasso CS, et al. The mutational landscape of lethal castration-resistant prostate cancer. Nature. 2012;487:239–43. - PMC - PubMed
    1. Cancer Genome Atlas Research, N. The Molecular Taxonomy of Primary Prostate Cancer. Cell. 2015;163:1011–25. - PMC - PubMed
    1. Barbieri CE, et al. Exome sequencing identifies recurrent SPOP, FOXA1 and MED12 mutations in prostate cancer. Nat Genet. 2012;44:685–9. - PMC - PubMed

Publication types