. 2018 May;19(5):497-507.
doi: 10.1038/s41590-018-0083-5. Epub 2018 Apr 16.

c-Maf controls immune responses by regulating disease-specific gene networks and repressing IL-2 in CD4+ T cells

Affiliations

c-Maf controls immune responses by regulating disease-specific gene networks and repressing IL-2 in CD4+ T cells

Leona Gabryšová et al. Nat Immunol. 2018 May.

Erratum in

Abstract

The transcription factor c-Maf induces the anti-inflammatory cytokine IL-10 in CD4+ T cells in vitro. However, the global effects of c-Maf on diverse immune responses in vivo are unknown. Here we found that c-Maf regulated IL-10 production in CD4+ T cells in disease models involving the TH1 subset of helper T cells (malaria), TH2 cells (allergy) and TH17 cells (autoimmunity) in vivo. Although mice with c-Maf deficiency targeted to T cells showed greater pathology in TH1 and TH2 responses, TH17 cell-mediated pathology was reduced in this context, with an accompanying decrease in TH17 cells and increase in Foxp3+ regulatory T cells. Bivariate genomic footprinting elucidated the c-Maf transcription-factor network, including enhanced activity of NFAT; this led to the identification and validation of c-Maf as a negative regulator of IL-2. The decreased expression of the gene encoding the transcription factor RORγt (Rorc) that resulted from c-Maf deficiency was dependent on IL-2, which explained the in vivo observations. Thus, c-Maf is a positive and negative regulator of the expression of cytokine-encoding genes, with context-specific effects that allow each immune response to occur in a controlled yet effective manner.


Conflict of interest statement

Competing financial interests

The authors declare no competing financial interests.

Figures
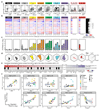
Figure 1
Figure 1. The transcription factor Maf correlates with Il10 expression in all TH and Treg cell subsets.
a, Representative cytokine staining of naive CD4+ T cells, in vitro differentiated TH0, TH0+block, TH1, TH1+IL-27, TH2, TH17, VitD3+Dex CD4+ T cell subsets (n=2 independent experiments each) and of Treg cells ex vivo (n=3 independent experiments). b, CD4+ T cells from (a) were profiled by RNA-seq. Heatmap showing the mean gene expression levels (12,742 genes) of naive CD4+ T cells (n=2 independent experiments, one of which with 3 culture wells), in vitro differentiated TH0 (n=2 independent experiments), TH0+block (n=2 independent experiments, 3 culture wells each), TH1 (n=2 independent experiments), TH1+IL-27 (n=2 independent experiments), TH2 (n=2 independent experiments), TH17 (n=2 independent experiments, 3 culture wells each), VitD3+Dex (n=2 independent experiments) after culture (0h) or following a 0.5, 2 and 6h re-stimulation in vitro and of Treg cells ex vivo, either Foxp3RFP+ IL-10GFP+ or IL-10GFP- (n=3 independent experiments each). c, d Expression of Il10 (mean±SD) (c) and of hallmark cytokines at 6h post restimulation (d, values represent log2 of the mean expression value per population) in the different CD4+ T cell populations from (b). e, Transcription factors positively and negatively correlating with the expression of Il10 across all the different CD4+ T cell populations from (b) (Pearson correlation, transcription factors previously associated with IL-10 highlighted in black). f, Linear regression of Il10 and hallmark cytokines vs Maf or TH subset master regulators (symbols represent the mean read counts per CD4+ T cell subset per timepoint from (b), shaded area 95% CI).
Figure 2
Figure 2. c-Maf deficiency in CD4+ T cells affects susceptibility to disease in a context-specific manner.
a-c, Schematics of P. chabaudi infection, HDM allergy and EAE disease models performed in Maffl/fl and Maffl/flCd4-cre mice. d, Weight loss, temperature and parasitemia during P. chabaudi infection (n=14, mean±SEM). e, Total cell and differential Giemsa-stained eosinophil counts from BAL upon HDM challenge (n=5, mean±SD), representative lung sections and cumulative total inflammation (H&E) and mucous (AB-PAS) scores (*, P < 0.05 Mann-Whitney, two-tailed). f, Weight loss and clinical score (including linear regression *, P ≤ 0.035 F-test) during EAE (n=10, mean±SEM), distribution of disease severity (no EAE = score < 2, mild EAE = score 2-3, severe EAE > score 4, n=28). Representative data from three biological experiments per disease model are shown.
Figure 3
Figure 3. Deciphering c-Maf driven transcriptional programmes within dominant disease-associated immune responses.
CD4+ T cells from malaria, HDM and EAE challenged Maffl/flCd4-cre and Maffl/fl mice were profiled by RNA-seq. a, Unsupervised hierarchical clustering heatmap showing the Spearman correlation of the mean gene expression levels between the different diseases and mice. b, Singular value decomposition (SVD) was used to identify major sources of gene expression variation between malaria, HDM and EAE challenged Maffl/flCd4-cre and Maffl/fl mice (n=3 independent animals (malaria) or biologically independent samples (HDM and EAE) per genotype); analyses of variance (ANOVA; shown as -log P-value of the chi-squared test) and the Akaike Information Criterion (AIC) were then used to test the association of each component with the disease and/or strain. c, Scatter plot showing the relative separation between malaria, HDM and EAE challenged Maffl/flCd4-cre and Maffl/fl mice (n=3 independent animals (malaria) or biologically independent samples (HDM and EAE) per genotype) along components 1, 2 and 4. d, (Upper left) Bar plots showing the average right singular vectors for components 1, 2 and 4 for each condition (n=3 independent animals (malaria) or biologically independent samples (HDM and EAE) per genotype, mean±SEM); (upper right) heatmaps displaying the expression levels of the most positively (dark grey box) and negatively (light grey box) contributing and correlating genes with the right singular vectors of the corresponding component; (lower) lists of top biological pathways and example genes by GO enrichment analysis of each component (n=3 independent animals (malaria) or biologically independent samples (HDM and EAE) per genotype).
Figure 4
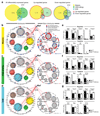
Figure 4. c-Maf regulates Il10 expression in CD4+ T cells in vivo with wider disease-specific effects.
a, Venn diagrams showing the overlap of differentially expressed, up- and down-regulated genes in CD4+ T cells from malaria, HDM allergy and EAE challenged Maffl/flCd4-cre vs Maffl/fl mice (n=3 independent animals (malaria) or biologically independent samples (HDM and EAE) per genotype; P < 0.05, absolute FC ≥ 1.5, moderated t-test, two-tailed). b-d, Networks of differentially expressed transcription factor, cytokine and trans-membrane receptor genes (blue, down-regulated; red, up-regulated; size of symbol, mean read number; red lines, known c-Maf interactions). e-g, Normalized read counts of selected TH cell master regulator transcription factors and hallmark cytokines in CD4+ T cells from malaria, HDM allergy and EAE challenged mice (n=3 independent animals (malaria) or biologically independent samples (HDM and EAE) per genotype, mean±SD; *, P < 0.05, absolute FC ≥ 1.5, moderated t-test, two-tailed; BT, below filtering threshold).
Figure 5
Figure 5. c-Maf deficiency results in the loss of IL-10 secreting effector TH1 and TH2 cells in malaria and HDM allergy disease models, whilst in EAE c-Maf plays a dominant role in controlling the TH17/Treg cell balance.
a, c, e, Representative cytokine staining of CD4+ T cells from malaria (speen), HDM allergy (lung) and EAE (spinal cord) challenged Maffl/flCd4-cre and Maffl/fl mice gated on live CD4+(CD4+CD44+, HDM) T cells. b, d, f, Representative box plots (box limits are at the 25-75 centiles, centre line reprents the median and whiskers represent the minimum and maxium values) of percentages (top row) and numbers (bottom row) of cytokine-secreting CD4+ T cells from malaria (n=5), HDM allergy (n=5) and EAE (n=10) disease models (*, P < 0.05, unpaired t-test, two-tailed) Representative data from three biological experiments are shown.
Figure 6
Figure 6. The context specificity of c-Maf on the immune response is driven by both direct and indirect mechanisms.
a, Heatmap showing the Spearman correlation between read coverages underlying ATAC-seq peaks called in CD4+ T cells from malaria, HDM and EAE challenged Maffl/flCd4-cre and Maffl/fl mice profiled by ATAC-seq (n=3 independent animals (malaria) or biologically independent samples (HDM and EAE) per genotype). b, Volcano plots of changes in ATAC-seq consensus peak sets between Maffl/flCd4-cre and Maffl/fl (statistical significance called using DiffBind 2.02 with FDR < 0.05, absolute fold change ≥ 1.5); top 10 peaks ranked by fold-change are labelled with the assigned target gene, as well as those peaks assigned to Il10. De novo motif discovery identified the Runx TF family motif as the top match in differentially accessible ATAC-seq peaks in the malaria model (MEME-ChIP, E-value 3.8e-92). c, Heatmaps for differentially expressed genes indicating the presence of ATAC-seq peaks with overlapping c-Maf ChIP-seq occupancy and/or c-Maf motif matches (called direct targets, black bracket), or neither (indirect targets, orange bracket). Putative direct and indirect targets are further corroborated using the BETA software with high scores representing greater likelihood of direct regulation. d, Genome browser tracks of read coverage of RNA-seq and ATAC-seq in CD4+ T cells from the different disease models (shown as an overlay of n=3 independent animals (malaria) or biologically independent samples (HDM and EAE) per genotype) as compared to untreated control and matched to c-Maf ChIP-seq and motif sites.
Figure 7
Figure 7. Identification and validation of IL-2 as a c-Maf target from inferred c-Maf regulated TF networks.
a, Bagplots depicting TFs with potential genome-wide changes in binding between CD4+ Maffl/fl and Maffl/flCd4-cre within ATAC-seq peaks in CD4+ T cells, as detected using the BaGFoot software. P-values in the key of the figure refer to the statistical confidence assigned to the differntial binding of a TF in each disease model (n=3 independent animals (malaria) or biologically independent samples (HDM and EAE) per genotype), see Supplementary Data). Labelled in bold are TFs whose motif is enriched in the accessible genomic neighbourhood of differentially expressed genes (one-tailed Fisher’s exact test q-value < 0.05). b, Metaprofiles of ATAC-seq footprints containing an Nfatc2 motif match, in CD4+ Maffl/fl and Maffl/flCd4-cre T cells from malaria (yellow/orange), HDM allergy (light/dark green) and EAE (light/dark blue). Coloured dashed lines represent the sum of Tn5 insertions across the footprint region in each condition. Vertical dashed lines represent the motif boundaries. c, Genome browser tracks of read coverage of RNA-seq and ATAC-seq in CD4+ T cells from the different disease models (shown as an overlay of n=3 independent animals (malaria) or biologically independent samples (HDM and EAE) per genotype) as compared to untreated control and matched to c-Maf ChIP-seq and motif sites. d, Naive CD4+ T cells from Maffl/fl and Maffl/flCd4-cre mice were differentiated in vitro and assessed for the expression of Il2, Rorc and Foxp3 relative to Hprt (mean±SD; * P < 0.05, ** P < 0.01, *** P < 0.001, **** P < 0.0001, unpaired t-test, two-tailed); TH17 cells were differentiated in vitro and assessed for the expression of Rorc in the presence or absence of anti-IL-2 (n=3 culture wells per condition, mean±SD; * P < 0.05, one-way ANOVA). Representative data from three (or two, Th2) independent experiments are shown.

Comment in

References

    1. Sher A, Coffman RL. Regulation of immunity to parasites by T cells and T cell-derived cytokines. Annu Rev Immunol. 1992;10:385–409. doi: 10.1146/annurev.iy.10.040192.002125. - DOI - PubMed
    1. Littman DR, Rudensky AY. Th17 and regulatory T cells in mediating and restraining inflammation. Cell. 2010;140:845–858. doi: 10.1016/j.cell.2010.02.021. S0092-8674(10)00174-1 [pii] - DOI - PubMed
    1. Zhu J, Yamane H, Paul WE. Differentiation of effector CD4 T cell populations (*) Annu Rev Immunol. 2010;28:445–489. doi: 10.1146/annurev-immunol-030409-101212. - DOI - PMC - PubMed
    1. Gabrysova L, Howes A, Saraiva M, O'Garra A. The regulation of IL-10 expression. Curr Top Microbiol Immunol. 2014;380:157–190. doi: 10.1007/978-3-662-43492-5_8. - DOI - PubMed
    1. Josefowicz SZ, Lu LF, Rudensky AY. Regulatory T cells: mechanisms of differentiation and function. Annu Rev Immunol. 2012;30:531–564. doi: 10.1146/annurev.immunol.25.022106.141623. - DOI - PMC - PubMed

Publication types

MeSH terms