. 2018 May;20(5):541-552.
doi: 10.1038/s41556-018-0082-7. Epub 2018 Apr 16.

Counter-rotational cell flows drive morphological and cell fate asymmetries in mammalian hair follicles

Affiliations

Counter-rotational cell flows drive morphological and cell fate asymmetries in mammalian hair follicles

Maureen Cetera et al. Nat Cell Biol. 2018 May.

Abstract

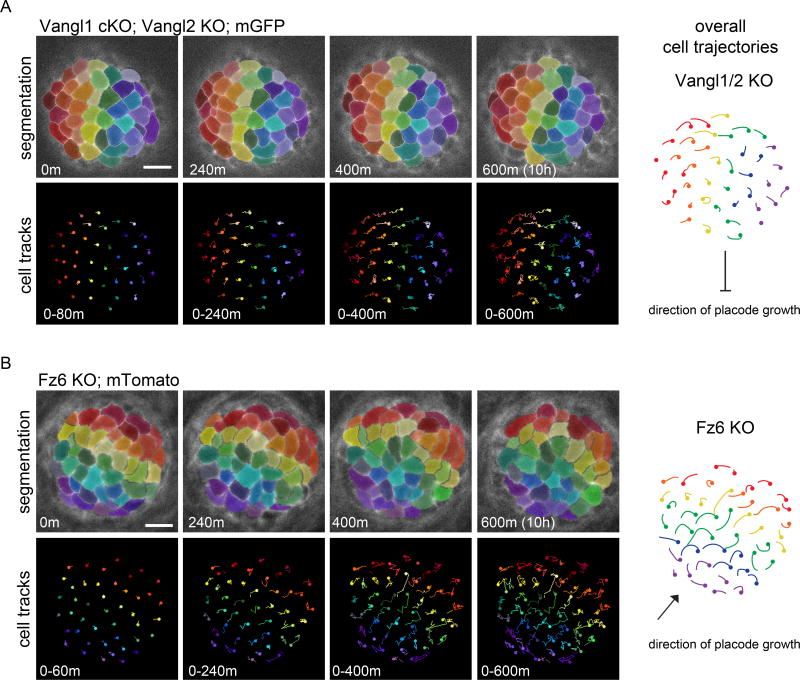
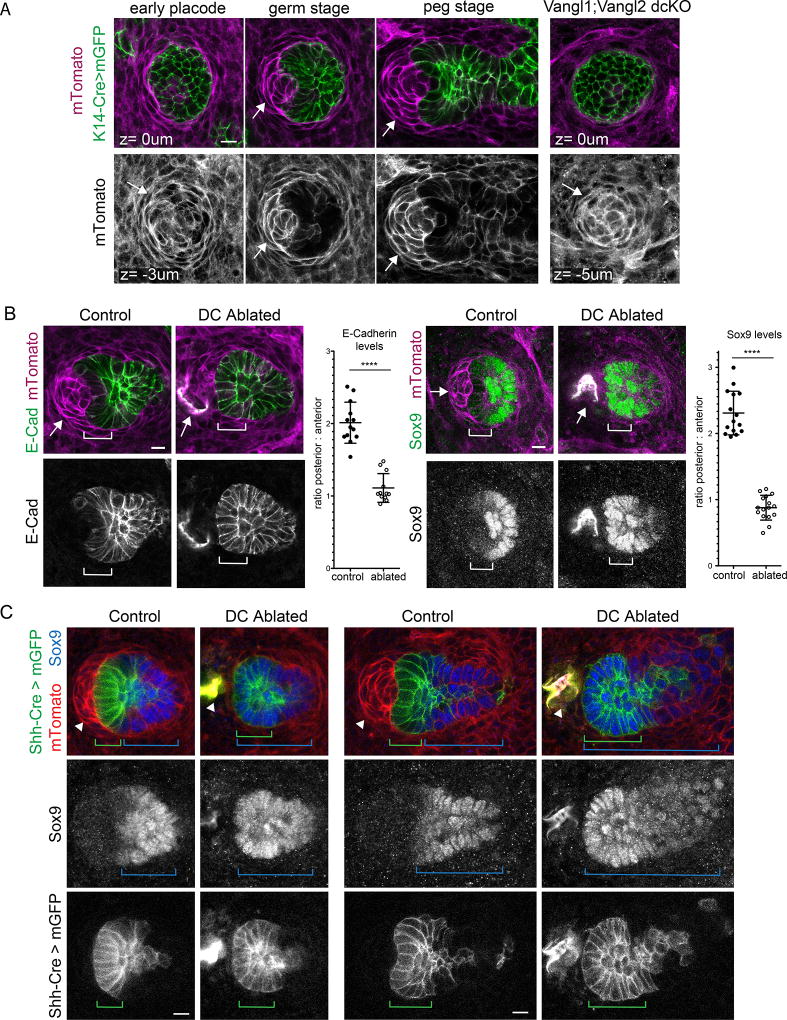
Organ morphogenesis is a complex process coordinated by cell specification, epithelial-mesenchymal interactions and tissue polarity. A striking example is the pattern of regularly spaced, globally aligned mammalian hair follicles, which emerges through epidermal-dermal signaling and planar polarized morphogenesis. Here, using live-imaging, we discover that developing hair follicles polarize through dramatic cell rearrangements organized in a counter-rotational pattern of cell flows. Upon hair placode induction, Shh signaling specifies a radial pattern of progenitor fates that, together with planar cell polarity, induce counter-rotational rearrangements through myosin and ROCK-dependent polarized neighbour exchanges. Importantly, these cell rearrangements also establish cell fate asymmetry by repositioning radial progenitors along the anterior-posterior axis. These movements concurrently displace associated mesenchymal cells, which then signal asymmetrically to maintain polarized cell fates. Our results demonstrate how spatial patterning and tissue polarity generate an unexpected collective cell behaviour that in turn, establishes both morphological and cell fate asymmetry.


Figures

Figure 1
Figure 1. Hair follicle placodes polarize through counter rotational cell flows
(A–B) Scanning confocal images of embryonic skin showing placodes at different stages of development. (A–C) All cells express membrane Tomato (magenta) and Shh-Cre expressing cells are converted to express mGFP to highlight cells within the placode (green). (A) E17.5 skin highlighting an early, unpolarized placode (circle), and polarized germ (square), and peg stage (rectangle). Representative image from four embryos. Scale bar, 100µm. (B) Representative images of an early placode and a polarized placode from three E15.5 embryos. Scale bar, 10µm. (C) Spinning disk confocal images from a time-series showing placode polarization in cultured explants. Representative placode from four embryos. mGFP cells are displaced anteriorly through time. The z plane changes 9µm through time in 3µm steps to follow the base of the placode into the dermis. Scale bar, 10µm. (D) Cell movements during placode polarization. See Supplemental Video 4. Spinning disk confocal images from a time series of placode cells expressing mGFP driven by K14-Cre (top). The z plane changes 3µm in one step to follow the base of the placode into the dermis. Cells were segmented and false colored in a rainbow pattern of vertical lines prior to polarization. Cell tracks show the movement of cells during the designated time window (bottom). Overall cell trajectories are shown in the schematic (right). Cells at the center of the placode move anteriorly, cells in the posterior converge toward the midline (blue and purple) and anterior cells move away from the midline and then posteriorly (red). Representative placode from five embryos. Additional examples of placode cell movements are shown in Supplemental Figure 1 and Supplemental Video 3. Scale bar, 10µm. Anterior is to the left.
Figure 2
Figure 2. Polarized shrinkage and growth of intercellular junctions directs cell rearrangements within the placode
(A–B) Lost junctions are shown in red while new junctions are shown in green. (A) Quantification of the angle and position of lost and new junctions during placode polarization. Lines representing the location and angle of individual remodeling events (n=213) from 3 placodes (including the placode shown in Figure 1D and Supplemental Video 4) over 19 hours were combined in a single image (top). Anterior events are shown in a lighter shade while posterior events are shown in a darker shade. The angular frequency of junctional modifications is plotted below where the AP axis is 0 degrees. (B) Examples of neighbor exchange quantified in A from two of three placodes. Anterior junctions are lost horizontally and form vertically (top). Posterior junctions are mainly lost vertically and form horizontally (center). Neighbor exchange causes outer cells (1,3) to slide past inner cells (2,4,5,6) at the lateral edge of the placode (bottom). (C) Celsr polarity within the interfollicular epithelium, early, and polarizing placodes. The orientation of the line shows the direction of Celsr polarity. 0–44 degrees is shown in cyan and 45–90 degrees is shown in yellow. Representative of 15 measured images from four embryos. Additional examples are shown in Supplemental Figure 2. Scale bar, 10µm. Anterior is to the left.
Figure 3
Figure 3. Counter-rotational cell movements require planar cell polarity
(A–B) Vangl1 cKO; Vangl2 KO cells do not rearrange while Fz6 KO cells undergo counter-rotational cell movements in the direction of placode growth rather than the AP axis. See Supplemental Videos 5 and 6. Representative placodes from two and three embryos, respectively. Spinning disk confocal images from a time series of placode cells expressing mGFP driven by K14-Cre (A) or mTomato (B). Cells were segmented and false colored in a rainbow pattern of vertical lines perpendicular to the AP axis (A) or to the direction of growth (B) at the start of the movie. Cell tracks show the movement of cells during the designated time window (bottom). Overall cell trajectories are shown in the schematic (right). An additional example of a polarizing Fz6 KO placode is shown in Supplemental Figure 3. Scale bar, 10µm. Anterior is to the left.
Figure 4
Figure 4. Placode polarization and counter rotational movements require Rho kinase and myosin II activity downstream of PCP
(A–D) Skin explants from E15.5 embryos were cultured for 24 hours in the presence of Y-27632 (ROCK inhibitor) or blebbistatin. (A) Representative images of 3rd wave placodes quantified in B. All cells express mTomato (magenta) and Shh-Cre expressing cells express mGFP (green). Additional examples are shown in Supplemental Figure 6. (B) Quantification of 3rd wave placode polarity. Control, n=348 follicles from 7 embryos: blebbistatin, n=337 follicles from 7 embryos (p=4.26×10, two-sided unpaired t-test); Control, n = 174 follicles from 4 embryos; Y27632, n=172 follicles from 4 embryos (p=0.002, two-sided unpaired t-test). (C) Representative immunofluorescence images of Celsr1 polarization within the IFE quantified in D. (D) Quantification of the angular distribution of Celsr1 in the IFE. Mp = magnitude of average Celsr1 polarity (see methods). Control, n=3623 cells from 3 embryos (gray, p=0) and blebbistatin, n=4923 cells from 3 embryos (red, p=0). Control, n=1512 cells from 3 embryos (gray, p=0) and Y27632, n=1828 cells from 3 embryos (red, p=0). (E) Counter-rotational cell flows are inhibited in the presence of Y27632. Representative placode from five treated explants. Spinning disk confocal images from a time series of placode cells expressing mTomato (top). Cells were segmented and false colored in a rainbow pattern of vertical lines at the beginning of the movie. Cell tracks show the movement of cells during the designated time window (bottom). Overall cell trajectories are shown in the schematic (right). Cells remain in their original pattern after 9.7h of imaging. See Supplemental Video 7. An additional example is shown in Supplemental Figure 4E. Scale bar, 10µm. Anterior is to the left.
Figure 5
Figure 5. Planar cell fate asymmetry arises from directional cell rearrangements
(A) Representative immunofluorescence images of early placodes showing radial symmetry with inner tip cells expressing P-Cadherin and ShhGFP (green) and outer SC progenitors expressing Sox9 (magenta) from one of two embryos (top) and one of four embryos (bottom). (B) Representative image of Sox9 (magenta) expression in control and Shh KO placodes from one of two embryos (het) and one of three embryos (KO). All cells express mTomato (blue). Additional examples of Shh KO placode morphology are shown in Supplemental Figure 5A–C. (C) Shh mutant placode cells undergo atypical cell rearrangements. Representative placode from one of two embryos. Spinning disk confocal images from a time series of placode cells expressing mGFP (top). Overall cell trajectories are shown in the schematic (right). Cells were segmented and false colored in a rainbow pattern of vertical lines perpendicular to the AP axis at t=0. Cell tracks show the movement of cells during the designated time window (bottom). See Supplemental Video 8. Additional example shown in Supplemental Figure 5D. (D) Representative immunofluorescence images of early, mid, and late/germ wild-type placodes (left) stained for Hoechst (blue) and asymmetry markers Sox9 (magenta), P-Cadherin (green) quantified in E. Placodes are initially radially symmetric before becoming planar polarized. Asymmetry markers in Vangl1;Vangl2 dcKO and Fz6 KO placodes fail to polarize or polarize in random orientations (right) quantified in E. (E) Quantification of Sox9 asymmetry in early (n=7), mid (n=11), and late/germ (n=9) wild-type placodes (p=0.048 early vs. mid; p=0.0002 early vs. late; unpaired t-test, from four embryos), and Vangl2 KO (p=7.22×10⁻⁵ vs. late, n=7 placodes from three embryos) and Fz6 KO (p=n.s. vs. late, n=9 placodes from three embryos) germ placodes represented as the posterior/anterior ratio of Sox9 immunofluorescence intensity (mean+SD). Randomly oriented, polarized Fz6 KO placodes were chosen for analysis. Fz6 KO hair germ orientation was determined based on morphology. Scale bar, 10µm. Anterior is to the left.
Figure 6
Figure 6. Asymmetric positioning of the dermal condensate maintains cell fate asymmetry
(A) Dermal condensate position (marked with arrow) before and after placode polarization. K14-Cre was used to drive mGFP expression in the follicular epidermis (green). All dermal cells, including the dermal condensate, express mTomato (magenta). The DC is positioned directly beneath the prepolarized placode but becomes displaced anteriorly as the follicle polarizes. An example of this process is shown in Supplemental Video 9. In the absence of placode polarization (Vangl1;Vangl2 dcKO) the DC remains directly below the base of the follicle (right). Representative images from three control and three mutant embryos. (B,C) Follicle asymmetry markers after laser ablation of the DC. (B) mTomato labels dermal cells (magenta) while posterior fate markers E-cadherin and Sox-9 are shown in green. Representative images from four embryonic explants. Quantification of the ratio of posterior to anterior E-cadherin (n=13 unablated and 12 ablated HFs), and Sox-9 (n=15 unablated and n=16 ablated HFs) levels showing that posterior cell fates expand anteriorly after DC ablation (mean+SD, p=4.12×10⁻⁹ for E-cad and p=3.48×10⁻¹⁵ for Sox9, two-tailed unpaired t-test). Bracket indicates anterior cells. (C) Hair follicle asymmetry after laser ablation of the DC at the germ (left) and peg stage (right). All mGFP cells are derived from ShhCre expressing progenitors (green). All cells express mTomato (red). Sox9 expressing cells mark posterior follicle fates (blue). Control hair follicles maintain AP separation of mGFP and Sox9 (green and blue brackets) while mGFP cells are converted to Sox9 expressing cells after DC ablation. Representative images from six control and six DC ablated follicles from two explants. Arrow labels DC. Scale bar, 10µm. Anterior is to the left.

Comment in

References

    1. Biggs LC, Mikkola ML. Early inductive events in ectodermal appendage morphogenesis. Seminars in cell & developmental biology. 2014;25–26:11–21. doi: 10.1016/j.semcdb.2014.01.007. - DOI - PubMed
    1. Ochoa-Espinosa A, Affolter M. Branching morphogenesis: from cells to organs and back. Cold Spring Harb Perspect Biol. 2012;4 doi: 10.1101/cshperspect.a008243. - DOI - PMC - PubMed
    1. St Johnston D, Ahringer J. Cell polarity in eggs and epithelia: parallels and diversity. Cell. 2010;141:757–774. doi: 10.1016/j.cell.2010.05.011. - DOI - PubMed
    1. Campanale JP, Sun TY, Montell DJ. Development and dynamics of cell polarity at a glance. J Cell Sci. 2017;130:1201–1207. doi: 10.1242/jcs.188599. - DOI - PMC - PubMed
    1. Devenport D. Tissue morphodynamics: Translating planar polarity cues into polarized cell behaviors. Seminars in cell & developmental biology. 2016;55:99–110. doi: 10.1016/j.semcdb.2016.03.012. - DOI - PMC - PubMed

Publication types

MeSH terms