. 2018 May;24(5):658-666.
doi: 10.1038/s41591-018-0002-1. Epub 2018 Apr 16.

Stimulation of entorhinal cortex-dentate gyrus circuitry is antidepressive

Affiliations

Stimulation of entorhinal cortex-dentate gyrus circuitry is antidepressive

Sanghee Yun et al. Nat Med. 2018 May.

Erratum in

Abstract

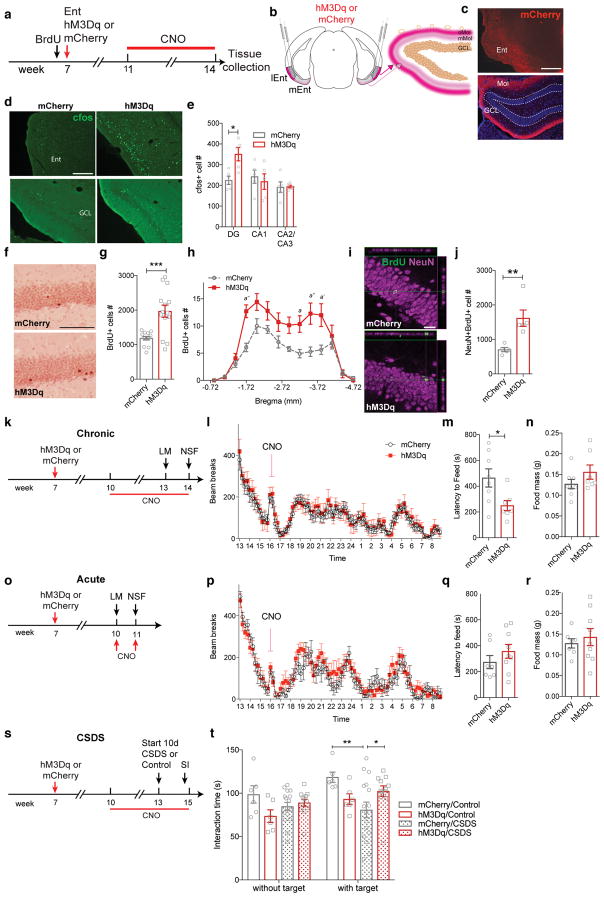
Major depressive disorder (MDD) is considered a 'circuitopathy', and brain stimulation therapies hold promise for ameliorating MDD symptoms, including hippocampal dysfunction. It is unknown whether stimulation of upstream hippocampal circuitry, such as the entorhinal cortex (Ent), is antidepressive, although Ent stimulation improves learning and memory in mice and humans. Here we show that molecular targeting (Ent-specific knockdown of a psychosocial stress-induced protein) and chemogenetic stimulation of Ent neurons induce antidepressive-like effects in mice. Mechanistically, we show that Ent-stimulation-induced antidepressive-like behavior relies on the generation of new hippocampal neurons. Thus, controlled stimulation of Ent hippocampal afferents is antidepressive via increased hippocampal neurogenesis. These findings emphasize the power and potential of Ent glutamatergic afferent stimulation-previously well-known for its ability to influence learning and memory-for MDD treatment.


Conflict of interest statement

Competing Financial Interests

The authors declare no competing financial interests.

Figures

Figure 1
Figure 1. Chronic social defeat stress (CSDS) increases levels of TRIP8b isoform IsoA4 in the dentate gyrus (DG)
(a) CSDS and social interaction (SI) timeline. (b) Western blot of DG TRIP8b and major hippocampal TRIP8b isoforms, IsoA4 and IsoA5, in control and stressed mice. Uncropped image of blots provided in Supplementary Fig. 3a–e. (c–e) Relative to control and normalized to GAPDH, IsoA4 level is greater after stress (c, unpaired t-test, *p<0.05), with no change in IsoA5 (d) or TRIP8b (e) levels (unpaired t-test, p’s>0.05). n=9 control, 22 stressed mice. Mean±SEM shown with data points from individual animals overlaid (c–e). See Supplementary Table 1 for detailed statistical information.
Figure 2
Figure 2. Entorhinal cortical (Ent) TRIP8b knockdown (KD) increases intrinsic excitability of Ent stellate cells and enhances DG neurogenesis
(a) TRIP8b shRNA KD construct packaged into adeno-associated virus (AAV). (b, c) Qualitative (b) and quantitative (c) in vitro efficacy of TRIP8b KD via Western blot (SCR shRNA n=4, TRIP8b shRNA n=4; unpaired t-test, **p<0.01). Uncropped image of blots provided in Supplementary Figure 4a–b. (d, e) Photomicrographs of Ent after immunohistochemistry for TRIP8b (red) and EGFP (green) supporting in vivo efficiency of Ent TRIP8b KD. No green Ent cell bodies were red (d, e), consistent with expression of green terminals and diminished red terminals in DG molecular layer (Mol; see m). Dashed-line box in (d) magnified in (e). Scale bar (d)=200 μm, (e)=40 um. (f) Timeline of electrophysiology whole-cell patch experiments. (g, h) Qualitative and quantitative ex vivo assessment of Ent stellate cells transfected in vivo shows TRIP8b shRNA EGFP+ cells (n=5 cells/3 animals) have more spikes vs. SCR shRNA EGFP+ cells (n=4 cells/4 animals) or non-transfected stellate cells (TRIP8b shRNA EGFP-, n=14 cells/4 animals; SCR shRNA EGFP-, n=13 cells/5 animals; two-way repeated measures [RM] ANOVA, main effects of input [F8, 256 = 188.0, p<0.0001], treatment [F3, 32= 4.143, p<0.05], subject [matching; F32, 256= 13.87, p<0.0001] and input X treatment interaction [F24, 256= 2.326, p<0.001], TRIP8b shRNA EGFP+ vs. TRIP8b shRNA EGFP-: posthoc a p<0.05, a′ p<0.01; TRIP8b shRNA EGFP+ vs. SCR shRNA EGFP-: b p<0.05, b′ p<0.01; TRIP8b shRNA EGFP+ vs. SCR shRNA EGFP+: c p<0.05, c′ p<0.01, c″ p<0.001). Calibration (g)=200 ms, 20 mv. (i) Timeline of in vivo EEG. (j) Qualitative and quantitative (Supplementary Fig. 4d–e) assessment of hippocampal (Hip) and cortical (Ctx) EEG in awake and behaving mice showed normal brain activity and no epileptiform activity in SCR or Trip8b shRNA transfected mice, as seen in positive-control mice which received pilocarpine ~1 mon prior. Calibration (j)=10 sec, 0.5 mV. (k–m) Timeline of neurogenesis studies (k), and schematic (l) and photomicrograph (m) of viral stereotaxic infusion into the lateral and medial Ent (lEnt, mEnt) and subsequent EGFP expression in perforant path (PP) terminals in outer (o) and middle (m) DG Mol. Dotted lines in (m) delineate DG granule cell layer (GCL). Scale bar (m)=200 μm. (n–s) Qualitative (n,p,r) and quantitative (o,q,s) assessment of DCX+ cells (n–o), BrdU+ surviving cells (p–q), and BrdU+NeuN+ neurons (r–s) shows AAV-TRIP8b shRNA Ent infusion led to more DCX+ cells (n=6 SCR shRNA mice, 5 TRIP8b shRNA mice), surviving BrdU+ cells ((p) arrowheads, n=8 SCR shRNA mice, 7 TRIP8b shRNA mice), and BrdU+NeuN+ neurons ((r) arrowheads, n=8 SCR shRNA mice, 7 TRIP8b shRNA mice) vs. AAV-SCR shRNA (unpaired t-test, *p<0.05). Dotted lines in (p) delineate DG GCL. Scale bars (n, p)=200 μm, (r)=20 μm. (t) Dendritic tree reconstruction of DCX+ DG neurons in SCR shRNA vs. TRIP8b shRNA mice. Scale bar (t)=10 um. (u–w) TRIP8b shRNA mice had longer DCX+ dendrites (u), and more nodes (v) and ends (w) vs. control mice (unpaired t-test, **p<0.01, (u–w) n=76 neurons in SCR shRNA mice, 95 neurons in TRIP8b shRNA mice, 4–5 mice/group). Mean±SEM shown (c, h, o, q, s, u–w) with data points from individual animals (o, q, s) or cells (c, u–w) overlaid. See Supplementary Table 1 for detailed statistical information.
Figure 3
Figure 3. Ent TRIP8b KD-induced promotion of antidepressive behavior is neurogenesis-dependent
(a) Timeline of viral infusion and behavioral testing. Four weeks post-bilateral Ent AAV-infusion, mice were tested for locomotion (LM), and then for forced swim test (FST) or contextual fear conditioning (CFC). (b–e) AAV-TRIP8b shRNA Ent infusion did not change LM (b, unpaired t-test, p>0.05, n=16 SCR shRNA mice, 17 TRIP8b shRNA mice), but decreased FST immobile time (c, unpaired t-test, *p<0.05, n=8 SCR shRNA mice, 10 TRIP8b shRNA mice) and increased CFC context freezing time (d, unpaired t-test, **p<0.01, n=8 SCR shRNA mice, 7 TRIP8b shRNA mice) without altering cue freezing time (e, two-way RM ANOVA, main effect of tone [F1,13=55.16, p<0.0001], treatment [F1,13=1.117, p>0.05], subjects [matching; F13,13=0.5089, p>0.05], tone X treatment interaction [F1,13=0.004857, p>0.05]). (f–j) Timeline (f) and efficacy (g–h) of neurogenesis ablation study. One week post-bilateral Ent AAV-infusion, mice received sham (SHAM) or image-guided DG-targeted irradiation (IRR) to ablate neurogenesis. Six weeks later, when DCX+ cells were still depleted (g–h), groups did not differ in LM activity (i, one-way ANOVA, F2,24=0.4149, p>0.05, n=10 SCR shRNA/SHAM, 8 TRIP8b shRNA/SHAM, 9 TRIP8b shRNA/IRR). AAV-TRIP8b shRNA Ent infusion decreased FST immobile time in SHAM mice, but not in IRR mice (j, one-way ANOVA, F2,25=7.07, posthoc *p<0.05, **p<0.01, n=10 SCR shRNA/SHAM, 8 TRIP8b shRNA/SHAM, 10 TRIP8b shRNA/IRR). Scale bar (h)=200 μm applies (g–h). Mean±SEM shown with data points from individual animals overlaid (b–e, i–j). See Supplementary Table 1 and the Life Sciences Reporting Summary for detailed statistical information.
Figure 4
Figure 4. Ent TRIP8b knockdown (KD) promotes antidepressive-like behaviors under conditions that mimic chronic stress
(a) Timeline of viral infusion and behavioral testing. (b–d) CORT did not change LM (b, one-way ANOVA, F2,48=0.01135, p>0.05, n=16 SCR shRNA/VEH, 16 SCR shRNA/CORT, 19 TRIP8b shRNA/CORT) or DL (c, time spent in light, one-way ANOVA, F2,48=0.3328, p>0.05, n=16 SCR shRNA/VEH, 16 SCR shRNA/CORT, 19 TRIP8b shRNA/CORT; d, latency to enter light, one-way ANOVA, F2,48=0.249, p>0.05, n=16 SCR shRNA/VEH, 16 SCR shRNA/CORT, 19 TRIP8b shRNA/CORT) in either Ent SCR shRNA or TRIP8b shRNA-infused mice relative to SCR VEH control mice. (e–f) Ent-infused TRIP8b shRNA mice that received CORT had shorter latency to feed in NSF vs. SCR shRNA that received CORT (e, one-way ANOVA, F2,24=2.934, p=0.0725, n=8 SCR shRNA/VEH, 8 SCR shRNA/CORT, 11 TRIP8b shRNA/CORT, posthoc *p<0.05). Food consumption in home cage in both SCR shRNA- and TRIP8b shRNA-infused CORT mice was significantly less than SCR VEH mice (f, Food mass after NSF, one-way ANOVA, F2,24=4.569, p<0.05, posthoc *p<0.05, **p<0.01, n=8 SCR shRNA/VEH, 8 SCR shRNA/CORT, 11 TRIP8b shRNA/CORT). (g) Ent-infused SCR shRNA CORT mice had more time immobile in FST vs. SCR shRNA VEH mice, as well as vs. TRIP8b shRNA CORT mice (g, FST, one-way ANOVA, F2,48=4.03, p<0.05, posthoc *p<0.05, n=16 SCR shRNA/SHAM, 16 SCR shRNA/CORT, 19 TRIP8b shRNA/CORT). Mean±SEM shown with data points from individual animals overlaid (b–g). See Supplementary Table 1 and the Life Sciences Reporting Summary for detailed statistical information.
Figure 5
Figure 5. Chemogenetic stimulation of Ent-DG circuit drives activity-dependent processes in the DG and antidepressive-like behavior
(a) Timeline of DREADD neurogenesis studies. CamKIIa-iCre mice received BrdU prior to stereotaxic Ent infusion (AAV-hSyn-DIO-mCherry [mCherry, control] or AAV-hSyn-DIO-hM3Dq-mCherry [hM3Dq, CNO-dependent stimulation]). Four weeks later, and at a time point when mCherry-transfected Ent glutamatergic neurons were evident in the DG Mol (b–c), daily i.p. CNO led to more cfos+ cells in Ent (d top row, e) and DG (d bottow row, e) but not in other hippocampal regions (e) in hM3Dq vs. control mice (d, e). Scale bars (c, d)=200 μm (e: two-way ANOVA, effects of subregion [F2,24=6.065, p<0.01], treatment [F1,24=2.442, p>0.05], and Bregma X treatment interaction [F2,24=4.221,p<0.05], treatment posthoc: *p<0.05; n=5, mCherry, 5 hM3Dq). (f–j) hM3Dq mice had more DG BrdU+ cells (f–h) and BrdU+NeuN+ neurons (i–j) vs. controls. Scale bars (f)=200 μm, (i)=20 μm. (g, j: unpaired t-tests, **p<0.01, ***p<0.001; h: two-way ANOVA, effects of Bregma [F13,364=27.90, p<0.0001], treatment [F1,364=51.07,p<0.0001], and Bregma X treatment interaction [F13,364= 2.901, p<0.001], treatment posthoc: a p<0.05, a′ p<0.01, a″ p<0.001; g, h: n=14 mCherry, 14 hM3Dq, j: n=5 mCherry, 5 hM3Dq). (k) Timeline of chronic DREADD behavior studies. (l) Ent-infused hM3Dq mice had similar LM activity vs. controls before and after daily CNO injection (two-way RM ANOVA, effects of time [F79,1580=10.75, p<0.0001], treatment [F1,20=0.7316, p>0.05], subjects [matching; F20,1580=3.971, p<0.0001] and time X treatment interaction [F79,1580= 0.2065, p>0.9999]). (m, n) Ent-infused hM3Dq mice had shorter latency to feed in NSF but similar home cage food consumption vs. controls (unpaired t-test, *p<0.05, n=8 mCherry, 7 hM3Dq), which was not seen with acute DREADD stimulation (o–r) ((p) two-way RM ANOVA, effects of time [F79,1106=14.82, p<0.0001], treatment [F1,14=0.7466, p>0.05], subjects [matching; F14,1106=9.23, p<0.0001] and time X treatment interaction [F79,1106= 0.7006, p>0.05], (q–r) unpaired t-test, p>0.05, n= 7 mCherry, 9 hM3Dq). (s–t) 10 days of CSDS decreased the time of SI in mCherry vs SHAM/mCherry group. Chronic DREADD stimulation of the Ent/PP of mice that received CSDS (s) increased the time in hM3Dq vs. control mice spent in the interaction zone (t). Two-way RM ANOVA, effects of target [F1,36=7.494, p<0.01], virus [F3,36=3.155, p<0.05], and target X virus interaction [F3,36=2.132, p>0.05], Subjects [matching; F36,36=2.242, p<0.01], virus posthoc: *p<0.05, **p<0.01; n=6 mCherry/Control, 6 hM3Dq/Control,16 mCherry/CSDS, 12 hM3Dq/CSDS. Mean±SEM shown (e, g–h, j, l–n, p–r, t) with data points from individual animals overlaid (e, g, j, m–n, q–r, t). See Supplementary Table 1 and the Life Sciences Reporting Summary for detailed statistical information.

References

    1. Kupfer DJ, Frank E, Phillips ML. Major depressive disorder: new clinical, neurobiological, and treatment perspectives. Lancet. 2012;379:1045–1055. - PMC - PubMed
    1. Trivedi MH. Modeling predictors, moderators and mediators of treatment outcome and resistance in depression. Biol Psychiatry. 2013;74:2–4. - PubMed
    1. Rosa MA, Lisanby SH. Somatic treatments for mood disorders. Neuropsychopharmacology. 2012;37:102–116. - PMC - PubMed
    1. Kronmüller KT, et al. Hippocampal volume and 2-year outcome in depression. Br J Psychiatry. 2008;192:472–473. - PubMed
    1. Yun S, Reynolds RP, Masiulis I, Eisch AJ. Re-evaluating the link between neuropsychiatric disorders and dysregulated adult neurogenesis. Nat Med. 2016 doi: 10.1038/nm.4218. - DOI - PMC - PubMed

Publication types

MeSH terms