. 2018 Mar 12:12:89.
doi: 10.3389/fnhum.2018.00089. eCollection 2018.

Distinctive Correspondence Between Separable Visual Attention Functions and Intrinsic Brain Networks

Affiliations

Distinctive Correspondence Between Separable Visual Attention Functions and Intrinsic Brain Networks

Adriana L Ruiz-Rizzo et al. Front Hum Neurosci. .

Abstract

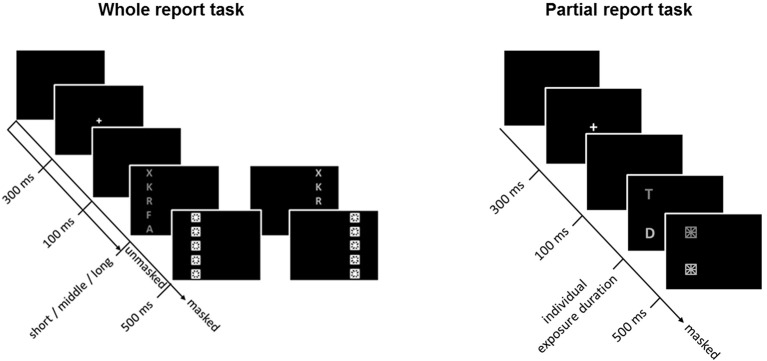
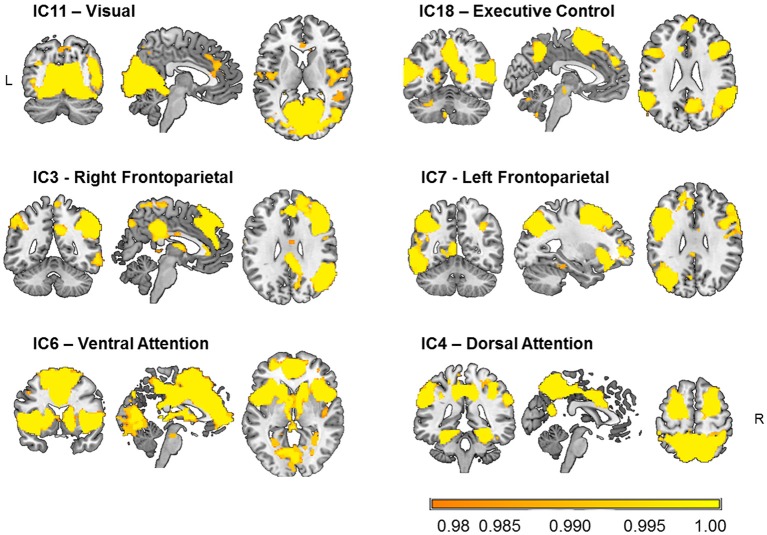
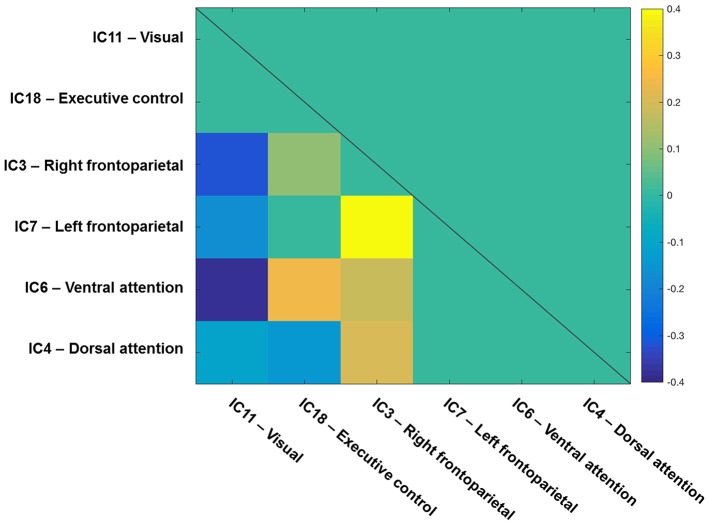
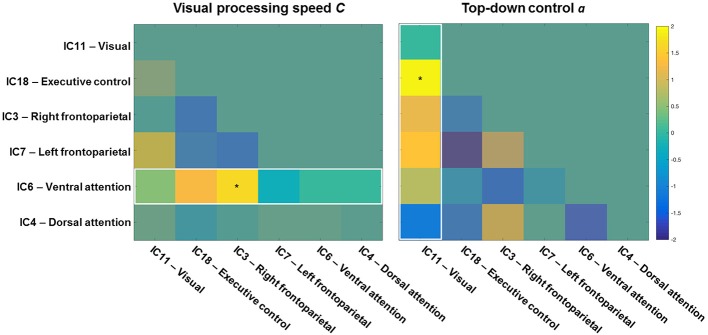
Separable visual attention functions are assumed to rely on distinct but interacting neural mechanisms. Bundesen's "theory of visual attention" (TVA) allows the mathematical estimation of independent parameters that characterize individuals' visual attentional capacity (i.e., visual processing speed and visual short-term memory storage capacity) and selectivity functions (i.e., top-down control and spatial laterality). However, it is unclear whether these parameters distinctively map onto different brain networks obtained from intrinsic functional connectivity, which organizes slowly fluctuating ongoing brain activity. In our study, 31 demographically homogeneous healthy young participants performed whole- and partial-report tasks and underwent resting-state functional magnetic resonance imaging (rs-fMRI). Report accuracy was modeled using TVA to estimate, individually, the four TVA parameters. Networks encompassing cortical areas relevant for visual attention were derived from independent component analysis of rs-fMRI data: visual, executive control, right and left frontoparietal, and ventral and dorsal attention networks. Two TVA parameters were mapped on particular functional networks. First, participants with higher (vs. lower) visual processing speed showed lower functional connectivity within the ventral attention network. Second, participants with more (vs. less) efficient top-down control showed higher functional connectivity within the dorsal attention network and lower functional connectivity within the visual network. Additionally, higher performance was associated with higher functional connectivity between networks: specifically, between the ventral attention and right frontoparietal networks for visual processing speed, and between the visual and executive control networks for top-down control. The higher inter-network functional connectivity was related to lower intra-network connectivity. These results demonstrate that separable visual attention parameters that are assumed to constitute relatively stable traits correspond distinctly to the functional connectivity both within and between particular functional networks. This implies that individual differences in basic attention functions are represented by differences in the coherence of slowly fluctuating brain activity.

Keywords: functional connectivity; intrinsic brain networks; resting-state fMRI; top-down control; visual attention; visual processing speed.


Figures

Figure 1
Figure 1
Whole- (left) and partial-report (right) tasks used to assess and estimate visual attention functions. In the partial-report task, targets (T) are presented in red, and distracters (D) in green.
Figure 2
Figure 2
Visual attention-relevant brain networks selected from 20 components obtained from independent component (IC) analysis and dual regression of resting-state BOLD-fMRI data of 31 healthy young participants. The spatial maps represent voxels significantly belonging to each network (p < 0.05, FWE-corrected) and are overlaid onto an anatomical high-resolution brain-extracted template in MNI space (Holmes et al., ; Rorden and Brett, ; MRIcron). The labels just serve to identify them and follow conventional names given in the literature.
Figure 3
Figure 3
Group differences in intrinsic functional connectivity (FC). The group with higher visual processing speed C estimates showed lower FC of the right middle frontal gyrus within a ventral attention network (left part). The group with better top-down control α estimates showed both higher FC of the right precuneus within a dorsal attention (middle part) and lower connectivity of the right calcarine sulcus within a visual network (right part). Significant clusters (in red) are overlaid onto the respective group spatial maps of Figure 2 (in yellow). Below these maps, respective group differences can be observed with respect to the Eigenvariate or average FC of the networks. Error bars indicate standard error of the mean. Significant clusters have FWE-corrected p < 0.0083. Red bars show t-values (see also Table 4).
Figure 4
Figure 4
Inter-network functional connectivity (FC) among visual-attention relevant networks. One-sample t-test results (q < 0.05 FDR corrected for multiple comparisons) of the correlations among components on one side of a symmetrical matrix (below the diagonal line). Significant correlations are color-coded in warm (positive) and cool (negative) colors, whereas non-significant correlations are coded in turquoise. Spatial maps of components are depicted in Figure 2. The color bar shows mean Fisher r-to-z transformed values.
Figure 5
Figure 5
Visual processing speed (left) and top-down control (right) matrices showing t-values of high vs. low performance group differences. Higher inter-network functional connectivity (FC) values of the ventral attention (left), and visual (right) networks with the other networks were tested for the high performance group of speed and top-down control, respectively. The inter-network FC of the ventral attention network with the right frontoparietal network was significantly higher for the group with higher visual processing speed C. The inter-network FC of the visual network with the executive control network was significantly higher for the group with better top-down control α. The color bar shows t values (df = 29, high vs. low, p < 0.05).

References

    1. Allen E. A., Erhardt E. B., Damaraju E., Gruner W., Segall J. M., Silva R. F., et al. (2011). A baseline for the multivariate comparison of resting-state networks. Front. Syst. Neurosci. 5:2. 10.3389/fnsys.2011.00002 - DOI - PMC - PubMed
    1. Ashburner J., Friston K. J. (2005). Unified segmentation. Neuroimage 26, 839–851. 10.1016/j.neuroimage.2005.02.018 - DOI - PubMed
    1. Baldauf D., Desimone R. (2014). Neural mechanisms of object-based attention. Science 344, 424–427. 10.1126/science.1247003 - DOI - PubMed
    1. Beckmann C. F., Smith S. M. (2004). Probabilistic independent component analysis for functional magnetic resonance imaging. IEEE Trans. Med. Imaging 23, 137–152. 10.1109/TMI.2003.822821 - DOI - PubMed
    1. Beckmann C. F., Mackay C. E., Filippini N., Smith S. (2009). Group comparison of resting-state FMRI data using multi-subject ICA and dual regression. Neuroimage 47(Suppl. 1), S148 10.1016/S1053-8119(09)71511-3 - DOI

LinkOut - more resources