. 2018 Apr 6;5(1):ENEURO.0417-17.2018.
doi: 10.1523/ENEURO.0417-17.2018. eCollection 2018 Jan-Feb.

Large Scale In Vivo Recording of Sensory Neuron Activity with GCaMP6

Affiliations

Large Scale In Vivo Recording of Sensory Neuron Activity with GCaMP6

Kim I Chisholm et al. eNeuro. .

Abstract

Greater emphasis on the study of intact cellular networks in their physiological environment has led to rapid advances in intravital imaging of the central nervous system (CNS), while the peripheral system remains largely unexplored. To assess large networks of sensory neurons, we selectively label primary afferents with GCaMP6s in male and female C57bl/6 mice and visualize their functional responses to peripheral stimulation in vivo. We show that we are able to monitor the activity of hundreds of sensory neurons simultaneously, with sufficient sensitivity to detect, in most cases, single action potentials with a typical rise time of around 200 ms, and an exponential decay with a time constant of approximately 700 ms. With this technique we are able to characterize the responses of large populations of sensory neurons to innocuous and noxious mechanical and thermal stimuli under normal and inflammatory conditions. We demonstrate that the majority of primary afferents are polymodal with between 50-80% of thermally sensitive DRG neurons responding also to noxious mechanical stimulation. We also specifically assess the small population of peripheral cold neurons and demonstrate significant sensitization to cooling after a model of sterile and persistent inflammation, with significantly increased sensitivity already at decreases of 5°C when compared to uninflamed responses. This not only reveals interesting new insights into the (patho)physiology of the peripheral nervous system but also demonstrates the sensitivity of this imaging technique to physiological changes in primary afferents.

Keywords: dorsal root ganglia; genetically encoded calcium indicators; in vivo imaging; nociception; pain; primary afferents.


Figures
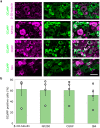
Figure 1.
Figure 1.
Intrathecal injections label a representative sample of DRG neurons. A, Representative image of GCaMP-positive cells (green) as a proportion of all β-III-tubulin, NF200, CGRP, and IB4 immunoreactive neurons (magenta) after intrathecal injection. Scale bar: 50 µm. β-III-tubulin is a pan neuronal marker; NF200 labels large myelinated neurons; CGRP labels small peptidergic neurons; IB4 labels small, non-peptidergic fibers. B, Quantification of A; the percentage of β-III-tubulin, NF200, CGRP, and IB4 immunoreactive cells that are also positive for GCaMP; n = 4 mice. Green bar graphs represent mean ± SEM while individual data points are displayed as empty circles.
Figure 2.
Figure 2.
GCaMP labeled DRG neurons can be visualized in vivo using standard confocal microscopy. A, Diagram showing the imaging set-up. The L4 DRG is exposed in a deeply anesthetized mouse, and the spinal column on either side of the exposed DRG is stabilized for in vivo confocal/two-photon imaging using spinal clamps attached to a custom-made stage. B, Sample images of the DRG in vivo acquired under confocal (open pinhole) or two-photon mode. Confocal microscopy with an open pinhole reveals cellular GCaMP signal, which is lost in two-photon acquisition mode. Due to the more restricted slice thickness of multiphoton microscopy (left panel), fewer neurons are visible in the same field of view compared to when confocal microscopy is used with an open pinhole (right panel). This is particularly obvious during stimulation of the sciatic nerve (lower panel). Scale bar: 200 µm. C, Fluorescence traces of B. The sciatic nerve was stimulated at 1, 2, and 5 Hz at both A- and C-fiber strengths to achieve a representative view of different response amplitudes both during confocal and multiphoton acquisition. In this preparation, a cleaner signal is generated when confocal microscopy with an open pinhole is used compared to two-photon microscopy. D, Sample images of the DRG at baseline and following neuronal calcium accumulation >30 min after death. GCaMP6s provides a large dynamic range over which to detect signal changes in vivo. Very little signal is evident when the animal is unstimulated (baseline) while a large increase in signal strength is evident following intracellular calcium accumulation >30 min after death (postmortem). Scale bar: 200 µm. E, Frequency histogram and cumulative sum percentage of differentially sized cell bodies shows a skewed distribution with a larger percentage of smaller somata; n = 3456 neurons in n = 13 mice.
Figure 3.
Figure 3.
Electrical stimulation of the sciatic nerve leads to an increase in calcium signals in the DRG in an intensity and frequency dependent manner. A, Images of DRG cell bodies during direct stimulation of the sciatic nerve, at different frequencies and intensities. Scale bar: 200 µm. B, Traces of individual cell bodies responding to electrical stimulation. Yellow lines represent neurons that respond to both A- and C-fiber strength stimulation and purple lines represent neurons that respond to C-fiber strength stimuli only. Data points displayed at averaged intensity over the period of stimulation; n = 774 neurons in n = 6 mice. C, Representative traces of GCaMP fluorescence during electrical stimulation. Electrical stimulation at A- and C-fiber strength resulted in activation of distinct subsets of neurons in a frequency dependent manner. Black lines represent averaged data. D, Representative traces of GCaMP fluorescence during stimulation at C-fiber strength at low frequencies (0.5, 1, and 2 Hz) and high frame acquisition rate (8 Hz). Single action potentials generated by single electrical pulses to the sciatic nerve could be detected in the DRG. Each trace represents fluorescence from a single cell. E, Size distribution of cell bodies that respond to A- and C-fiber strength stimulation (yellow) compared to cell bodies that respond only to C-fiber strength stimuli (purple) and the cumulative sum of their sizes. Neurons responsive to A- and C-fiber strength stimulation are significantly larger compared to neurons which only respond to C-fiber strength stimuli: two-sample Kolmogorov–Smirnov test, n = 776 neurons in n = 6 mice, p < 0.001. See also Video 1 for a recording of neuronal responses to electrical stimulation of the sciatic nerve.
Figure 4.
Figure 4.
Polymodality is common in primary afferents. A, Example images of DRG neurons responding to mechanical and thermal stimulation of the ipsilateral plantar paw. Scale bar: 50 µm. B, Color coded example traces of neurons highlighted in A. C, Percentage of thermally sensitive DRG neurons responding also to noxious mechanical stimulation. Similar percentages of polymodal (thermally and mechanically sensitive neurons) were detected when using AAV9 to deliver GCaMP through intrathecal injections (n = 6) or when expressing GCaMP transgenically only in DRG neurons through GCaMP floxed mice expressing cre under the Advillin promoter (peripheral neurons; n = 3) or when expressing GCaMP in all neurons through the Snap25 promoter (n = 3). Total n = 1138 neurons. Blue data points show the percentage of cold sensitive neurons responding to pinch while red data points indicate the percentage of hot responding neurons also responding to pinch. Diamonds display the mean ± SEM, circles indicate single mice. D, Cell size distribution of cell bodies that respond to changes in temperatures versus cell bodies that respond to A-fiber strength stimulation, C-fiber strength stimulation, brush and pinch, and the cumulative sum of their sizes. Cell bodies responsive to A-fiber strength stimulation, C-fiber strength stimulation, brush and pinch are significantly larger compared to somata which respond to changes in temperature: two-sample Kolmogorov–Smirnov test, total n = 1166 neurons in n = 4 mice, p < 0.001 for all comparisons against temperature sensitive cell bodies, except temperature-responsive neurons versus C-fiber stimulation where p = 0.019. See also Video 2 for a representative recording of polymodal responses in the DRG.
Figure 5.
Figure 5.
DRGs play a defining role in the generation of pain behavior in the formalin test. A, Example traces of GCaMP fluorescence 0–30 min after intraplantar injection of saline (0.9%) and formalin (1.85%) in the same neurons. B, Average response of DRG neurons (n = 666 neurons in n = 5 mice, all subjected to saline and formalin) and behavioral response in mice (n = 8) after injection of saline and formalin into the plantar surface of the hind paw. Cellular response was averaged over 1 min and across neurons. Pain behavior was assessed as the number of pain events displayed by the mouse in 5-min increments. All data displayed as mean ± SEM. Repeated-measures ANOVA, interaction of treatment (formalin vs saline) with time: F(28,18,620) = 16.607, p < 0.001.
Figure 6.
Figure 6.
UVB irradiation increases the responsiveness of peripheral neurons. A, Representative images of DRG neurons in mice stimulated with 32°C (baseline) and 48°C on the ipsilateral plantar surface, 48 h after UVB irradiation or control anesthesia. Scale bar: 100 µm. B, The response intensity of neurons stimulated thermally 48 h after UVB irradiation or control anesthesia. The response of neurons to both warming (n = 393 neurons) and cooling (n = 71 neurons) of the ipsilateral paw is significantly greater in UVB-irradiated animals compared to controls. Differences were compared between groups in a split-plot ANOVA: For warming F(1391) = 28.573, p < 0.001 and for cooling F(1,69) = 11.421, p = 0.001. C, Response intensities of neurons stimulated mechanically (brush: n = 222 neurons; pinch: n = 787 neurons) 48 h after UVB irradiation are significantly greater as compared to neurons in sham irradiated mice (independent sample t test, equal variances not assumed; for brush t(149.742) = 4.112, p < 0.001. For pinch t(730.186) = 9.848, p < 0.001). D, The percentage of neurons responding to mechanical stimulation was not significantly different in UVB-irradiated animals compared to controls (independent sample t test, equal variances not assumed; t(2.112) = 2.696, p = 0.108 for neurons responding to brush and t(2.0456) = 2.216, p = 0.154 for neurons responding to pinch). E, The percentage of neurons responding to both warming and cooling of the ipsilateral paw was not significantly different in UVB-irradiated animals compared to controls (between groups difference in a split-plot ANOVA, F(1,5) = 1.6, p = 0.262). ***p < 0.001, **p < 0.002. For all experiments data displayed as mean ± SEM, n = 7 mice (three control, four UVB).

References

    1. Barretto RPJ, Gillis-Smith S, Chandrashekar J, Yarmolinsky DA, Schnitzer MJ, Ryba NJP, Zuker CS (2015) The neural representation of taste quality at the periphery. Nature 517:373–376. 10.1038/nature13873 - DOI - PMC - PubMed
    1. Bewersdorf J, Pick R, Hell SW (1998) Multifocal multiphoton microscopy. Opt Lett 23:655. - PubMed
    1. Bishop T, Marchand F, Young AR, Lewin GR, McMahon SB (2010) Ultraviolet-B-induced mechanical hyperalgesia: a role for peripheral sensitisation. Pain 150:141–152. 10.1016/j.pain.2010.04.018 - DOI - PubMed
    1. Callamaras N, Parker I (1999) Construction of a confocal microscope for real-time x-y and x-z imaging. Cell Calcium 26:271–279. 10.1054/ceca.1999.0085 - DOI - PubMed
    1. Chen Q, Cichon J, Wang W, Qiu L, Lee S-JR, Campbell NR, Destefino N, Goard MJ, Fu Z, Yasuda R, Looger LL, Arenkiel BR, Gan W-B, Feng G (2012) Imaging neural activity using Thy1-GCaMP transgenic mice. Neuron 76:297–308. 10.1016/j.neuron.2012.07.011 - DOI - PMC - PubMed

Publication types

MeSH terms

Substances

LinkOut - more resources