

Urban Health Indicator Tools of the Physical Environment: a Systematic Review
- PMID: 29663118
- PMCID: PMC6181826
- DOI: 10.1007/s11524-018-0228-8
Urban Health Indicator Tools of the Physical Environment: a Systematic Review
Abstract
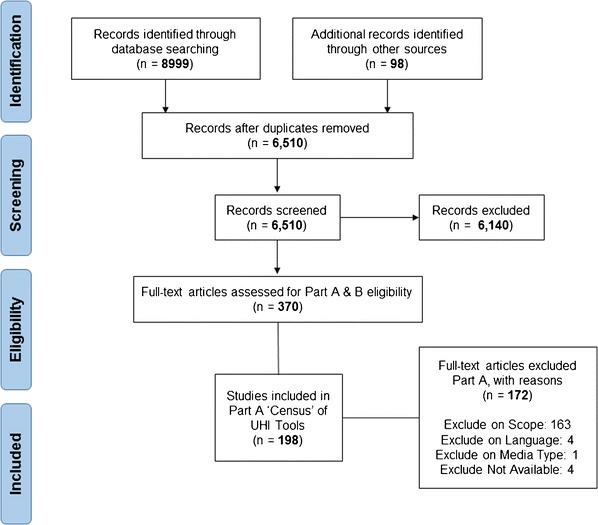
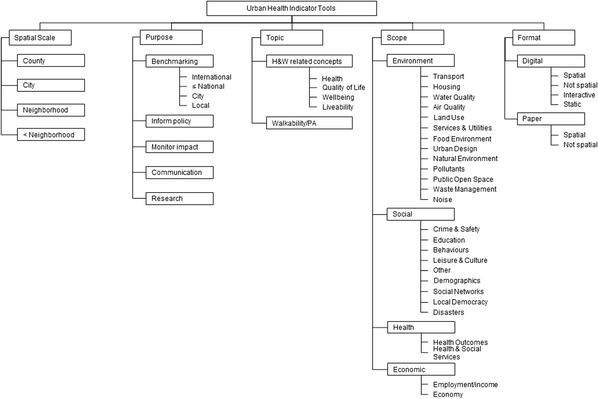
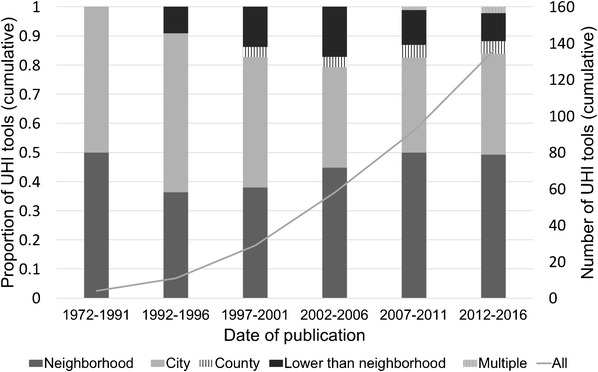
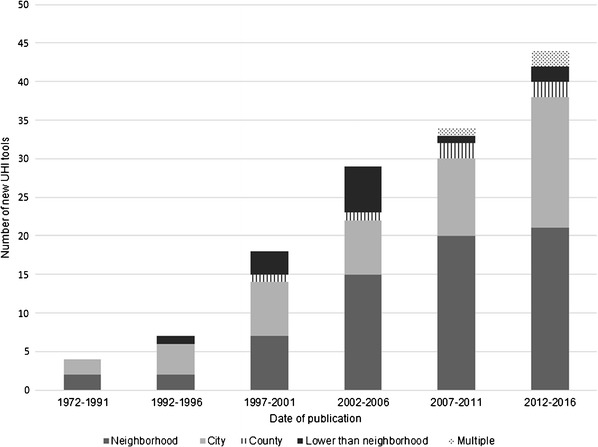
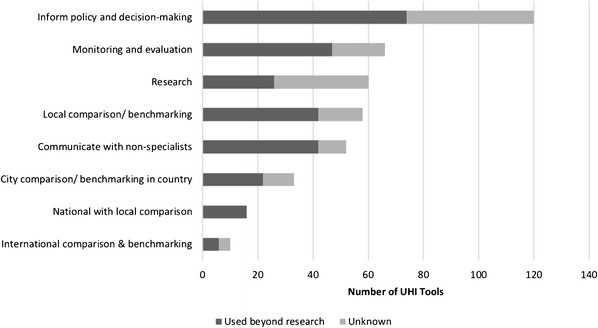
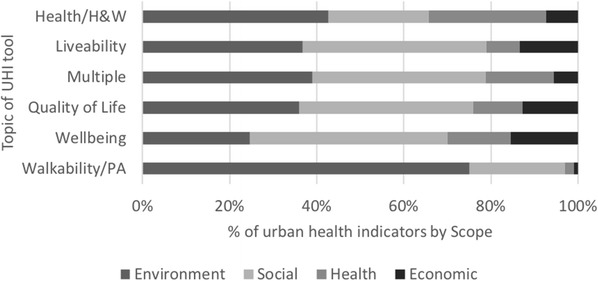
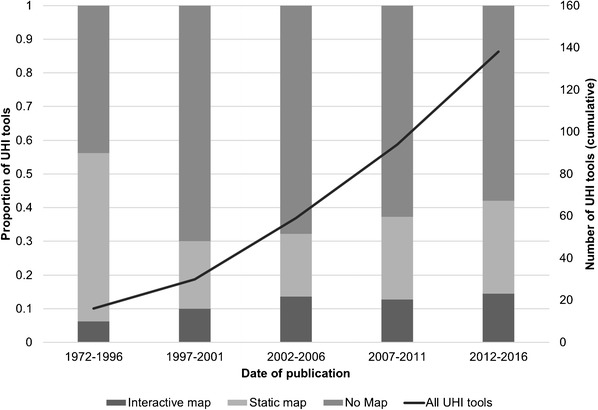
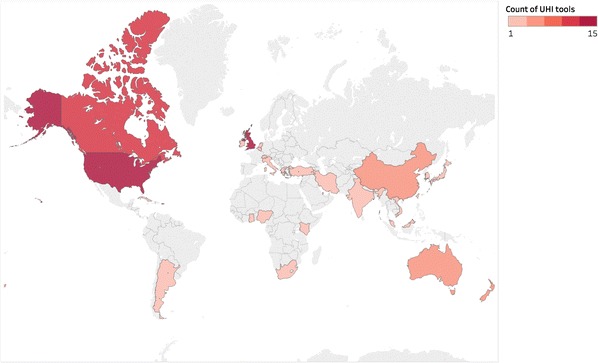
Urban health indicator (UHI) tools provide evidence about the health impacts of the physical urban environment which can be used in built environment policy and decision-making. Where UHI tools provide data at the neighborhood (and lower) scale they can provide valuable information about health inequalities and environmental deprivation. This review performs a census of UHI tools and explores their nature and characteristics (including how they represent, simplify or address complex systems) to increase understanding of their potential use by municipal built environment policy and decision-makers. We searched seven bibliographic databases, four key journals and six practitioner websites and conducted Google searches between January 27, 2016 and February 24, 2016 for UHI tools. We extracted data from primary studies and online indicator systems. We included 198 documents which identified 145 UHI tools comprising 8006 indicators, from which we developed a taxonomy. Our taxonomy classifies the significant diversity of UHI tools with respect to topic, spatial scale, format, scope and purpose. The proportions of UHI tools which measure data at the neighborhood and lower scale, and present data via interactive maps, have both increased over time. This is particularly relevant to built environment policy and decision-makers, reflects growing analytical capability and offers the potential for improved understanding of the complexity of influences on urban health (an aspect noted as a particular challenge by some indicator producers). The relation between urban health indicators and health impacts attributable to modifiable environmental characteristics is often indirect. Furthermore, the use of UHI tools in policy and decision-making appears to be limited, thus raising questions about the continued development of such tools by multiple organisations duplicating scarce resources. Further research is needed to understand the requirements of built environment policy and decision-makers, public health professionals and local communities regarding the form and presentation of indicators which support their varied objectives.
Keywords: Built environment; Evidence; Healthy cities; Indicator; Indices; Policy; Social determinants of health; Urban health; Urban metrics; Urban planning.
Figures

Similar articles
-
Characteristics and use of urban health indicator tools by municipal built environment policy and decision-makers: a systematic review protocol.Syst Rev. 2017 Jan 13;6(1):2. doi: 10.1186/s13643-017-0406-x. Syst Rev. 2017. PMID: 28086971 Free PMC article.
-
Use of Urban Health Indicator Tools by Built Environment Policy- and Decision-Makers: a Systematic Review and Narrative Synthesis.J Urban Health. 2020 Jun;97(3):418-435. doi: 10.1007/s11524-019-00378-w. J Urban Health. 2020. PMID: 31482385 Free PMC article.
-
Extending Data for Urban Health Decision-Making: a Menu of New and Potential Neighborhood-Level Health Determinants Datasets in LMICs.J Urban Health. 2019 Aug;96(4):514-536. doi: 10.1007/s11524-019-00363-3. J Urban Health. 2019. PMID: 31214975 Free PMC article.
-
Assessing Urban Health Inequities through a Multidimensional and Participatory Framework: Evidence from the EURO-HEALTHY Project.J Urban Health. 2020 Dec;97(6):857-875. doi: 10.1007/s11524-020-00471-5. J Urban Health. 2020. PMID: 32860097 Free PMC article.
-
The Urban Heat Island: Implications for Health in a Changing Environment.Curr Environ Health Rep. 2017 Sep;4(3):296-305. doi: 10.1007/s40572-017-0150-3. Curr Environ Health Rep. 2017. PMID: 28695487 Review.
Cited by
-
Towards healthy urbanism: inclusive, equitable and sustainable (THRIVES) - an urban design and planning framework from theory to praxis.Cities Health. 2022 Sep 3;6(5):974-992. doi: 10.1080/23748834.2020.1769527. Epub 2020 Jun 26. Cities Health. 2022. PMID: 39444987 Free PMC article.
-
Integrating Urban Land Tenure Security in Health Determinants: The Design of Indicators for Measuring Land Tenure Security and Health Relationships in Developing Country Contexts.Int J Environ Res Public Health. 2022 Mar 5;19(5):3080. doi: 10.3390/ijerph19053080. Int J Environ Res Public Health. 2022. PMID: 35270772 Free PMC article. Review.
-
Operationalising the 20-minute neighbourhood.Int J Behav Nutr Phys Act. 2022 Feb 12;19(1):15. doi: 10.1186/s12966-021-01243-3. Int J Behav Nutr Phys Act. 2022. PMID: 35151334 Free PMC article.
-
Incorporating practitioner knowledge to test and improve a new conceptual framework for healthy urban design and planning.Cities Health. 2022 Sep 3;6(5):906-921. doi: 10.1080/23748834.2020.1773035. Epub 2020 Jun 8. Cities Health. 2022. PMID: 39430873 Free PMC article.
-
A Community EcoHealth Index from EnviroAtlas Ecosystem Services Metrics.Int J Environ Res Public Health. 2019 Aug 2;16(15):2760. doi: 10.3390/ijerph16152760. Int J Environ Res Public Health. 2019. PMID: 31382383 Free PMC article.
References
-
- WHO Commission on Social Determinants of Health. Addressing the social determinants of health: the urban dimension and the role of local government. Copenhagen: World Health Organization Regional Office for Europe; 2012.
-
- Wang H, Naghavi M, Allen C, et al. Global, regional, and national life expectancy, all-cause mortality, and cause-specific mortality for 249 causes of death, 1980–2015: a systematic analysis for the Global Burden of Disease Study 2015. Lancet. 2016;388:1459–1544. doi: 10.1016/S0140-6736(16)31012-1. - DOI - PMC - PubMed
-
- Prüss-Üstün A, Wolf J, Corvalan C, Bos R, Neira M. Preventing disease through healthy environments: a global assessment of the burden of disease from environmental risks. Geneva, Switzerland: World Health Organization; 2016.
-
- Kickbusch I, Gleicher D. Governance for health in the 21st century. Copenhagen: World Health Organization, Regional Office for Europe; 2013.
Publication types
MeSH terms
LinkOut - more resources
Full Text Sources
Other Literature Sources
