. 2018 Jul;223(6):2841-2858.
doi: 10.1007/s00429-018-1663-8. Epub 2018 Apr 16.

When tractography meets tracer injections: a systematic study of trends and variation sources of diffusion-based connectivity

Affiliations

When tractography meets tracer injections: a systematic study of trends and variation sources of diffusion-based connectivity

Dogu Baran Aydogan et al. Brain Struct Funct. 2018 Jul.

Abstract

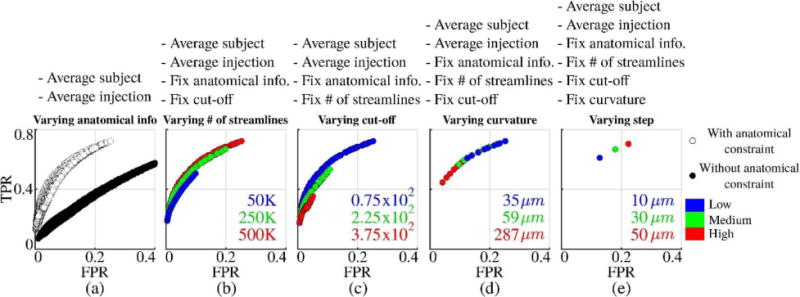
Tractography is a powerful technique capable of non-invasively reconstructing the structural connections in the brain using diffusion MRI images, but the validation of tractograms is challenging due to lack of ground truth. Owing to recent developments in mapping the mouse brain connectome, high-resolution tracer injection-based axonal projection maps have been created and quickly adopted for the validation of tractography. Previous studies using tracer injections mainly focused on investigating the match in projections and optimal tractography protocols. Being a complicated technique, however, tractography relies on multiple stages of operations and parameters. These factors introduce large variabilities in tractograms, hindering the optimization of protocols and making the interpretation of results difficult. Based on this observation, in contrast to previous studies, in this work we focused on quantifying and ranking the amount of performance variation introduced by these factors. For this purpose, we performed over a million tractography experiments and studied the variability across different subjects, injections, anatomical constraints and tractography parameters. By using N-way ANOVA analysis, we show that all tractography parameters are significant and importantly performance variations with respect to the differences in subjects are comparable to the variations due to tractography parameters, which strongly underlines the importance of fully documenting the tractography protocols in scientific experiments. We also quantitatively show that inclusion of anatomical constraints is the most significant factor for improving tractography performance. Although this critical factor helps reduce false positives, our analysis indicates that anatomy-informed tractography still fails to capture a large portion of axonal projections.

Keywords: ANOVA; Connectome; Mouse; Tractography; Validation.


Conflict of interest statement

Author Disclosure Statement: The authors declare that they have no conflict of interest.

Figures

Fig. 1
Fig. 1
Top panel shows the 3D volume renderings for the ten tracer projection densities used in Mode-I and Mode-II comparisons. Injection sites used in the study are visualized on the bottom panel.
Fig. 2
Fig. 2
(a) Visualization for registration accuracy using a checkerboard pattern on an axial slice (b) FODs reconstructed from multi-shell mouse brain dMRI data are plotted on a coronal slice (c) Whole brain tractography results from FOD-based probabilistic tractography
Fig. 3
Fig. 3
Graphical description of Mode-I and Mode-II analysis (a) Injection seed and projections are shown with green and yellow respectively (b) Mode-I uses the discretized ground that is the existence of projections to voxels (c) Mode-I results are computed using the streamlines projecting from the seed location (d) In Mode-II spurious projections are removed from the ground truth (e) Mode-II results are computed by trimming the ends of streamlines that are outside the ground truth. This presents the case where an anatomical constraint requires the end points of all streamlines to project to a ground truth voxel.
Fig. 4
Fig. 4
3D overlap of the tracer projection density for I6 (shown in yellow) and tractography results (shown in red) using two of the eight subjects, M1 and M2. Top and bottom rows show the results for Mode-I and Mode-II comparisons, respectively. While Mode-II does not noticeably affect the tracer data since it only removes spurious projections, there are visible differences in tractograms (shown with blue arrows) due to the introduction of anatomical constraints. Computed measures are listed under each experiment. Case A shows better results compared to Cases B and C.
Fig. 5
Fig. 5
Effects of parameter variations on the overlapping measures between tractography and tracer projection density for I6. Top and bottom rows show the results for subjects M1 and M2, respectively. Reference points corresponding to Case A, B and C in Table 3 are plotted as x. On each column, only one of the parameters is varied, i.e.: for the two plots under curvature, only the curvature parameter is changed, all other parameters are kept same. The size of the data points is in proportion to the DICE coefficient.
Fig. 6
Fig. 6
Variability of tractography performances with respect to number of streamlines and cut-off parameters. The dimensions of data points are in proportion to the DICE coefficients. First and third rows show the same data points which are collected from all of the experiments using injections I1 and I6 on M1 (14580 experiments = 2 modes × 9 step sizes × 9 curvatures × 9 cut-off thresholds × 10 number of streamlines). However the coloring of points are done with respect to number of streamlines in the first column and cut-off in the third to highlight the trends. Cut-off is fixed to 0.75×10⁻² in the second column to clarify the trend with respect to changes in number of streamlines. Similarly in the fourth column number of streamlines is fixed to 500K to emphasize the trend with respect to cut-off changes.
Fig. 7
Fig. 7
Variability of tractography performances with respect to curvature and step size parameters. The dimensions of data points are in proportion to the DICE coefficients. All data points are a sub-set of the experiments shown in Fig. 6. In order to keep the plots simple, the number of streamlines is fixed to 500K and three different (fixed) cut-off values are shown in each column. Data points with respect to varying curvature values are shown with different symbols whereas different colors are used to show the points for varying step size.
Fig. 8
Fig. 8
Multiple comparison plots and F-statistics obtained by N-way ANOVA analysis. Multiple comparison shows a large separation of results with respect to mode. Red data points on multiple comparison plots show ANOVA results obtained when modes are separated. The outlier curvature=287 μm group is removed from all F-statistic results.
Fig. 9
Fig. 9
Summary of trends in tractography performance with respect to parameter changes. Data points show average values over all subjects and injection sites.

Similar articles

Cited by

References

    1. Aganj I, Lenglet C, Sapiro G, Yacoub E, Ugurbil K, Harel N. Reconstruction of the orientation distribution function in single-and multiple-shell q-ball imaging within constant solid angle. Magnetic Resonance in Medicine. 2010;64(2):554–566. - PMC - PubMed
    1. Albi A, Meola A, Zhang F, Kahali P, Rigolo L, Tax CMW, Ciris PA, Essayed WI, Unadkat P, Norton I, Rathi Y, Olubiyi O, Golby AJ, O’Donnell LJ. Image Registration to Compensate for EPI Distortion in Patients with Brain Tumors: An Evaluation of Tract-Specific Effects. J Neuroimaging. 2018 doi: 10.1111/jon.12485. - DOI - PMC - PubMed
    1. Avants BB, Tustison NJ, Song G, Cook PA, Klein A, Gee JC. A reproducible evaluation of ANTs similarity metric performance in brain image registration. Neuroimage. 2011;54(3):2033–2044. - PMC - PubMed
    1. Aydogan DB, Shi Y. Probabilistic Tractography for Topographically Organized Connectomes. In: Ourselin S, Joskowicz L, Sabuncu MR, Unal G, Wells W, editors. Medical Image Computing and Computer-Assisted Intervention – MICCAI 2016. Springer International Publishing; Cham: 2016. pp. 201–209. (19th International Conference, Athens, Greece, October 17–21, 2016, Proceedings, Part I). - DOI - PMC - PubMed
    1. Azadbakht H, Parkes LM, Haroon HA, Augath M, Logothetis NK, de Crespigny A, D’Arceuil HE, Parker GJ. Validation of High-Resolution Tractography Against In Vivo Tracing in the Macaque Visual Cortex. Cereb Cortex. 2015;25(11):4299–4309. doi: 10.1093/cercor/bhu326. - DOI - PMC - PubMed

LinkOut - more resources