. 2018 May 1;128(5):2048-2063.
doi: 10.1172/JCI95351. Epub 2018 Apr 16.

β-Catenin-mediated immune evasion pathway frequently operates in primary cutaneous melanomas

Affiliations

β-Catenin-mediated immune evasion pathway frequently operates in primary cutaneous melanomas

Jérémie Nsengimana et al. J Clin Invest. .

Abstract

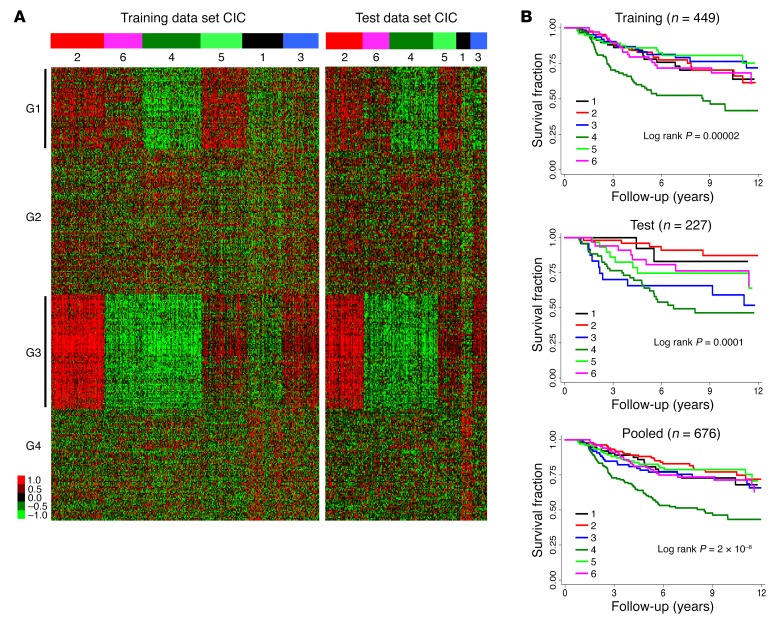
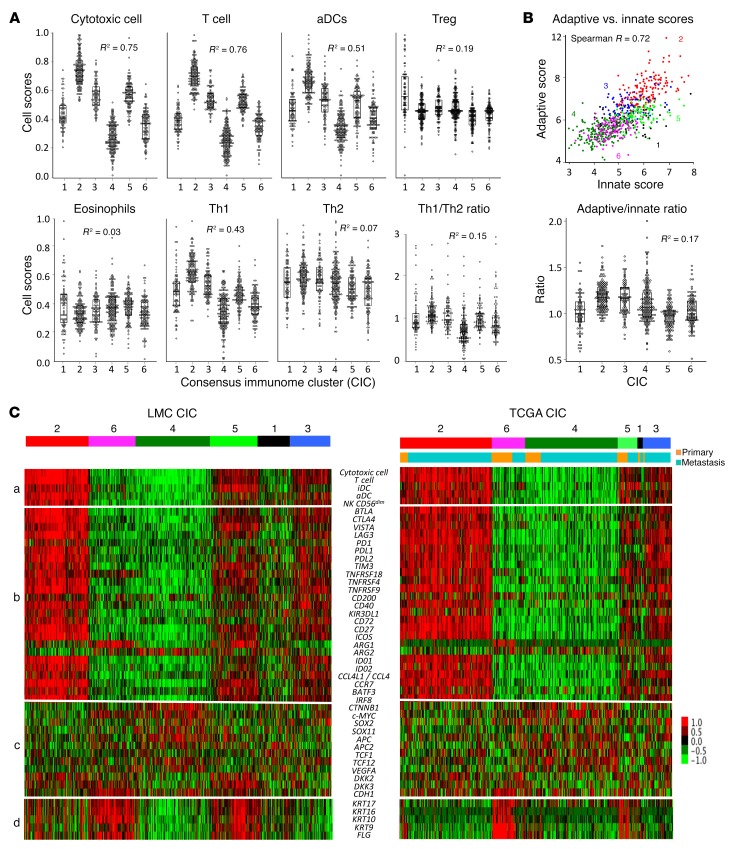
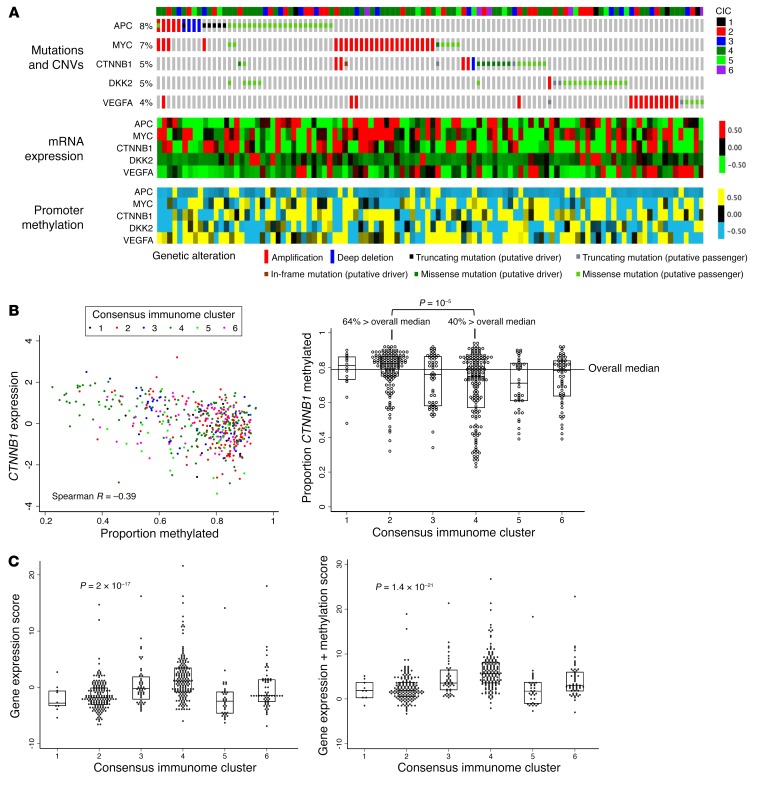
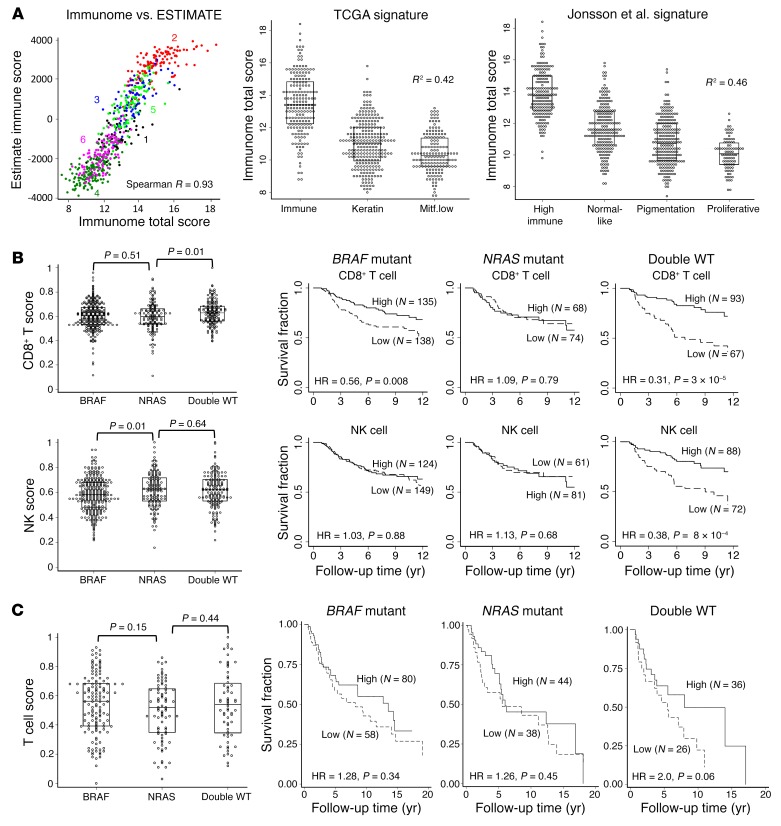
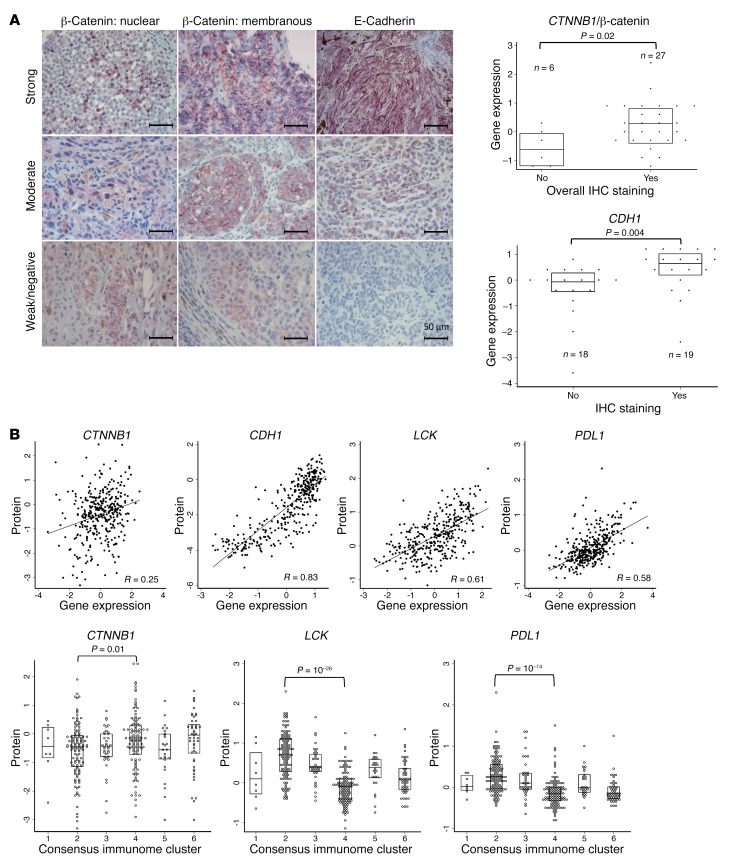
Immunotherapy prolongs survival in only a subset of melanoma patients, highlighting the need to better understand the driver tumor microenvironment. We conducted bioinformatic analyses of 703 transcriptomes to probe the immune landscape of primary cutaneous melanomas in a population-ascertained cohort. We identified and validated 6 immunologically distinct subgroups, with the largest having the lowest immune scores and the poorest survival. This poor-prognosis subgroup exhibited expression profiles consistent with β-catenin-mediated failure to recruit CD141+ DCs. A second subgroup displayed an equally bad prognosis when histopathological factors were adjusted for, while 4 others maintained comparable survival profiles. The 6 subgroups were replicated in The Cancer Genome Atlas (TCGA) melanomas, where β-catenin signaling was also associated with low immune scores predominantly related to hypomethylation. The survival benefit of high immune scores was strongest in patients with double-WT tumors for BRAF and NRAS, less strong in BRAF-V600 mutants, and absent in NRAS (codons 12, 13, 61) mutants. In summary, we report evidence for a β-catenin-mediated immune evasion in 42% of melanoma primaries overall and in 73% of those with the worst outcome. We further report evidence for an interaction between oncogenic mutations and host response to melanoma, suggesting that patient stratification will improve immunotherapeutic outcomes.

Keywords: Cancer immunotherapy; Expression profiling; Immunology; Melanoma; Oncology.


Conflict of interest statement

Conflict of interest: The authors have declared that no conflict of interest exists.

Figures

Figure 1
Figure 1. Tumor classification.
(A) Consensus immunome clusters (CICs) in the LMC training (n = 465) and test (n = 238) data sets ordered according to the dendrogram output from ConsensusClusterPlus (see Supplemental Figure 3). The details of gene clusters G1–G4 are given in Supplemental Figure 4. (B) Differential melanoma-specific survival for patients with tumors in the 6 CICs in the training, test, and pooled data sets unadjusted for histological factors. Cluster size: 11%, 21%, 13%, 25%, 15%, and 15% for CICs 1–6, respectively. Cause of death was unknown or was not melanoma for 27 patients, and they were excluded from survival analysis.
Figure 2
Figure 2. Association of immune scores with evasion mechanisms.
(A) Distribution of selected immune cell scores in 6 CICs (pooled training and test LMC, n = 703). (B) Correlation and ratio between adaptive and innate immune scores (LMC). Owing to the high correlation between adaptive and innate scores, their ratios show a little variation between CICs. In A and B, R2 is the proportion of variance explained by the 6 CICs computed in ANOVA. Dot plots are shown alongside box plots showing the median and the interquartile range. (C) Correlations in LMC and TCGA (n = 472) between (a) 5 cell scores; (b) checkpoint and other regulatory genes; (c) β-catenin signaling genes; and (d) keratin and filaggrin expression. Based on the immune genes and keratin expression, the 6 CICs were described as low immune/β-catenin low (CIC1), high immune (CIC2), intermediate immune/keratin poor (CIC3), low immune/β-catenin high (CIC4), intermediate immune/keratin rich (CIC5), and low immune/keratin rich (CIC6).
Figure 3
Figure 3. β-Catenin pathway regulation by mutations, copy number variation, and promoter methylation.
(A) Plot of mutations, copy number variations (CNVs), mRNA expression, and promoter methylation in genes representing β-catenin pathway in TCGA data set. Figure shows the tumors with at least 1 gene mutated or altered (n = 109) and genes affected by those changes in at least 4% of tumors. The samples (columns) are ordered from the most altered to the least altered. The top annotation bar represents 6 CICs. Fifty-five samples had at least 1 mutation, 44 at least 1 CNV; 5 had both. (B) Correlation between expression of CTNNB1 and its promoter methylation and statistical difference between CICs 2 and 4 (Mann-Whitney test). (C) A score combining expressions of 9 β-catenin signaling genes and their methylation has a higher correlation with the 6 CICs than a score from expression data alone (Kruskal-Wallis). In B and C, the median and the interquartile range are shown in dot and box plots (n = 472).
Figure 4
Figure 4. Immune score interaction with driver mutation.
(A) Correlation between immunome total score in the LMC (n = 703) and its equivalent from ESTIMATE (18) and comparison with 2 published molecular signatures (14, 15). (B) Distribution of CD8+ T cell and NK cell scores and their association with melanoma-specific survival by driver mutation in LMC. (C) Association between T cell score and overall survival by driver mutation in TCGA data set (n = 287). In B and C, the difference in immune cell scores (dot and box plots with median and interquartile range) does not explain the difference in survival. Cox proportional hazards model used in survival analyses; Kruskal-Wallis used to test score distribution by mutation status.
Figure 5
Figure 5. Validation with IHC staining and protein data.
(A) Representative images of IHC staining in the LMC demonstrating strong, moderate, and weak/negative expression of β-catenin localized to the nucleus (left column) and to the membrane (middle column) and expression of E-cadherin (right column) (CTNNB1 and CDH1 were stained in 33 and 37 tumors, respectively). Dot and box plots (median and interquartile range) show mRNA expression of CTNNB1 and CDH1 compared with IHC staining. (B) Protein (RPPA) data for LCK, PDL-1, CTNNB1, and CDH1 in TCGA skin melanomas (n = 354) in comparison with mRNA expression and CICs. Kruskal-Wallis test and Spearman correlation were used. Box plots show the median and the interquartile range.

References

    1. Schatton T, Scolyer RA, Thompson JF, Mihm MC. Tumor-infiltrating lymphocytes and their significance in melanoma prognosis. Methods Mol Biol. 2014;1102:287–324. doi: 10.1007/978-1-62703-727-3_16. - DOI - PubMed
    1. Pardoll DM. The blockade of immune checkpoints in cancer immunotherapy. Nat Rev Cancer. 2012;12(4):252–264. doi: 10.1038/nrc3239. - DOI - PMC - PubMed
    1. Ugurel S, et al. Survival of patients with advanced metastatic melanoma: the impact of novel therapies-update 2017. Eur J Cancer. 2017;83:247–257. doi: 10.1016/j.ejca.2017.06.028. - DOI - PubMed
    1. Wolchok JD, et al. Four-year survival rates for patients with metastatic melanoma who received ipilimumab in phase II clinical trials. Ann Oncol. 2013;24(8):2174–2180. doi: 10.1093/annonc/mdt161. - DOI - PMC - PubMed
    1. Robert C, et al. Improved overall survival in melanoma with combined dabrafenib and trametinib. N Engl J Med. 2015;372(1):30–39. doi: 10.1056/NEJMoa1412690. - DOI - PubMed

Publication types

MeSH terms