. 2018 May 1;128(5):2127-2143.
doi: 10.1172/JCI98215. Epub 2018 Apr 16.

Specialized fibroblast differentiated states underlie scar formation in the infarcted mouse heart

Affiliations

Specialized fibroblast differentiated states underlie scar formation in the infarcted mouse heart

Xing Fu et al. J Clin Invest. .

Abstract

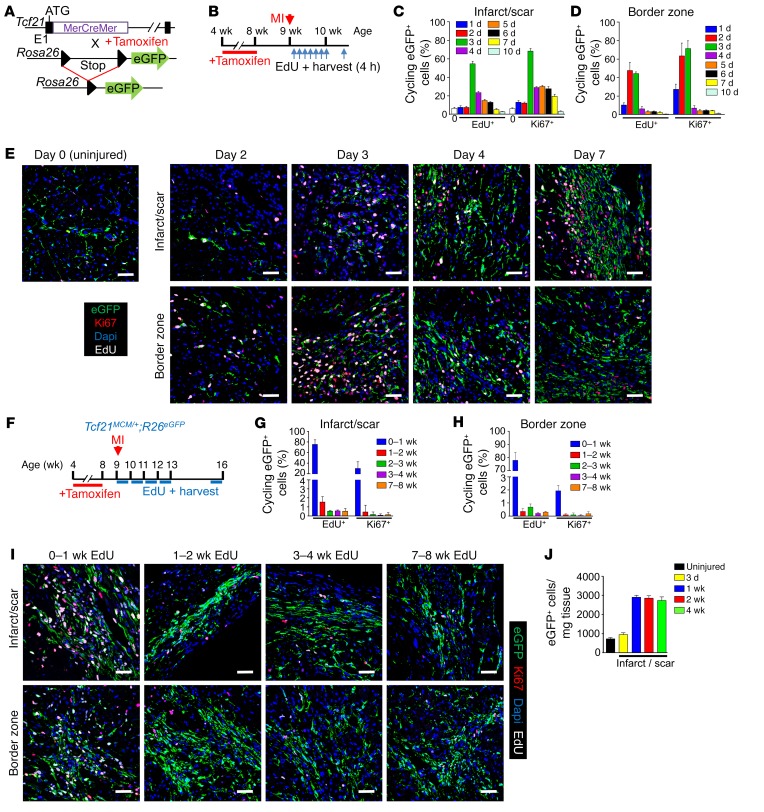
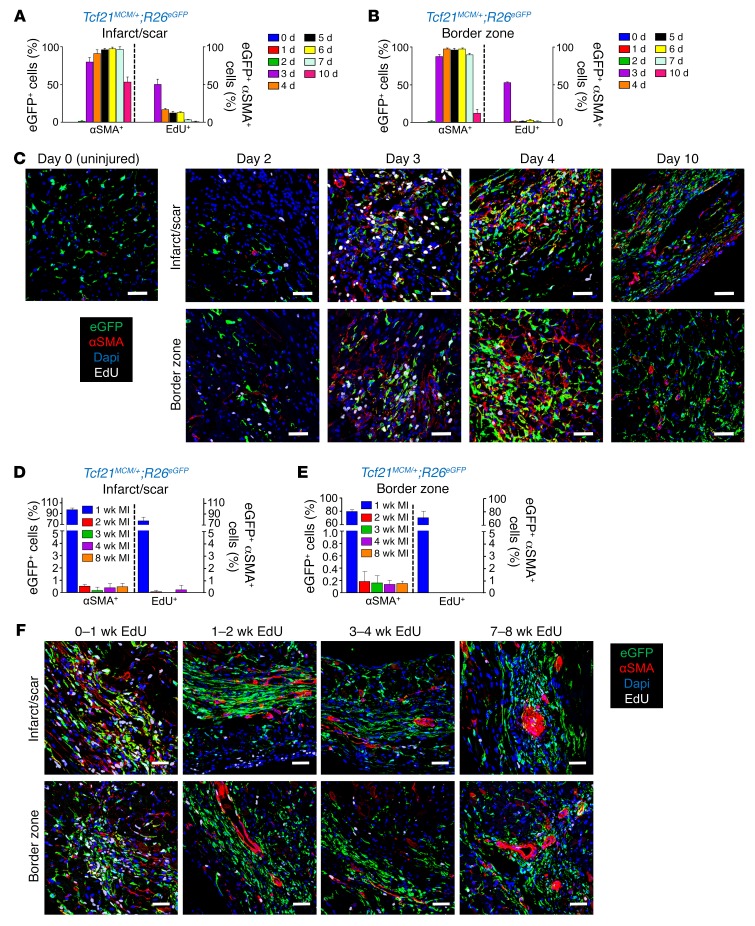
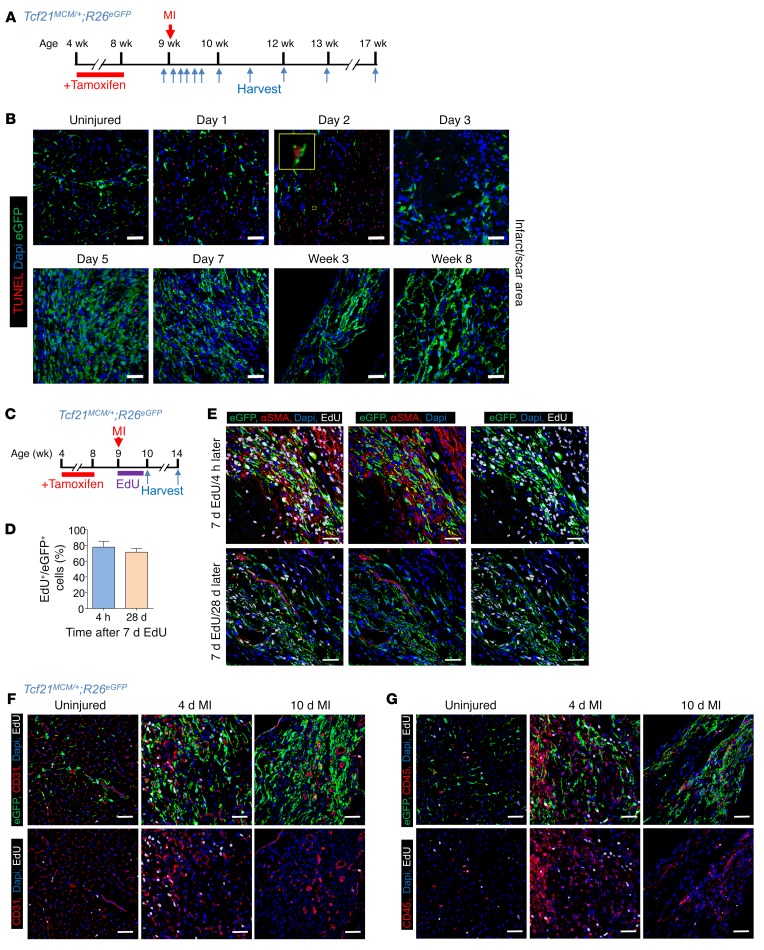
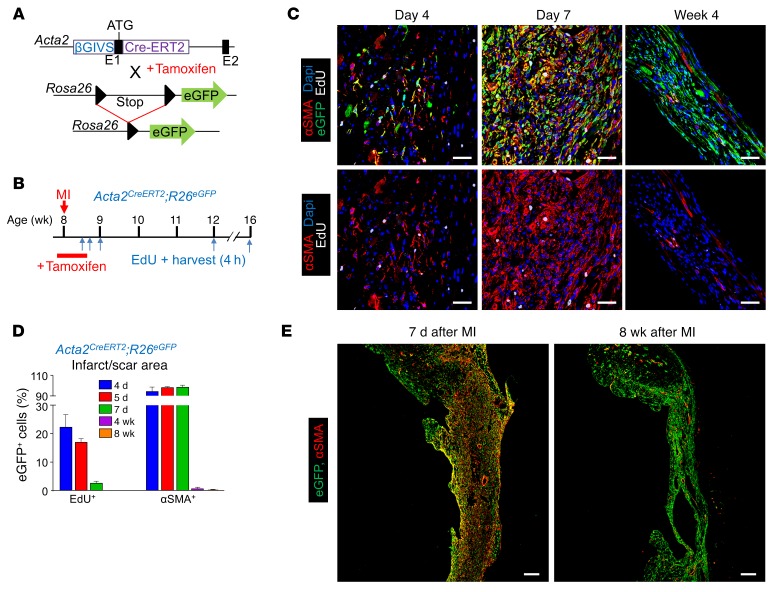
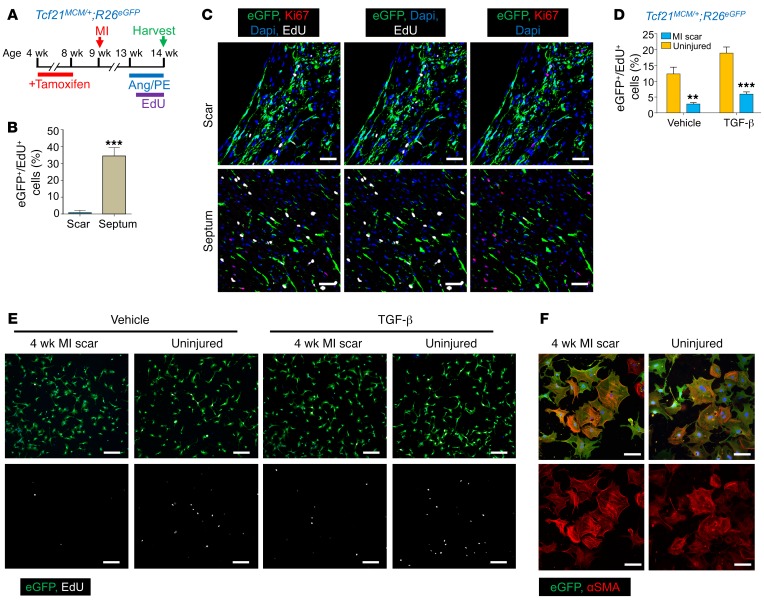
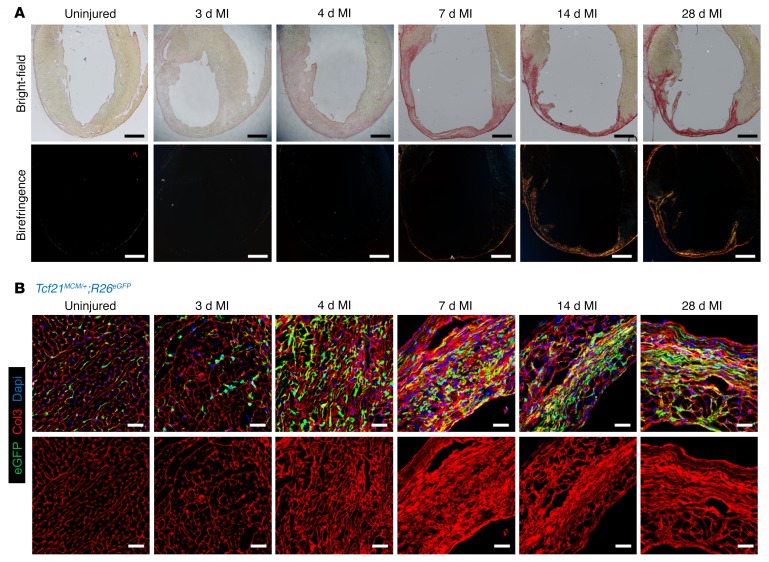
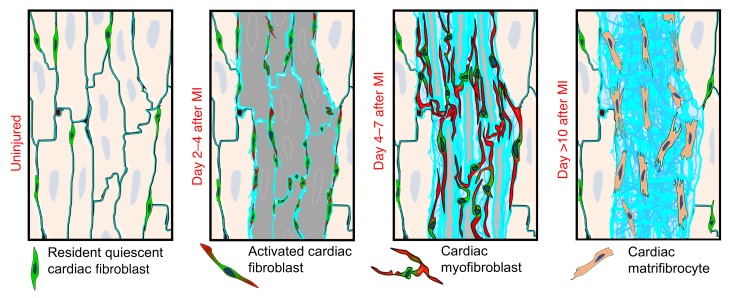
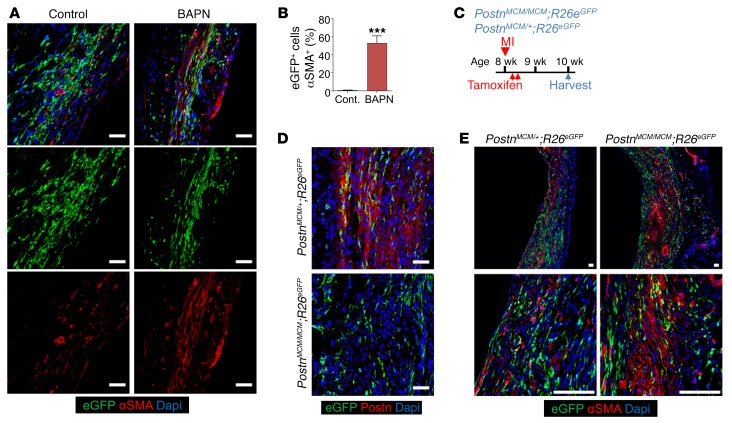
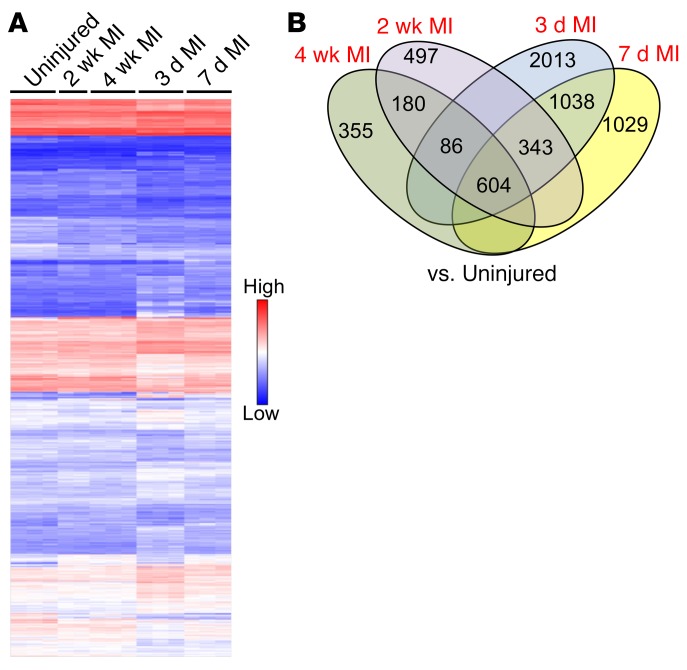
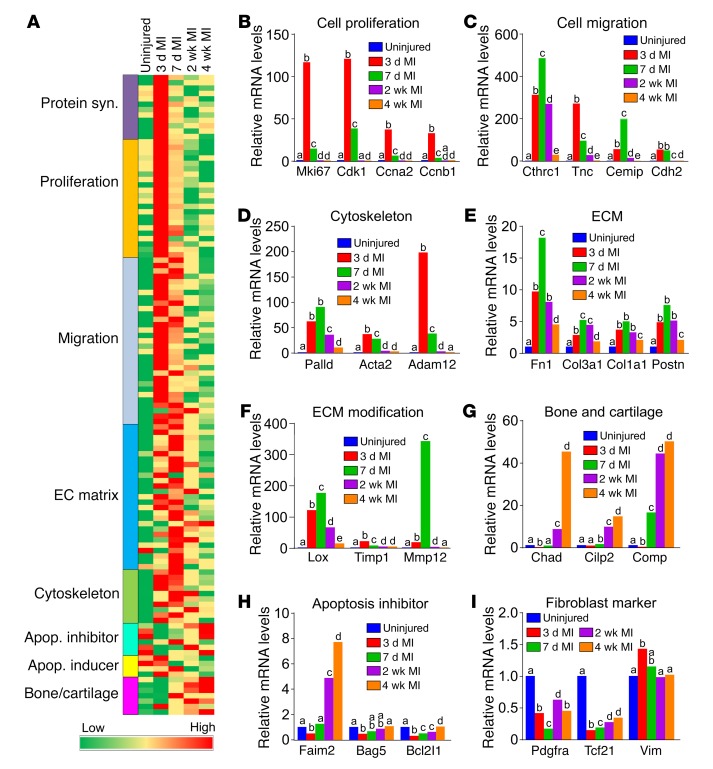
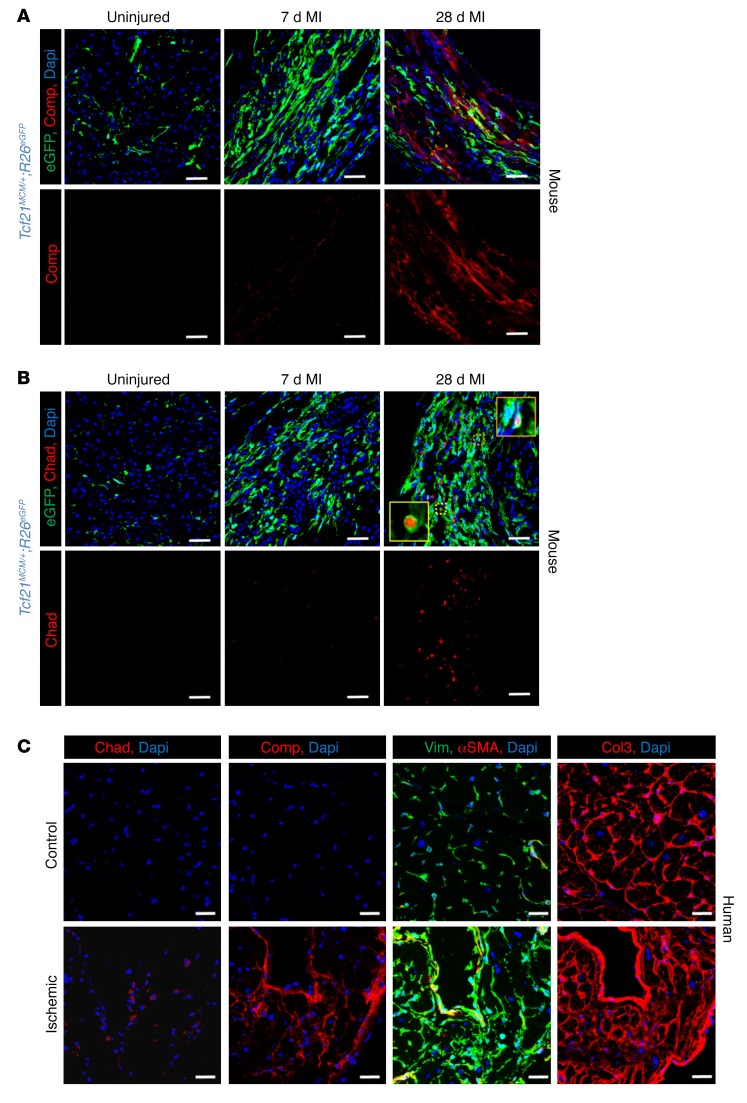
Fibroblasts are a dynamic cell type that achieve selective differentiated states to mediate acute wound healing and long-term tissue remodeling with scarring. With myocardial infarction injury, cardiomyocytes are replaced by secreted extracellular matrix proteins produced by proliferating and differentiating fibroblasts. Here, we employed 3 different mouse lineage-tracing models and stage-specific gene profiling to phenotypically analyze and classify resident cardiac fibroblast dynamics during myocardial infarction injury and stable scar formation. Fibroblasts were activated and highly proliferative, reaching a maximum rate within 2 to 4 days after infarction injury, at which point they expanded 3.5-fold and were maintained long term. By 3 to 7 days, these cells differentiated into myofibroblasts that secreted abundant extracellular matrix proteins and expressed smooth muscle α-actin to structurally support the necrotic area. By 7 to 10 days, myofibroblasts lost proliferative ability and smooth muscle α-actin expression as the collagen-containing extracellular matrix and scar fully matured. However, these same lineage-traced initial fibroblasts persisted within the scar, achieving a new molecular and stable differentiated state referred to as a matrifibrocyte, which was also observed in the scars of human hearts. These cells express common and unique extracellular matrix and tendon genes that are more specialized to support the mature scar.

Keywords: Cardiology; Cardiovascular disease.


Conflict of interest statement

Conflict of interest: The authors have declared that no conflict of interest exists.

Figures

Figure 1
Figure 1. Proliferation of Tcf21 lineage–traced fibroblasts after MI.
(A) Schematic of the Tcf21 genetic locus with a tamoxifen-regulated MerCreMer cDNA cassette inserted into exon 1 (E1).The MerCreMer-containing Tcf21 locus was introduced into R26EGFP mice containing a loxP site–flanked stop cassette upstream of EGFP to allow for Cre-dependent lineage tracing. (B) Experimental scheme whereby Tcf21MCM/+;R26EGFP mice were given tamoxifen for 4 weeks and rested for 1 week before MI surgery. Mice were treated with a single EdU injection at the indicated time points after MI, and hearts were harvested 4 hours after each EdU injection for IHC analysis. (CE) Quantification of EdU+ (white) and Ki67+ (red) Tcf21 lineage–traced (EGFP+) fibroblasts (green) in infarct region (C) and border zone (D) after a single EdU injection at the indicated time points after MI by IHC and representative IHC images. The white bar in C represents a 0 time point. (E) Nuclei are shown with DAPI (blue); these same images are shown in Supplemental Figure 1C in a larger temporal array. (F) Experimental scheme of tamoxifen treatment of Tcf21MCM/+;R26EGFP mice before MI surgery and 7 daily EdU injections during indicated time periods after MI. Hearts were harvested 4 hours after the last EdU injection for IHC analysis. (GI) Quantification of EdU+ (white) and Ki67+ (red) Tcf21 lineage–traced fibroblasts (green) in the infarct region (G) and border zone (H) after 7 daily EdU injections during the indicated time periods after MI by IHC and representative IHC images (I). Nuclei are shown with DAPI (blue). (J) Quantification of Tcf21 lineage–traced fibroblasts in the infarct region at the indicated time points by FACS. Density of cells is presented as the number of cells per mg of infarct tissue. (C, D, G, H, and J) Data are shown as mean ± SD (n = 3). E and I show representative images from 3 separate hearts analyzed. Scale bars: 20 μm.
Figure 2
Figure 2. Differentiation of Tcf21 lineage–traced fibroblasts into myofibroblasts after MI.
(A and B) Quantification of αSMA+ and EdU+ Tcf21 lineage–traced fibroblasts in the MI region (A) and border zone (B) after a single EdU injection at the indicated time points after MI by IHC. (C) Representative IHC images showing αSMA+ (red) and EdU+ (white) Tcf21 lineage–traced (EGFP+) fibroblasts quantified in A and B. Nuclei are shown with DAPI (blue). These same images from C are shown in Supplemental Figure 1D in a larger temporal array. (DF) Quantification of αSMA+ (red) and EdU+ (white) Tcf21 lineage–traced fibroblasts in the MI region (D) and border zone (E) after 7 daily EdU injections during the indicated time periods after MI by IHC and representative IHC images (F). Nuclei are shown with DAPI (blue). (A, B, D and E) Data are shown as mean ± SD (n = 3). C and F show representative images from 3 separate hearts analyzed. Scale bars: 20 μm.
Figure 3
Figure 3. Apoptosis and turnover of Tcf21 lineage–traced fibroblasts after MI.
(A) Experimental scheme of tamoxifen treatment of Tcf21MCM/+;R26EGFP mice before MI. Hearts were harvested at the indicated time points after MI for TUNEL staining. (B) Representative TUNEL staining (red) images from 3 separate hearts analyzed showing apoptotic Tcf21 lineage–traced (EGFP+) fibroblasts after MI. Nuclei are shown with DAPI (blue). The inset shows a higher magnification (×8) image of a TUNEL+ EGFP+ cell. (C) Experimental scheme of tamoxifen treatment of Tcf21MCM/+;R26EGFP mice before MI followed by 7 daily EdU injections during the first week after MI. Hearts were then harvested 4 hours and 28 days after the last EdU injection for IHC analysis. (D and E) Quantification (D) of EdU+ (white) Tcf21 lineage–traced (EGFP+) fibroblasts in the infarcted area at 4 hours and 28 days after the last injection of 7 daily EdU injections. (E) Nuclei are shown with DAPI (blue), and αSMA (red) was stained to show myofibroblast identity. Data are shown as mean ± SD (n = 3 hearts analyzed). Two-tailed t test showed no significance. For E, representative IHC images are shown from 3 separate hearts analyzed. (F) Representative IHC images from 3 separate hearts analyzed showing EdU+ (white) CD31+ endothelial cells (red) versus Tcf21 lineage–traced fibroblasts (EGFP+) in hearts before MI and within infarct region at day 4 and day 10 after MI 4 hours after a single EdU injection. (G) Representative IHC images from 3 hearts analyzed showing EdU+ (white) CD45+ leukocytes (red) versus Tcf21 lineage–traced fibroblasts (EGFP+) in hearts before MI and within infarct region at day 4 and day 10 after MI 4 hours after a single EdU injection. Scale bars: 20 μm.
Figure 4
Figure 4. Lineage tracing of myofibroblasts in Acta2CreERT2;R26EGFP mice.
(A) Schematic of the Acta2 BAC with a tamoxifen-regulated CreERT2 cDNA cassette inserted into exon 1, and mice containing this transgene were crossed with R26EGFP reporter mice containing a loxP site–flanked stop cassette upstream of EGFP to allow for Cre-dependent lineage tracing. (B) Experimental scheme whereby Acta2CreERT2;R26EGFP mice were given tamoxifen through daily i.p. injections from day –1 to day 4 after MI. Mice were treated with a single EdU injection at the indicated time points after MI, and hearts were harvested 4 hours afterward for IHC analysis. (C and D) Representative IHC images from 3 hearts analyzed showing αSMA protein (red) and EdU+ (white) in αSMA lineage–traced (EGFP+) fibroblasts in the infarct region after a single EdU injection at the indicated time points after MI (C) and quantification (D). Nuclei are shown with DAPI (blue). Data are shown as mean ± SD (n = 3). Scale bars: 20 μm. (E) Representative IHC images from 3 separate hearts analyzed showing αSMA lineage–traced (EGFP+) fibroblasts and expression of αSMA protein (red) in the infarct region and border zone at 7 days and 8 weeks after MI. Nuclei are shown with DAPI (blue). Scale bars: 200 μm.
Figure 5
Figure 5. Proliferation potential of Tcf21 lineage–traced fibroblasts residing in stable scar.
(A) Experimental scheme whereby Tcf21MCM/+;R26EGFP mice previously treated with tamoxifen were subjected to MI and then treated with Ang II/PE through osmotic pump 4 weeks after MI. Mice were treated with EdU through daily i.p. injections for 6 days starting at day 2 after pump implantation, and hearts were harvested 4 hours after the last EdU injection for IHC analysis. (B and C) Quantification (B) and representative IHC images from 3 hearts analyzed (C) of EdU+ (white) and Ki67+ (red) Tcf21 lineage–traced (EGFP+) fibroblasts in the infarct region and septum of hearts from Tcf21MCM/+;R26EGFP mice that received treatment as shown in A. Nuclei are shown with DAPI (blue). Scale bars: 20 μm. (D and E) Quantification (D) and representative immunocytochemistry from 3 separate experiments (E) of EdU+ (white) Tcf21 lineage–traced (EGFP+) fibroblasts isolated from uninjured hearts and the infarct region of hearts 4 weeks later. EdU was given for 6 hours with and without TGF-β stimulation. Scale bars: 200 μm. (F) Representative immunocytochemistry images from 3 separate experiments showing αSMA stress fibers (red) in Tcf21 lineage–traced fibroblasts isolated from uninjured hearts and the infarct region of hearts 4 weeks after MI. Cells were also treated with TGF-β for 3 days. Scale bars: 10 μm. (B and D) Data are shown as mean ± SD (n = 3). **P < 0.01, ***P < 0.0001, 2-tailed t test.
Figure 6
Figure 6. Temporal maturation of the scar in the mouse heart.
(A) Representative Picrosirius red staining images of WT heart histological cross-sections taken in bright-field mode or under polarized light for birefringence detection at the indicated time points showing the progression of fibrosis and collagen maturation after MI injury. Scale bars: 1 mm. Representative images are shown from 3 hearts analyzed at each time point. (B) Representative IHC images showing morphological changes in Col3 (red) along with Tcf21 lineage–traced (EGFP+) fibroblasts from the infarct region of hearts from Tcf21MCM/+;R26EGFP mice at indicated time points. Nuclei are shown with DAPI (blue). Scale bars: 20 μm. Representative images are shown from 3 hearts analyzed at each time point.
Figure 7
Figure 7. Model of MI injury–dependent cardiac fibroblast states.
Model showing the different states of cardiac fibroblasts at different post-MI stages. In uninjured heart, cardiac fibroblasts reside within the interstitial space, but after MI injury, they become maximally activated by 2 to 4 days, and they elongate and begin to express αSMA. By days 4 to 7, the myofibroblast differentiated state is maximal, with high levels of αSMA protein in elongated processes within these cells. Finally, these fibroblasts stop proliferating and lose αSMA expression as they further differentiate into the matrifibrocyte by day 10 and onwards within the scar region.
Figure 8
Figure 8. Effect of ECM maturation on αSMA expression in myofibroblasts.
(A and B) Representative IHC images (A) and quantitation (B) of αSMA+ (red) Tcf21 lineage–traced (EGFP+) fibroblasts from the infarct region of hearts from Tcf21MCM/+;R26EGFP mice treated with BAPN or PBS as a control (Cont.). Nuclei are shown with DAPI (blue). Scale bars: 20 μm. Data are shown as mean ± SD (n = 3). ***P < 0.0001, 2-tailed t test. (C) Experimental scheme of tamoxifen treatment of PostnMCM/MCM;R26EGFP and PostnMCM/+;R26EGFP mice from day 2 to day 3 after MI by daily i.p. injections. Hearts were then harvested at 2 weeks after MI. (D) Representative IHC images from 3 separate hearts analyzed for Postn protein expression within the infarct region of hearts from PostnMCM/+;R26EGFP mice versus PostnMCM/MCM;R26EGFP mice 2 weeks after MI. Nuclei are shown with DAPI (blue). Scale bars: 20 μm. Postn lineage–traced cells (EGFP+) cells are also shown. (E) Representative IHC images from 3 separate hearts analyzed showing αSMA+ (red) and Postn lineage–traced (EGFP+) fibroblasts in the infarct region of hearts from PostnMCM/+;R26EGFP mice and PostnMCM/MCM;R26EGFP mice 2 weeks after MI. Nuclei are shown with DAPI (blue). Scale bars: 50 μm.
Figure 9
Figure 9. Gene-expression patterns of fibroblast stages in the MI injured heart.
(A) Heatmap showing approximately 5,000 genes differentially expressed with cluster analysis among quiescent Tcf21 lineage–traced (EGFP+) fibroblasts isolated from the uninjured LV or the MI region 3 days, 7 days, 2 weeks, and 4 weeks after injury. Individual biological replicates are shown. Individual samples were clustered and connected by Transcriptome Analysis Console based on their similarity in gene-expression patterns. (B) Venn diagram showing numbers and overlapping genes that were differentially expressed between Tcf21 lineage–traced (EGFP+) fibroblasts isolated from the uninjured LV versus the other 4 sample groups of isolated fibroblasts from the MI region 3 days, 7 days, 2 weeks, or 4 weeks after injury.
Figure 10
Figure 10. Changes in gene-expression states in the cardiac fibroblast after infarction injury.
(A) Heatmap of selected gene-expression categories and individual genes from Tcf21 lineage–traced fibroblasts isolated from the uninjured heart or the infarct area of hearts 3 days, 7 days, 2 weeks, and 4 weeks after MI (assayed with Affymetrix microarrays). (BI) Bar graphs show mRNA expression levels of selected cell proliferation–related genes (B), cell migration–related genes (C), cytoskeleton-related genes (D), ECM protein genes (E), ECM modification genes (F), bone and cartilage–related genes (G), apoptosis inhibitor genes (H), and fibroblast marker genes (I) in the different sample groups. Data were normalized to quiescent Tcf21 lineage–traced fibroblasts isolated from uninjured hearts. n = 3 (uninjured, 3 d MI, 7 d MI, and 4 wk MI), n = 2 (2 wk MI). Different letters (a, b, c, d, e) above the bars indicate significant differences (P < 0.05) by 1-way ANOVA and Tukey’s post hoc analysis between Tcf21 lineage–traced fibroblasts isolated at different time points in each panel. Bars denoted by the same letter indicate lack of significant difference within that panel, while all bars that have different letters are significantly different from each other.
Figure 11
Figure 11. Representative mouse and human heart IHC of selected proteins underlying the matrifibrocyte.
(A) Representative IHC heart images showing Comp protein expression (red) along with Tcf21 lineage–traced (EGFP+) fibroblasts from uninjured mice or the infarct region 7 and 28 days after MI. Nuclei are shown with DAPI (blue). Scale bars: 20 μm. (B) Representative IHC mouse heart images showing Chad protein expression (red) along with Tcf21 lineage–traced (EGFP+) fibroblasts from uninjured heart or the infarct region 7 and 28 days after MI. Nuclei are shown with DAPI (blue). The insets show higher magnification (×4) of double-positive cell for EGFP and Chad. Scale bars: 20 μm. (C) Representative IHC images showing protein expression of Chad (red), Comp (red), αSMA (red), Col3 (red), or vimentin (Vim, green) on the same or adjacent serial sections of ischemic LV human heart samples with scar and/or uninjured (control). Nuclei are shown with DAPI (blue). n = 3 (ischemic LVAD). n = 1 (healthy control). Scale bars: 20 μm.

Comment in

References

    1. Bagchi RA, Lin J, Wang R, Czubryt MP. Regulation of fibronectin gene expression in cardiac fibroblasts by scleraxis. Cell Tissue Res. 2016;366(2):381–391. doi: 10.1007/s00441-016-2439-1. - DOI - PubMed
    1. Manabe I, Shindo T, Nagai R. Gene expression in fibroblasts and fibrosis: involvement in cardiac hypertrophy. Circ Res. 2002;91(12):1103–1113. doi: 10.1161/01.RES.0000046452.67724.B8. - DOI - PubMed
    1. Chapman D, Weber KT, Eghbali M. Regulation of fibrillar collagen types I and III and basement membrane type IV collagen gene expression in pressure overloaded rat myocardium. Circ Res. 1990;67(4):787–794. doi: 10.1161/01.RES.67.4.787. - DOI - PubMed
    1. Murphy MM, Lawson JA, Mathew SJ, Hutcheson DA, Kardon G. Satellite cells, connective tissue fibroblasts and their interactions are crucial for muscle regeneration. Development. 2011;138(17):3625–3637. doi: 10.1242/dev.064162. - DOI - PMC - PubMed
    1. el-Ghalbzouri A, Gibbs S, Lamme E, Van Blitterswijk CA, Ponec M. Effect of fibroblasts on epidermal regeneration. Br J Dermatol. 2002;147(2):230–243. doi: 10.1046/j.1365-2133.2002.04871.x. - DOI - PubMed

Publication types

Substances