. 2018 Sep;106(9):2448-2462.
doi: 10.1002/jbm.a.36439.

Kidney decellularized extracellular matrix hydrogels: Rheological characterization and human glomerular endothelial cell response to encapsulation

Affiliations

Kidney decellularized extracellular matrix hydrogels: Rheological characterization and human glomerular endothelial cell response to encapsulation

Jimmy Su et al. J Biomed Mater Res A. 2018 Sep.

Abstract

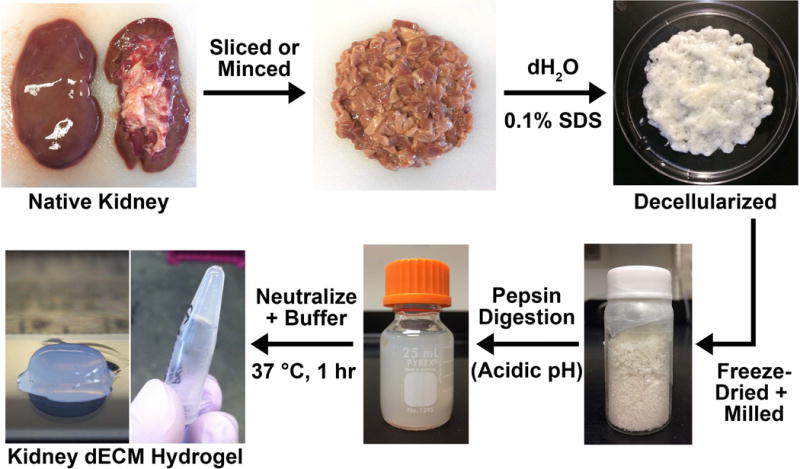
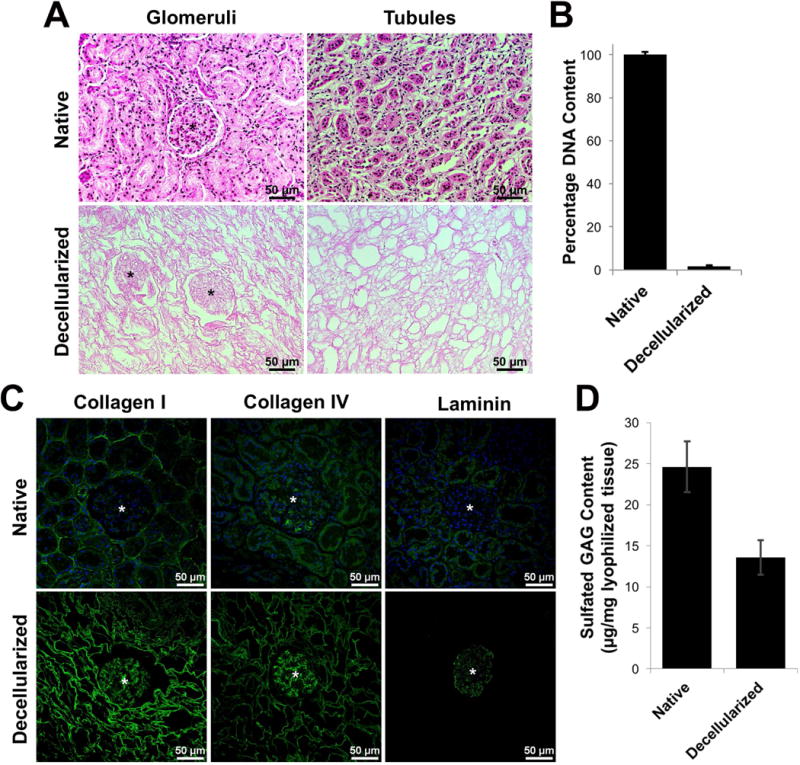
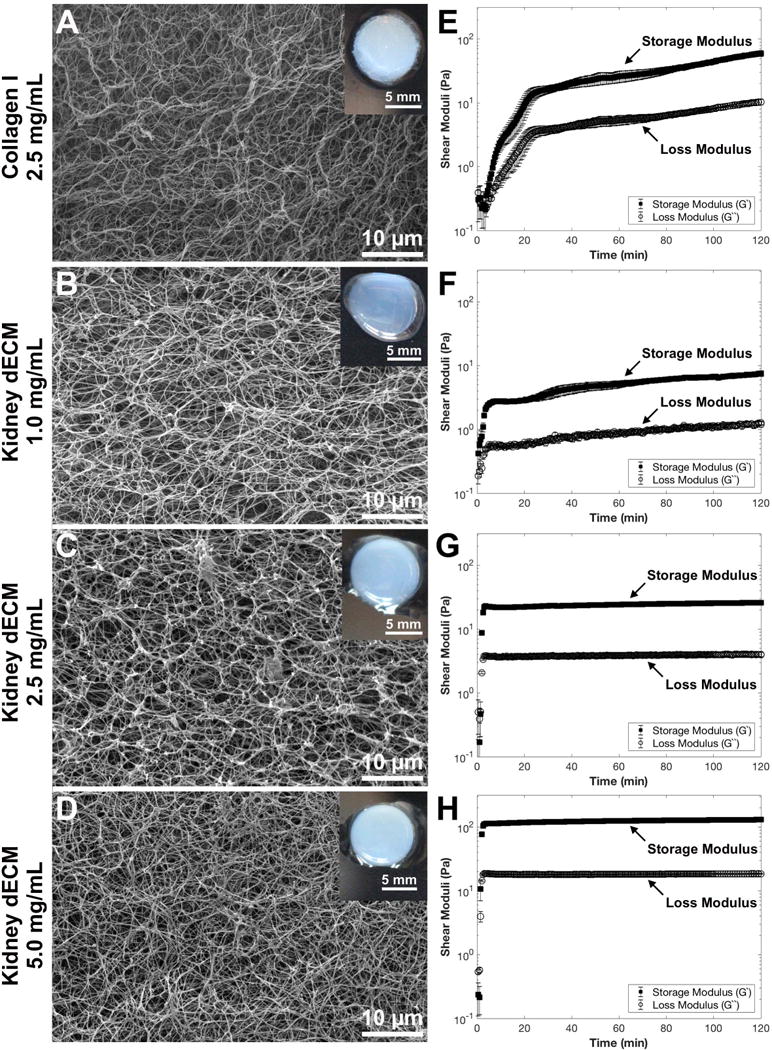
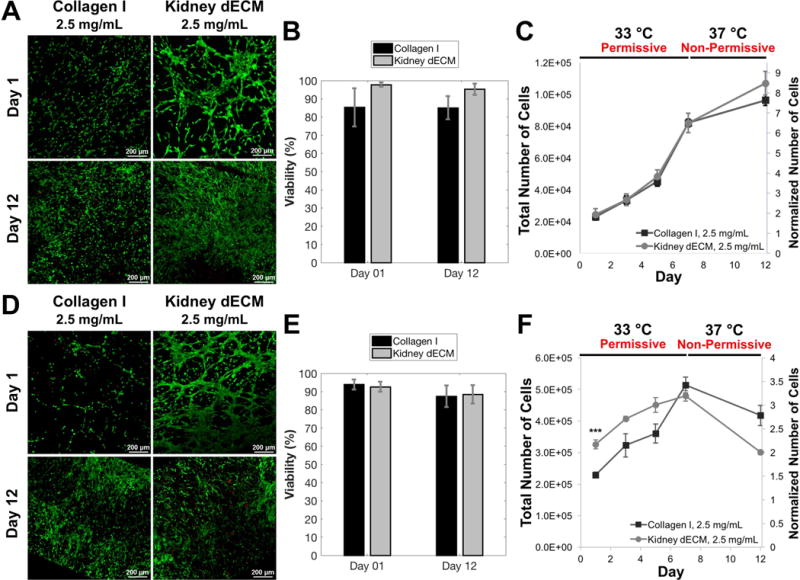
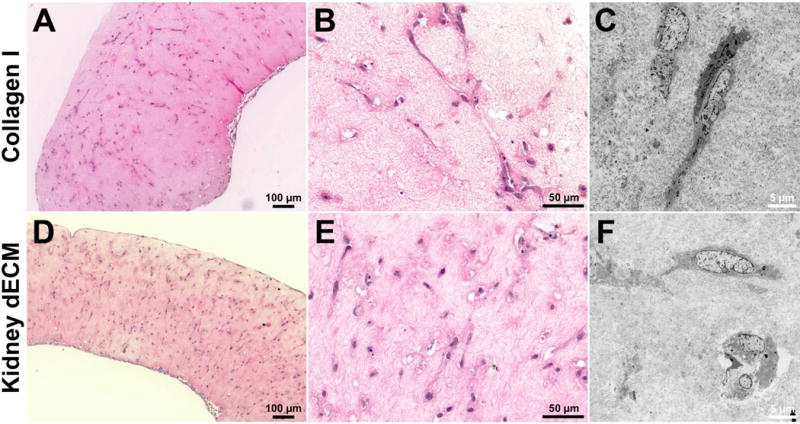
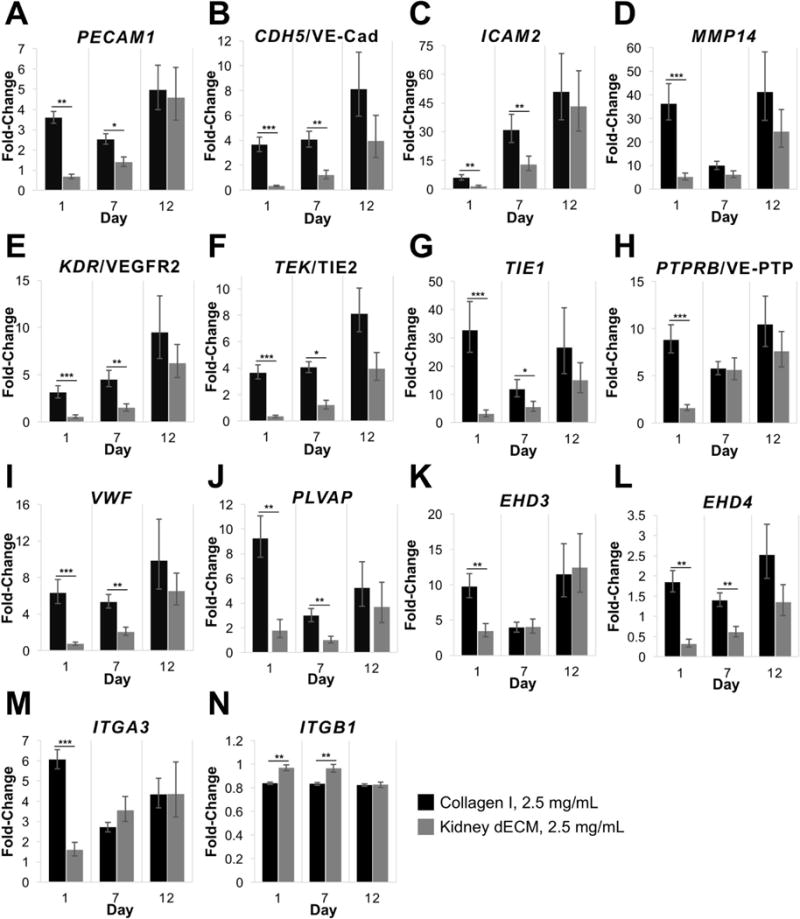
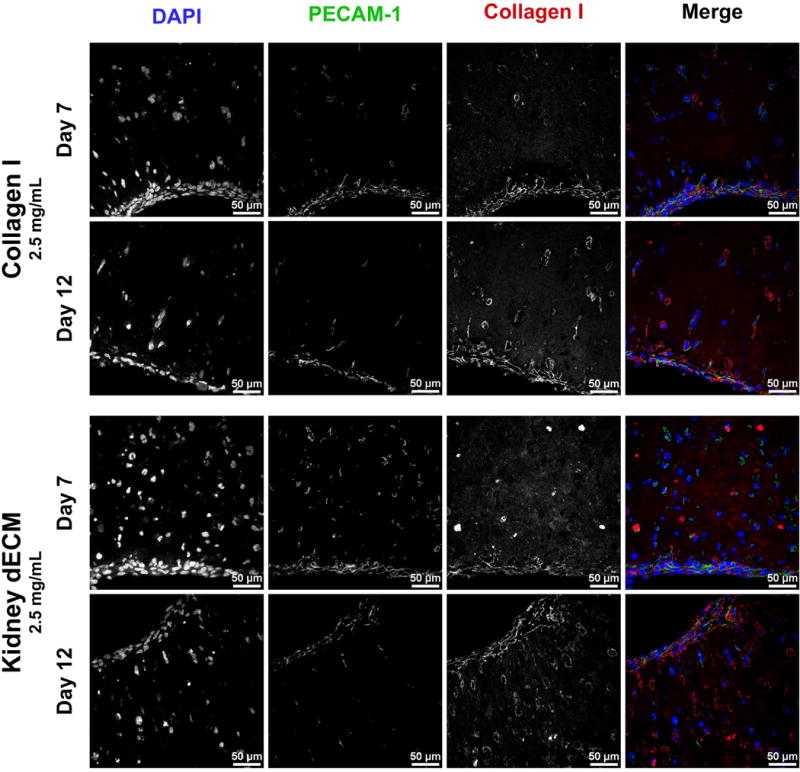
Hydrogels, highly-hydrated crosslinked polymer networks, closely mimic the microenvironment of native extracellular matrix (ECM) and thus present as ideal platforms for three-dimensional cell culture. Hydrogels derived from tissue- and organ-specific decellularized ECM (dECM) may retain bioactive signaling cues from the native tissue or organ that could in turn modulate cell-material interactions and response. In this study, we demonstrate that porcine kidney dECM can be processed to form hydrogels suitable for cell culture and encapsulation studies. Scanning electron micrographs of hydrogels demonstrated a fibrous ultrastructure with interconnected pores, and rheological analysis revealed rapid gelation times with shear moduli dependent upon the protein concentration of the hydrogels. Conditionally-immortalized human glomerular endothelial cells (GEnCs) cultured on top of or encapsulated within hydrogels exhibited high cell viability and proliferation over a one-week culture period. However, gene expression analysis of GEnCs encapsulated within kidney dECM hydrogels revealed significantly lower expression of several relevant genes of interest compared to those encapsulated within hydrogels composed of only purified collagen I. © 2018 Wiley Periodicals, Inc. J Biomed Mater Res Part A: 106A:2448-2462, 2018.

Keywords: decellularized; extracellular matrix (ECM); hydrogel; kidney; tissue engineering.


Conflict of interest statement

Disclosures

The authors declare that they have no conflicts of interest.

Figures

Figure 1
Figure 1
Process to form kidney decellularized extracellular matrix hydrogels. The native kidney is minced into pieces approximately 0.5 cm × 0.5 cm × 0.25 cm in size and treated with 0.1% (w/v) sodium dodecyl sulfate to remove all of the cellular material. The remaining decellularized extracellular matrix is lyophilized and milled into a fine powder before being subjected to a pepsin digestion at acidic pH (0.01 M HCl) to disrupt collagen fibril aggregates and solubilize the material. To form a hydrogel, the pepsin digest is kept on ice, neutralized with 1.0 M NaOH, buffered to pH 7.4, and incubated at 37 °C for about an hour.
Figure 2
Figure 2
Evaluation and characterization of decellularized kidney tissues. (A) Routine hematoxylin and eosin staining of native and decellularized kidney sections demonstrating removal of cellular nuclei (dark spots) and preservation of the ECM architecture, including glomeruli (*) and tubule structures. (B) Quantification of double-stranded DNA content in native and decellularized kidney tissue. DNA content was normalized to the dry weight of each sample, and data is presented as a percentage of native kidney tissue DNA content (n = 3). (C) Immunofluorescence staining of native and decellularized kidney sections demonstrating retention of collagen I, collagen IV, and laminin in decellularized tissues; glomerular structures indicated by (*). (D) Quantification of sulfated glycosaminoglycan content in native and decellularized kidney tissue. sGAG content was normalized to the dry mass of each sample with samples run in triplicate (n = 3).
Figure 3
Figure 3
Scanning electron micrographs, macroscopic images (insets), and rheological characterization of collagen I and kidney dECM hydrogels. SEM and macroscopic images of (A) collagen I hydrogel at 2.5 mg/mL, (B) kidney dECM hydrogel at 1.0 mg/mL, (C) kidney dECM hydrogel at 2.5 mg/mL, and (D) kidney dECM hydrogel at 5.0 mg/mL. Rheological characterization of hydrogel formation over time with measured shear moduli plotted on a logarithmic scale of (E) collagen I hydrogels at 2.5 mg/mL, (F) kidney dECM hydrogels at 1.0 mg/mL, (G) kidney dECM hydrogels at 2.5 mg/mL, and (H) kidney dECM hydrogels at 5.0 mg/mL.
Figure 4
Figure 4
Viability and proliferation of human GEnCs cultured on collagen I hydrogels and kidney dECM hydrogel substrates (A-C) or encapsulated within hydrogels (D-F). (A) Live/dead staining and confocal imaging of GEnCs cultured on collagen I hydrogels or kidney dECM hydrogels at days 1 and 12. (B) Quantification of viability of cells cultured on top of hydrogel substrates presented as the percentage live cells from image analysis. (C) Quantification of cultured GEnC proliferation over twelve days using a Quant-iT PicoGreen dsDNA Assay Kit. Normalized values (right axis) were normalized to the number of cells seeded per sample on day 0. Samples initially seeded with 12,500 cells per sample (50,000 cells/mL). Number of independent measurements, n = 4. (D) Live/dead staining and confocal imaging of GEnCs encapsulated within collagen I hydrogels or kidney dECM hydrogels at days 1 and 12. (E) Quantification of viability of cells encapsulated within hydrogels presented as the percentage live cells from image analysis. (F) Quantification of encapsulated GEnC proliferation over twelve days using a Quant-iT PicoGreen dsDNA Assay Kit. Normalized values (right axis) were normalized to the number of cells encapsulated per sample on day 0. Samples initially seeded with 150,000 cells per sample (1 million cells/mL). Number of independent measurements, n = 4. *** p < 0.005.
Figure 5
Figure 5
H&E and TEM of GEnCs encapsulated within hydrogels after twelve days in culture. (A, B) H&E stained sections and (C) TEM micrograph of GEnCs encapsulated within collagen I hydrogels. (D, E) H&E stained sections and (F) TEM micrograph of GEnCs encapsulated within kidney dECM hydrogels.
Figure 6
Figure 6
Gene expression of GEnCs encapsulated within hydrogels after 1, 7, and 12 days in culture. (A) PECAM1 encoding for platelet endothelial cell adhesion molecule or CD31. (B) CDH5 encoding for cadherin 5 or vascular endothelial cadherin. (C) ICAM2 encoding for intercellular adhesion molecule 2 or CD102. (D) MMP14 encoding for matrix metalloproteinase 14 or MT1-MMP. (E) KDR encoding for kinase insert domain receptor or vascular endothelial growth factor receptor 2. (F) TEK encoding for tyrosine kinase with immunoglobulin-like and EGF-like domains 2 or TIE2. (G) TIE1 encoding for tyrosine kinase with immunoglobulin-like and EGF-like domains 1 or TIE1. (H) PTPRB encoding for receptor-type tyrosine-protein phosphatase beta or VE-PTP. (I) VWF encoding for von Willebrand Factor. (J) PLVAP encoding for plasmalemma vesicle-associated protein. (K) EHD3 encoding for Eps15 homology domain-containing protein 3. (L) EHD4 encoding for EH domain-containing protein 4. (M) ITGA3 encoding for integrin subunit alpha 3. (N) ITGB1 encoding for integrin subunit beta 1. Values are expressed as fold-change in expression normalized to gene expression of GEnCs cultured on tissue culture polystyrene on day 0. Number of independent measurements, n = 4. Statistical significance denoted by: * p < 0.05, ** p < 0.01, and *** p < 0.001.
Figure 7
Figure 7
Immunofluorescence staining for PECAM-1 of GEnCs encapsulated in collagen I hydrogels or kidney dECM hydrogels after 7 or 12 days in culture. Merged images: DAPI (blue), PECAM-1 (green), and collagen type I (red).

References

    1. 2015 Annual Data Report: Epidemiology of Kidney Disease in the United States United States Renal Data System. Bethesda, MD: National Institutes of Diabetes and Digestive and Kidney Disease, National Institutes of Health; 2016.
    1. Jha V, Garcia-Garcia G, Iseki K, Li Z, Naicker S, Plattner B, Saran R, Wang AY-M, Yang C-W. Chronic kidney disease: global dimension and perspectives. The Lancet. 2013;382(9888):260–272. - PubMed
    1. Oxburgh L, Carroll TJ, Cleaver O, Gossett DR, Hoshizaki DK, Hubbell JA, Humphreys BD, Jain S, Jensen J, Kaplan DL. (Re) Building a Kidney. Journal of the American Society of Nephrology. 2017;28(5):1370–1378. - PMC - PubMed
    1. Pampaloni F, Reynaud EG, Stelzer EH. The third dimension bridges the gap between cell culture and live tissue. Nature reviews Molecular cell biology. 2007;8(10):839–845. - PubMed
    1. Antoni D, Burckel H, Josset E, Noel G. Three-dimensional cell culture: a breakthrough in vivo. International journal of molecular sciences. 2015;16(3):5517–5527. - PMC - PubMed

Publication types

MeSH terms