. 2018 Apr 17:7:e29793.
doi: 10.7554/eLife.29793.

Rat anterior cingulate cortex recalls features of remote reward locations after disfavoured reinforcements

Affiliations

Rat anterior cingulate cortex recalls features of remote reward locations after disfavoured reinforcements

Ali Mashhoori et al. Elife. .

Abstract

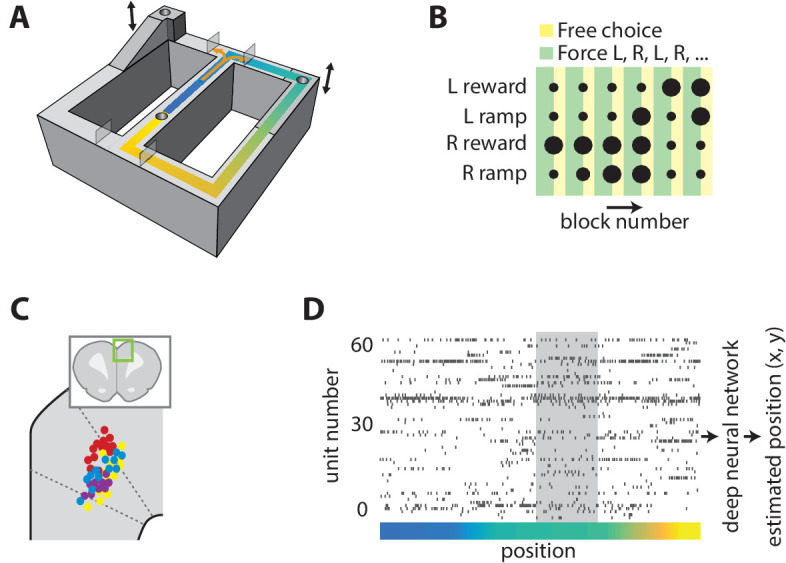
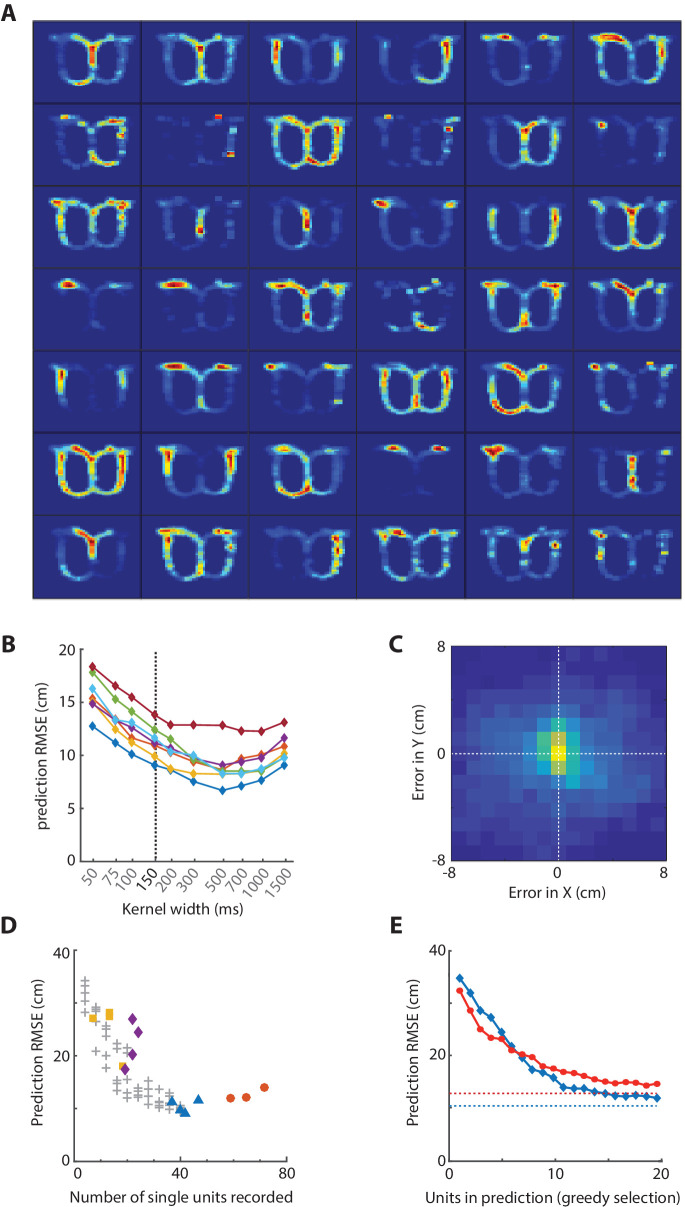
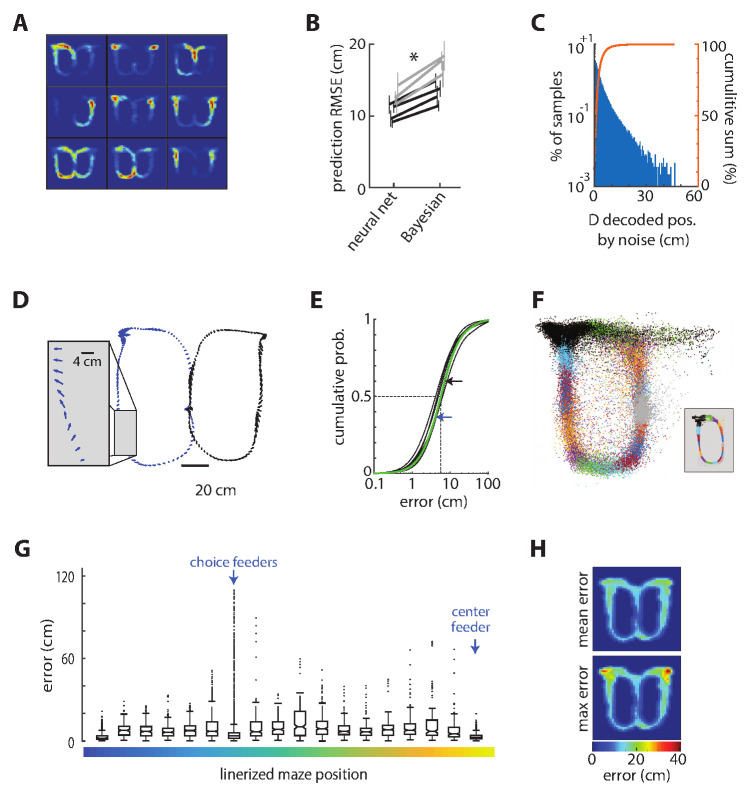
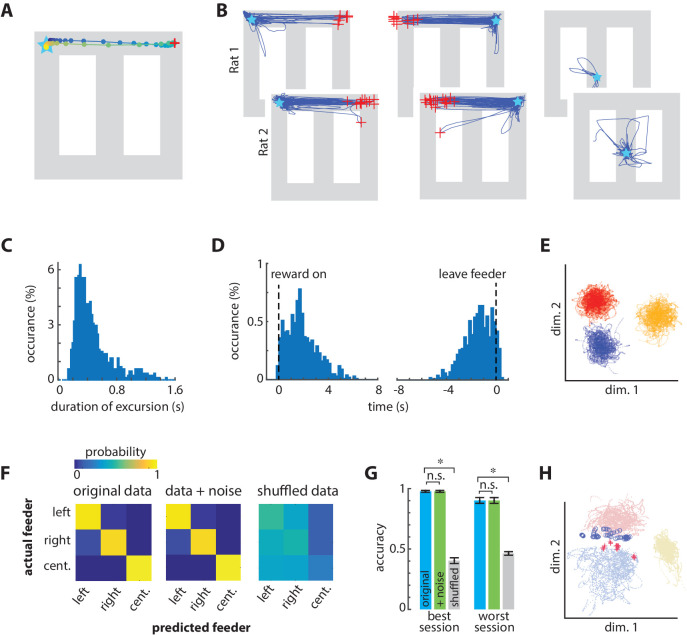
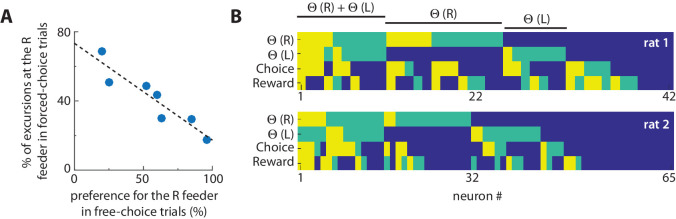
The anterior cingulate cortex (ACC) encodes information supporting mnemonic and cognitive processes. We show here that a rat's position can be decoded with high spatiotemporal resolution from ACC activity. ACC neurons encoded the current state of the animal and task, except for brief excursions that sometimes occurred at target feeders. During excursions, the decoded position became more similar to a remote target feeder than the rat's physical position. Excursions recruited activation of neurons encoding choice and reward, and the likelihood of excursions at a feeder was inversely correlated with feeder preference. These data suggest that the excursion phenomenon was related to evaluating real or fictive choice outcomes, particularly after disfavoured reinforcements. We propose that the multiplexing of position with choice-related information forms a mental model isomorphic with the task space, which can be mentally navigated via excursions to recall multimodal information about the utility of remote locations.

Keywords: choice; cognitive map; decoding; ensemble activity; neural network; neuroscience; prospection; rat.


Conflict of interest statement

AM, SH, BM, DE, AG No competing interests declared

Figures

Figure 1.
Figure 1.. Task and neural recording.
(A) Schematic illustration of the figure-8 track, showing the locations of the feeders (cylindrical depressions), height-adjustable platforms (indicated by arrows), and movable gates (translucent rectangles). (B) Graphical representation of the choice reward-effort utilities (dot size) and choice option (color) structure of one task session. The effort-reward utility of each choice was constant during each block of 16 laps. (C) Illustration of estimated recording locations in the dorsal medial prefrontal cortex (inset), showing that most fell in the ACC. (D) Representative example of simultaneously recorded ACC ensemble activity during one lap of the task. The color indicates the position on the track as coded in panel A, and the grey shaded region is corresponds to the target feeder location.
Figure 1—figure supplement 1.
Figure 1—figure supplement 1.. Spatial attributes of ACC unit firing and decoding error.
(A) Maps of the spatial attributes of neural firing for each of 42 simultaneously recorded neurons in the ACC. Red indicates highest likelihood of unit firing. (B) Prediction error versus the width of the smoothing kernel for all seven sessions analyzed. The dashed line indicates the width used for decoding analyses in Figure 2. (C) Histogram of the prediction errors in Cartesian coordinates for one representative session. (D) Prediction error (RMSE) as a function of the number of qualified units recorded for several sessions from each animal (symbols and colors). The prediction error increased with fewer units. To test if the poor decoding performance for some subjects was due to the low number of recorded units, we tested if downsampling the number units from another animal with 40 units would result in similar poor performance. The prediction error increased super-linearly as the downsampling was increased (grey ‘+’) and is in-line with the poor predictions from the two animals with few units. (E) The prediction error achieved by using the most informative units, as determined by a greedy selection process for the two animals with the most units. Colors correspond to those in panel D.
Figure 2.
Figure 2.. Decoding position from ensemble ACC activity.
(A) The spatial selectivity of the nine most informative ACC cells for decoding position in one session chosen by the decoding network. Spike density on the track is coded by color, from blue to red. The units are rank ordered by importance from top left to bottom right. (B) The root mean squared error (RMSE) of the position decoded from the ACC activity as compared to the actual position of the rat for each session (line) and rat (shade), showing that the deep artificial neural network generates lower prediction error than does a Bayesian decoder for each of the seven sessions tested. These session-averaged errors are inflated by occasional large errors around the reward zones, as described below. Error bars show standard deviation of 20 randomly selected training and test sets for each session and method. (C) The distribution of changes in decoded position by noise. (D) Error vectors for two representative laps of the task. The arrows indicate the magnitude and direction of the decoding error every 50 ms. (E) Cumulative probabilities of the prediction error magnitude for the seven sessions. The dotted lines indicate the median, and the arrows indicate the median error for the left (blue) and right (black) laps session shown in panel C (green curve). (F) Decoded position for test data from one session, color coded by the actual position (inset) (G) The error computed every 50 ms in one representative session, represented as a box plot according to track position as shown in Figure 1. The box plot shows the median (horizontal lines in boxes), 95% confidence intervals (notches), first and third quartiles (boxes ends), and outliers (dots). There are a disproportionate number of outliers in the bin corresponding to the target feeder locations, but the median prediction accuracy is as good at these feeders as anywhere else on the track. (H) The mean (top) and maximal (bottom) prediction error for discretized positions on the track, showing that the very large errors occurred exclusively at the location of the target feeders. These show mean of means computed from all sessions.
Figure 3.
Figure 3.. Excursions of encoded position sometimes shift to the alternate choice feeder.
(A) Example of one excursion episode. The decoded position is indicated by circles plotted every 20 ms. The excursion sweeps from the actual position of the rat (star) to the right-side feeder, and then returns. The red ‘+’ indicates the maximal prediction error. (B) All excursions from the three feeders in the test set from one session in each rat. The red ‘+’ indicate the maximum error distance from the occupied feeder of at least 70 cm. The excursions from the right/left target feeders generate a trajectory to the alternate target feeder location. (C) Frequency distribution of excursion duration from all sessions. (D) Timing of excursion onset aligned to feeder activation or feeder zone exit, showing that excursions occur predominantly between these events. (E) Neural activity is distinct at the three feeder zones, as shown here by linear discriminant analysis of the smoothed neural data. Dots are the smoothed and binned neural patterns at feeders in the absence of excursions, and each color indicates data from one feeder (center feeder is yellow). (F) Confusion matrices for identifying the three feeders based on neural activity. Shifting each spike time by a random value (indicated as +noise) had little effect on the ability to correctly identify the feeders, whereas fully shuffling the inter spike intervals eliminated discriminability. (G) The prediction accuracy of classifying feeders for the best and worst sessions. Data in panels F and G include excursion events, which degrade performance. Asterisks indicate significantly different means with a p<0.001. (H) PCA of activation in the middle layer of the spatial decoding network for non-excursion (dots) and excursion (+and o) patterns at target feeders (blue, red) and center feeder (yellow).
Figure 4.
Figure 4.. Excursions are more likely at non-preferred feeders, and encode choice-reward information.
(A) The relationship between excursions frequency and feeder preference. Each dot is the session-averaged occurrence of excursion events at the right-hand (R) target feeder (as % of all events) during forced-selection trials, plotted against the revealed preference for that same feeder computed by the choice bias to the right-hand feeder in free selection trials (% of all choices). The negative correlation reveals that the excursion phenomenon is more likely to occur at disfavored feeders. (B) Encoding of information related to excursion, choice, and reward among neurons. The relative information of each neuron for discriminating excursions at the left target feeder (Θ(L)), excursions at the right target feeder (Θ(R)), the feeder choice, and the reward level. The level of information was determined by the frequency it was used by a neural network to discriminate this information, and is categorized as very informative (yellow), somewhat informative (green), or uninformative (blue). This analysis shows that some cells involved in excursions also encode information about choice and/or reward.
Author response image 1.
Author response image 2.

References

    1. Alexander WH, Brown JW. Medial prefrontal cortex as an action-outcome predictor. Nature Neuroscience. 2011;14:1338–1344. doi: 10.1038/nn.2921. - DOI - PMC - PubMed
    1. Amiez C, Joseph JP, Procyk E. Reward encoding in the monkey anterior cingulate cortex. Cerebral Cortex. 2006;16:1040–1055. doi: 10.1093/cercor/bhj046. - DOI - PMC - PubMed
    1. Barker GR, Bird F, Alexander V, Warburton EC. Recognition memory for objects, place, and temporal order: a disconnection analysis of the role of the medial prefrontal cortex and perirhinal cortex. Journal of Neuroscience. 2007;27:2948–2957. doi: 10.1523/JNEUROSCI.5289-06.2007. - DOI - PMC - PubMed
    1. Bechara A, Damasio AR. The somatic marker hypothesis: A neural theory of economic decision. Games and Economic Behavior. 2005;52:336–372. doi: 10.1016/j.geb.2004.06.010. - DOI
    1. Birrell JM, Brown VJ. Medial frontal cortex mediates perceptual attentional set shifting in the rat. The Journal of Neuroscience. 2000;20:4320–4324. doi: 10.1523/JNEUROSCI.20-11-04320.2000. - DOI - PMC - PubMed

Publication types