. 2018 Jul 2;128(7):3053-3070.
doi: 10.1172/JCI89632. Epub 2018 Jun 11.

Pharmacological induction of hypoxia-inducible transcription factor ARNT attenuates chronic kidney failure

Affiliations

Pharmacological induction of hypoxia-inducible transcription factor ARNT attenuates chronic kidney failure

Björn Tampe et al. J Clin Invest. .

Abstract

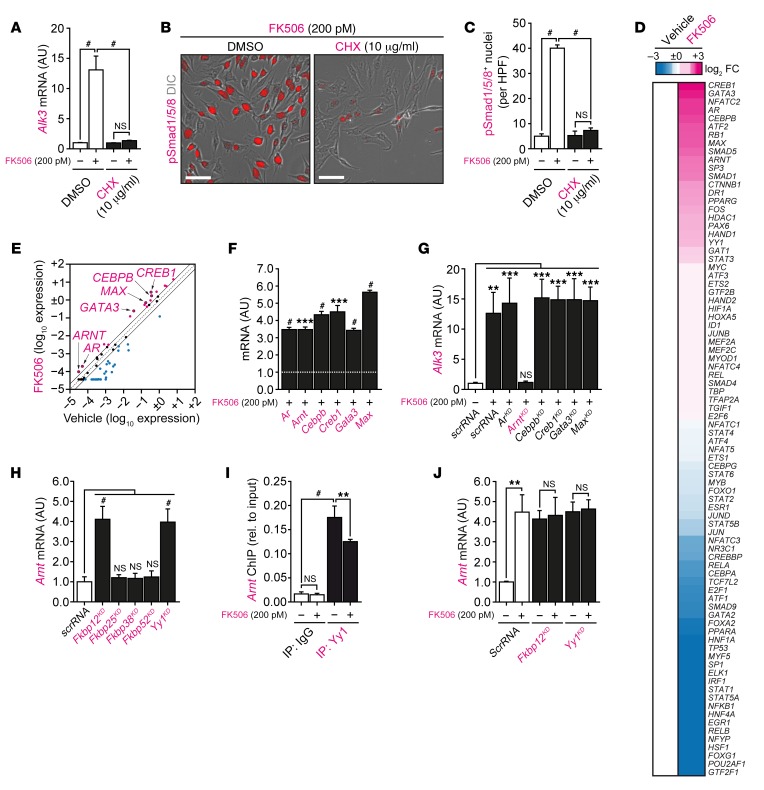
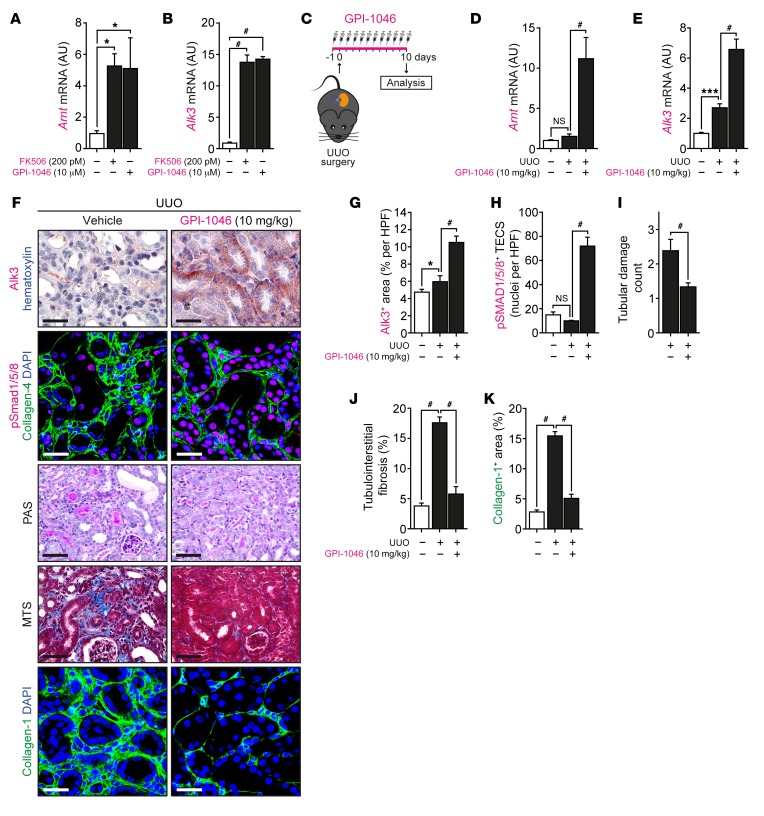
Progression of chronic kidney disease associated with progressive fibrosis and impaired tubular epithelial regeneration is still an unmet biomedical challenge because, once chronic lesions have manifested, no effective therapies are available as of yet for clinical use. Prompted by various studies across multiple organs demonstrating that preconditioning regimens to induce endogenous regenerative mechanisms protect various organs from later incurring acute injuries, we here aimed to gain insights into the molecular mechanisms underlying successful protection and to explore whether such pathways could be utilized to inhibit progression of chronic organ injury. We identified a protective mechanism controlled by the transcription factor ARNT that effectively inhibits progression of chronic kidney injury by transcriptional induction of ALK3, the principal mediator of antifibrotic and proregenerative bone morphogenetic protein-signaling (BMP-signaling) responses. We further report that ARNT expression itself is controlled by the FKBP12/YY1 transcriptional repressor complex and that disruption of such FKBP12/YY1 complexes by picomolar FK506 at subimmunosuppressive doses increases ARNT expression, subsequently leading to homodimeric ARNT-induced ALK3 transcription. Direct targeting of FKBP12/YY1 with in vivo morpholino approaches or small molecule inhibitors, including GPI-1046, was equally effective for inducing ARNT expression, with subsequent activation of ALK3-dependent canonical BMP-signaling responses and attenuated chronic organ failure in models of chronic kidney disease, and also cardiac and liver injuries. In summary, we report an organ-protective mechanism that can be pharmacologically modulated by immunophilin ligands FK506 and GPI-1046 or therapeutically targeted by in vivo morpholino approaches.

Keywords: Chronic kidney disease; Nephrology.


Conflict of interest statement

Conflict of interest: The authors have declared that no conflict of interest exists.

Figures

Figure 1
Figure 1. Low-dose FK506 protects the kidney from chronic organ injury.
(A) Mice were challenged with UUO and treated with either vehicle buffer, FK506 (0.02, 0.075, 0.2, and 5.0 mg/kg orally per day, respectively), or CsA (10 mg/kg orally per day) starting 1 day before surgery. (B) The panels show representative photomicrographs of kidney sections stained with periodic acid-Schiff (PAS) and sections immunolabeled with primary antibodies against collagen-1. Scale bars: 50 μm (PAS, MTS); 25 μm (collagen-1). MTS, Masson’s trichrome stain. (C) Tubular damage at day 10 after UUO was semiquantitatively scored using PAS-stained kidney sections. 0, healthy; 1, mild; 2, moderate; 3, severe. n = 6/group. Data are presented as mean ± SD. ***P < 0.001; #P < 0.0001, 1-way ANOVA with Bonferroni’s post hoc analysis. (D) Graph summarizes average means of relative tubulointerstitial fibrosis 3, 7, and 10 days after UUO. n = 6/group. Data are presented as mean ± SD. #P < 0.0001, 1-way ANOVA with Bonferroni’s post hoc analysis. (E) In mice receiving FK506, areas positive for collagen-1 were assessed. n = 6/group. Data are presented as mean ± SD. #P < 0.0001, 1-way ANOVA with Bonferroni’s post hoc analysis. (F) FK506 concentrations were measured in whole blood samples of UUO mice receiving either vehicle buffer or FK506 (0.02, 0.075, 0.2 mg/kg orally per day, respectively) using colorimetric ELISA measurements compared with standards. n = 6/group. Data are presented as aligned dot plots with means.
Figure 2
Figure 2. FK506-mediated renoprotection depends on ALK3-dependent signaling responses.
(A and B) Mice were challenged with UUO and treated with either vehicle buffer or indicated concentrations of FK506 or CsA starting 1 day prior to surgery. Analysis was performed by qRT-PCR 10 days after UUO. Bar graphs reflect relative mRNA expression levels of type I BMP receptors Alk3 and Alk6. n = 3/group. Data are presented as mean ± SD. **P < 0.01; #P < 0.0001, 1-way ANOVA with Bonferroni’s post hoc analysis. (CF) Analysis was performed by immunoblotting of total kidney lysates and immunostaining. Type I BMP receptor Alk3 and p-Smad1/5/8 were assessed. Scale bars: 25 μm. n = 6/group. Data are presented as mean ± SD. **P < 0.01; #P < 0.0001, 1-way ANOVA with Bonferroni’s post hoc analysis. See complete unedited blots in the supplemental material. (GI) Mice were challenged with UUO and treated with either vehicle buffer or low-dose FK506 (0.2 mg/kg orally per day) when specifically canonical p-Smad1/5/8–dependent ALK3 signaling transduction was pharmacologically blocked with small molecule LDN (3 mg/kg intraperitoneally per day). Panels show representative photomicrographs of sections immunolabeled with primary antibodies against p-Smad1/5/8 and MTS-stained fibrotic kidney sections. Scale bars: 25 μm (p-Smad1/5/8); 50 μm (MTS). n = 6/group. Data are presented as mean ± SD. *P < 0.05; #P < 0.0001, 1-way ANOVA with Bonferroni’s post hoc analysis.
Figure 3
Figure 3. FK506 disrupts an FKBP12/YY1 transcriptional repressor complex.
(A) TECs were exposed to vehicle, indicated concentrations of FK506 (0.02, 0.2, 2, 20, 200 nM, respectively), or equimolar CsA (10 nM). mRNA expression levels of Alk3 were analyzed by qRT-PCR. n = 3 independent experiments. Data are presented as mean ± SD. ***P < 0.001; #P < 0.0001, 1-way ANOVA with Bonferroni’s post hoc analysis. (B and C) Representative photomicrographs of p-Smad1/5/8 complex (p-Smad1/5/8) immunostainings overlayed with differential interference contrast (DIC) are shown. Scale bars: 25 μm. n = 3 independent experiments. Data are presented as mean ± SD. #P < 0.0001, 1-way ANOVA with Bonferroni’s post hoc analysis. (D) Alk3 mRNA expression levels in TECs were analyzed by qRT-PCR after siRNA-mediated knockdown of Fkbp12 (Fkbp12KD), Fkbp25 (Fkbp25KD), Fkbp38 (Fkbp38KD), or Fkbp56 (Fkbp56KD. n = 3 independent experiments. Data are presented as mean ± SD. #P < 0.001, 1-way ANOVA with Bonferroni’s post hoc analysis. (E) As analyzed by coimmunoprecipitation after Alk3 pulldown (IP: Alk3), direct interaction between Fkbp12 and Alk3 was assessed. (F) As analyzed by coimmunoprecipitation after Yy1 pulldown (IP: Yy1), direct interaction between Yy1 and Fkbp12 was assessed. See complete unedited blots in the supplemental material. (G) Alk3 mRNA expression levels were assessed by qRT-PCR after knockdown of either Yy1 (Yy1KD) or Fkbp12 (Fkbp12KD) and exposure to FK506. n = 3 independent experiments. Data are presented as mean ± SD. ***P < 0.001, Student’s t test. (H and I) Representative photomicrographs of p-Smad1/5/8 immunostainings overlayed with DIC are shown. Scale bars: 25 μm. n = 3 independent experiments. Data are presented as mean ± SD. ***P < 0.001, Student’s t test.
Figure 4
Figure 4. FK506-mediated protection is dependent on presence and modulation of YY1 signaling in TECs.
(A) Mice conditionally depleted for YY1 in TECs (γGTcre+;Yy1fl/fl) and corresponding littermate controls (γGTcre–;Yy1fl/fl) were challenged with UUO and treated with either vehicle buffer or FK506 (0.2 mg/kg orally per day) starting 1 day prior to surgery. (B) Alk3 mRNA expression levels were analyzed by qRT-PCR. n = 3/group. Data are presented as mean ± SD. ***P < 0.001; #P < 0.0001, 1-way ANOVA with Bonferroni’s post hoc analysis. (CG) Representative photomicrographs of immunostainings for Alk3, PAS-stained fibrotic kidney sections, MTS, and collagen-1 in mice challenged with UUO are shown. Scale bars: 25 μm (Alk3); 50 μm (PAS); 50 μm (MTS); 25 μm (collagen-1). n = 3/group. Data are presented as mean ± SD. *P < 0.05; **P < 0.01; ***P < 0.001; #P < 0.0001, 1-way ANOVA with Bonferroni’s post hoc analysis.
Figure 5
Figure 5. ARNT causally links disruption of FKBP12/YY1 complexes to enhanced ALK3 transcription.
(A) TECs were exposed to CHX 1 hour prior to FK506 incubation. Alk3 mRNA expression was assessed by qRT-PCR. n = 3 independent experiments. Data are presented as mean ± SD. #P < 0.001, 1-way ANOVA with Bonferroni’s post hoc analysis. (B and C) Immunostaining of p-Smad1/5/8 overlayed with DIC. Scale bars: 25 μm. n = 3 independent experiments. Data are presented as mean ± SD. #P < 0.0001, 1-way ANOVA with Bonferroni’s post hoc analysis. (D and E) FK506-mediated transcriptional network alterations; log2 fold changes (log2 FC) are shown by heatmap. (F) Validation by qRT-PCR upon FK506 exposure. n = 3 independent experiments. Data are presented as mean ± SD. ***P < 0.001; #P < 0.0001, Student’s t test in comparison with DMSO-treated control cells. (G) Alk3 mRNA levels were analyzed by qRT-PCR. n = 3 independent experiments. Data are presented as mean ± SD. **P < 0.01; ***P < 0.001, 1-way ANOVA with Bonferroni’s post hoc analysis. (H) Arnt mRNA expression levels, as analyzed by qRT-PCR, are shown. n = 3 independent experiments. Data are presented as mean ± SD. #P < 0.0001, 1-way ANOVA with Bonferroni’s post hoc analysis. (I) Binding of Yy1 to the Arnt proximal promoter was analyzed by ChIP after Yy1 pulldown (IP: Yy1). n = 3 technical replicates. Data are presented as mean ± SD. **P < 0.01; #P < 0.0001, 1-way ANOVA with Bonferroni’s post hoc analysis. (J) Arnt mRNA expression levels, as assessed by qRT-PCR, are shown. n = 3 independent experiments. Data are presented as mean ± SD. **P < 0.01, Student’s t test.
Figure 6
Figure 6. ARNT targets a palindromic E-box motif specific for ARNT homodimers required for ALK3 transcription.
(A) Alk3 mRNA was assessed by qRT-PCR after depletion of Arnt (ArntKD). n = 3 independent experiments. Data are presented as mean ± SD. #P < 0.0001, 1-way ANOVA with Bonferroni’s post hoc analysis. (B) Alk3 mRNA expression levels after Arnt overexpression (Arntoe) are shown. n = 3 independent experiments. Data are presented as mean ± SD. #P < 0.0001, Student’s t test. (C and D) Impact of FK506 on hypoxic signaling and drug metabolism. (EG) Analysis was performed by coimmunoprecipitation using antibodies against Arnt (IP: Arnt), Arnt/Hif1α, and Arnt/Ahr. (H and I) Efficacy of FK506 or Arnt overexpression in inducing Alk3 mRNA expression levels in cultured TECs depleted for HIF1α (Hif1aKD) or AHR (AhrKD). n = 3 independent experiments. Data are presented as mean ± SD. ***P < 0.001, 1-way ANOVA with Bonferroni’s post hoc analysis. (J and K) Analysis by coimmunoprecipitation. Homodimer formation was assessed in cultured TECs after EGFP-tagged (ArntEGFP) and myc-tagged (Arntmyc) ARNT overexpression and pulldown of Arnt-EGFP (IP: EGFP) or Arnt-myc (IP: myc). (L) Dimer formation of Arnt/Arnt, Arnt/Hif1α, Arnt/Hif2α and Arnt/Ahr was assessed by native gel electrophoresis. See complete unedited blots in the supplemental material. (M) Binding of Arnt to the Alk3 proximal promoter was analyzed by ChIP and subsequent target PCR after Arnt pulldown (IP: Arnt). n = 3 technical replicates. Data are presented as mean ± SD. **P < 0.01; #P < 0.0001, 1-way ANOVA with Bonferroni’s post hoc analysis. (N) Analysis was performed by reporter assays. Alk3 proximal promoter activity was assessed in the presence (Alk3WT) or absence (Alk3mut, CACGTG to TATATA) of the palindromic E-box motif. n = 5 independent experiments. Data are presented as mean ± SD. *P < 0.05, Student’s t test.
Figure 7
Figure 7. Evidence for Arnt homodimer formation in mice treated with FK506.
(A and B) Representative kidney sections of γGTcre+;Yy1fl/fl and γGTcre–;Yy1fl/fl control mice immunolabeled with primary antibodies against Arnt are shown. n = 3/group. Data are presented as mean ± SD. **P < 0.01; ***P < 0.001, 1-way ANOVA with Bonferroni’s post hoc analysis. (CE) Arnt protein levels were analyzed by immunoblotting and immunostaining. Scale bars: 25 μm. n = 6/group. Data are presented as mean ± SD. ***P < 0.001; #P < 0.0001, 1-way ANOVA with Bonferroni’s post hoc analysis. (F) Dimer formation of Arnt/Arnt, Arnt/Hif1α, Arnt/Hif2α, and Arnt/Ahr in total kidney lysates was assessed by native gel electrophoresis after Arnt pulldown. See complete unedited blots in the supplemental material.
Figure 8
Figure 8. Selective targeting of FKBP12/YY1 effectively modulates protective ARNT within chronically injured kidneys.
(AD) Mice were treated daily with intraperitoneal administration of either control VMOs or VMOs targeting the translational start site of Fkbp12 (Fkbp12-VMO), Yy1 (Yy1-VMO), or Arnt (Arnt-VMO) starting 2 days prior to surgery and were orally treated with either vehicle buffer or FK506 (0.2 mg/kg orally per day) starting 1 day prior to surgery. Representative photomicrographs of kidney sections labeled for Arnt, MTS, and collagen-1 are shown. Scale bars: 25 μm (Arnt, collagen-1); 50 μm (MTS). n = 6/group. Data are presented as mean ± SD. #P < 0.0001, 1-way ANOVA with Bonferroni’s post hoc analysis.
Figure 9
Figure 9. Selective targeting of FKBP12 by GPI-1046 effectively protects from chronic renal failure.
(A and B) TECs were exposed to vehicle, FK506 (200 pM), or GPI-1046 (10 μM), and relative Arnt and Alk3 mRNA expression levels were analyzed by qRT-PCR. n = 3 independent experiments. Data are presented as mean ± SD. *P < 0.05; #P < 0.0001, 1-way ANOVA with Bonferroni’s post hoc analysis. (C) Mice were challenged with UUO and treated with either vehicle buffer or GPI-1046 (10 mg/kg subcutaneously per day) starting 1 day prior to surgery. (D and E) Analysis was performed by qRT-PCR 10 days after UUO. Intrarenal Arnt and Alk3 mRNA expression levels are shown. n = 4/group. Data are presented as mean ± SD. ***P < 0.001; #P < 0.0001, 1-way ANOVA with Bonferroni’s post hoc analysis. (FK) Representative photomicrographs of immunostaining for Alk3, p-Smad1/5/8, PAS-stained fibrotic kidney sections, MTS, and collagen-1 are shown. Scale bars: 25 μm (Alk3, p-Smad1/5/8, collagen-1); 50 μm (PAS, MTS). n = 6/group. Data are presented as mean ± SD. *P < 0.05, #P < 0.0001, 1-way ANOVA with Bonferroni’s post hoc analysis.
Figure 10
Figure 10. Selective targeting of FKBP12 by GPI-1046 protects from already established fibrotic lesions.
(A) Mice were challenged with UUO and administered either vehicle buffer, FK506 (0.2 mg(kg orally per day), or GPI-1046 (30 mg/kg orally per day) starting 3 days after UUO surgery. (B and C) Analysis was performed by qRT-PCR. Intrarenal Arnt and Alk3 mRNA expression levels were assessed. n = 4/group. Data are presented as mean ± SD. *P < 0.05, #P < 0.0001, 1-way ANOVA with Bonferroni’s post hoc analysis. (DH) Representative photomicrographs of immunostainings for Alk3, PAS-stained fibrotic kidney sections, MTS, and collagen-1 are shown. Scale bars: 25 μm (Alk3, collagen-1); 50 μm (PAS, MTS). n = 6/group. Data are presented as mean ± SD. **P < 0.01; ***P < 0.001; #P < 0.0001, 1-way ANOVA with Bonferroni’s post hoc analysis.
Figure 11
Figure 11. Pharmacological modulation of an FKBP12/YY1/ARNT/ALK3 signaling axis protects from chronic heart failure.
(A and B) Analysis was performed by qRT-PCR. Arnt mRNA expression levels are shown in response to FK506 (0.2 mg/kg orally per day) or GPI-1046 (30 mg/kg orally per day). n = 3/group. Data are presented as mean ± SD. *P < 0.05; **P < 0.01; ***P < 0.001; #P < 0.0001, 1-way ANOVA with Bonferroni’s post hoc analysis in comparison with vehicle-treated control mice. (C) Mice were challenged with AT II delivered by osmotic minipumps. Vehicle buffer or GPI-1046 (10 mg/kg subcutaneously per day) was administered starting 1 day prior to AT II administration. (DI) Representative photomicrographs of immunostainings for Alk3, p-Smad1/5/8, MTS, collagen-1, and αSMA in mice challenged with AT II are shown. Scale bars: 25 μm (Alk3, p-Smad1/5/8, collagen-1, αSMA); 50 μm (MTS). n = 6/group. Data are presented as mean ± SD. #P < 0.0001, 1-way ANOVA with Bonferroni’s post hoc analysis. (J and K) Arnt and Alk3 mRNA expression levels were analyzed by qRT-PCR. n = 4/group. Data are presented as mean ± SD. #P < 0.0001, 1-way ANOVA with Bonferroni’s post hoc analysis.
Figure 12
Figure 12. Pharmacological modulation of an FKBP12/YY1/ARNT/ALK3 signaling axis protects from chronic liver failure.
(A) Mice were challenged with intraperitoneal injections of CCl4. Vehicle buffer or GPI-1046 (10 mg/kg subcutaneously per day) was administered starting at 1 day prior to starting CCL4 injections. (BH) Representative photomicrographs of immunostainings for Alk3, p-Smad1/5/8, MTS-stained fibrotic kidney sections, Sirius red, collagen-1, and αSMA in mice challenged with CCl4 are shown. Scale bars: 25 μm (Alk3, p-Smad1/5/8, collagen-1, αSMA); 50 μm (MTS, Sirius red). n = 5–7/group. Data are presented as mean ± SD. **P < 0.01; ***P < 0.001; #P < 0.0001, 1-way ANOVA with Bonferroni’s post hoc analysis.
Figure 13
Figure 13. An FKBP12/YY1/ARNT signaling axis translates to humans.
(A) Human TEC cultures were exposed to vehicle or indicated concentrations of FK506. ARNT mRNA expression was analyzed by qRT-PCR (n = 3 independent experiments). (B) Analysis was performed by SDS-PAGE and subsequent immunoblotting. ALK3 was assessed in response to FK506. See complete unedited blots in the supplemental material. (CH) In a small cohort of kidney transplant recipients with comparable histological patterns and immunosuppressive regimens based on CsA or FK506, kidney sections were immunolabeled with the following primary antibodies: FKBP12, YY1, ARNT, ALK3, and p-Smad1/5/8. Scale bars: 25 μm (FKBP12, YY1, p-Smad1/5/8); 50 μm (ARNT); 100 μm (ALK3). Measurements were done in 10 visual fields. Data are presented as mean ± SD. ***P < 0.001; #P < 0.0001, 1-way ANOVA with Bonferroni’s post hoc analysis. (G and H) ARNT and ALK3 mRNA expression levels were assessed by qRT-PCR. Measurements were done in technical triplicates. Data are presented as mean ± SD. **P < 0.01; #P < 0.0001, 1-way ANOVA with Bonferroni’s post hoc analysis.

Comment in

References

    1. Kapitsinou PP, Haase VH. Molecular mechanisms of ischemic preconditioning in the kidney. Am J Physiol Renal Physiol. 2015;309(10):F821–F834. doi: 10.1152/ajprenal.00224.2015. - DOI - PMC - PubMed
    1. Joo JD, Kim M, D’Agati VD, Lee HT. Ischemic preconditioning provides both acute and delayed protection against renal ischemia and reperfusion injury in mice. J Am Soc Nephrol. 2006;17(11):3115–3123. doi: 10.1681/ASN.2006050424. - DOI - PubMed
    1. Murry CE, Jennings RB, Reimer KA. Preconditioning with ischemia: a delay of lethal cell injury in ischemic myocardium. Circulation. 1986;74(5):1124–1136. doi: 10.1161/01.CIR.74.5.1124. - DOI - PubMed
    1. Stringa P, et al. Pretreatment combination reduces remote organ damage secondary to intestinal reperfusion injury in mice: follow-up study. Transplant Proc. 2016;48(1):210–216. doi: 10.1016/j.transproceed.2015.12.002. - DOI - PubMed
    1. Sakr M, et al. The protective effect of FK506 pretreatment against renal ischemia/reperfusion injury in rats. Transplantation. 1992;53(5):987–991. doi: 10.1097/00007890-199205000-00004. - DOI - PMC - PubMed

Publication types

MeSH terms