Development and Validation of a Deep Neural Network Model for Prediction of Postoperative In-hospital Mortality
- PMID: 29664888
- PMCID: PMC6148401
- DOI: 10.1097/ALN.0000000000002186
Development and Validation of a Deep Neural Network Model for Prediction of Postoperative In-hospital Mortality
Abstract
What we already know about this topic: WHAT THIS ARTICLE TELLS US THAT IS NEW: BACKGROUND:: The authors tested the hypothesis that deep neural networks trained on intraoperative features can predict postoperative in-hospital mortality.
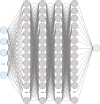
Methods: The data used to train and validate the algorithm consists of 59,985 patients with 87 features extracted at the end of surgery. Feed-forward networks with a logistic output were trained using stochastic gradient descent with momentum. The deep neural networks were trained on 80% of the data, with 20% reserved for testing. The authors assessed improvement of the deep neural network by adding American Society of Anesthesiologists (ASA) Physical Status Classification and robustness of the deep neural network to a reduced feature set. The networks were then compared to ASA Physical Status, logistic regression, and other published clinical scores including the Surgical Apgar, Preoperative Score to Predict Postoperative Mortality, Risk Quantification Index, and the Risk Stratification Index.
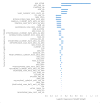
Results: In-hospital mortality in the training and test sets were 0.81% and 0.73%. The deep neural network with a reduced feature set and ASA Physical Status classification had the highest area under the receiver operating characteristics curve, 0.91 (95% CI, 0.88 to 0.93). The highest logistic regression area under the curve was found with a reduced feature set and ASA Physical Status (0.90, 95% CI, 0.87 to 0.93). The Risk Stratification Index had the highest area under the receiver operating characteristics curve, at 0.97 (95% CI, 0.94 to 0.99).
Conclusions: Deep neural networks can predict in-hospital mortality based on automatically extractable intraoperative data, but are not (yet) superior to existing methods.
Conflict of interest statement
- -
Christine Lee is an Edwards Lifesciences Employee but this work was made independent from this position and as part of her PhD
- -
Maxime Cannesson: Ownership interest in Sironis, a company developing closed-loop systems; Consulting for Edwards Lifesciences (Irvine, CA) and Masimo Corp. (Irvine, CA). Maxime Cannesson has received research support from Edwards Lifesciences through his Department and NIH R01 GM117622 – Machine learning of physiological variables to predict diagnose and treat cardiorespiratory instability and NIH R01 NR013912 – Predicting Patient Instability Non invasively for Nursing Care-Two (PPINNC-2).
The other authors declare that they have no conflicts of interest concerning this article.
Figures


Comment in
-
Artificial Intelligence for Anesthesia: What the Practicing Clinician Needs to Know: More than Black Magic for the Art of the Dark.Anesthesiology. 2018 Oct;129(4):619-622. doi: 10.1097/ALN.0000000000002384. Anesthesiology. 2018. PMID: 30080689 Free PMC article. No abstract available.
References
-
- Weiser TG, Regenbogen SE, Thompson KD, Haynes AB, Lipsitz SR, Berry WR, Gawande AA. An estimation of the global volume of surgery: a modelling strategy based on available data. The Lancet. 2008;372:139–144. - PubMed
-
- American Society of Anesthesiologists ASoAASoA. New classification of physical status. Anesthesiology. 1963
-
- Gawande AA, Kwaan MR, Regenbogen SE, Lipsitz SA, Zinner MJ. An Apgar Score for Surgery. Journal of the American College of Surgeons. 2007;204:201–208. - PubMed
Publication types
MeSH terms
Grants and funding
LinkOut - more resources
Full Text Sources
Other Literature Sources
Medical

