. 2018 Apr 17;14(4):e1006063.
doi: 10.1371/journal.pcbi.1006063. eCollection 2018 Apr.

On the role of extrinsic noise in microRNA-mediated bimodal gene expression

Affiliations

On the role of extrinsic noise in microRNA-mediated bimodal gene expression

Marco Del Giudice et al. PLoS Comput Biol. .

Abstract

Several studies highlighted the relevance of extrinsic noise in shaping cell decision making and differentiation in molecular networks. Bimodal distributions of gene expression levels provide experimental evidence of phenotypic differentiation, where the modes of the distribution often correspond to different physiological states of the system. We theoretically address the presence of bimodal phenotypes in the context of microRNA (miRNA)-mediated regulation. MiRNAs are small noncoding RNA molecules that downregulate the expression of their target mRNAs. The nature of this interaction is titrative and induces a threshold effect: below a given target transcription rate almost no mRNAs are free and available for translation. We investigate the effect of extrinsic noise on the system by introducing a fluctuating miRNA-transcription rate. We find that the presence of extrinsic noise favours the presence of bimodal target distributions which can be observed for a wider range of parameters compared to the case with intrinsic noise only and for lower miRNA-target interaction strength. Our results suggest that combining threshold-inducing interactions with extrinsic noise provides a simple and robust mechanism for obtaining bimodal populations without requiring fine tuning. Furthermore, we characterise the protein distribution's dependence on protein half-life.


Conflict of interest statement

The authors have declared that no competing interests exist.

Figures
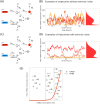
Fig 1
Fig 1. Model and steady-state trajectories.
The reference circuits (with and without extrinsic noise on the miRNA transcription rate) are represented in (C) and (A) respectively with the rates considered in the model. kR and kS are the target mRNA and miRNA transcription rates, gR and gS are respectively the mRNA and miRNA degradation rates. kP is the protein translation rate and gP is its degradation rate. g is the miRNA-target interaction strength and α is the fraction of miRNAs that are not recycled after binding to the mRNA. In panels (B) and (D) there are three different trajectories for the mRNA, corresponding to the model on the left. For both panels, the steady-state distributions of the number of free mRNA molecules are bimodal. In (B) the parameters are kS = 1.2 × 10⁻³ nM min−1, kR = 2.7 × 10⁻³ nM min−1, gS = 1.2 × 10⁻² min−1, gR = 2.4 × 10⁻² min−1, g = 1.5 × 10³ nM−1 min−1, kP = 6.0 min−1, gP = 1.2 × 10⁻² min−1 and α = 0.5. In (D) the parameters are kR = 3.1 × 10⁻³ nM min−1, gS = 1.2 × 10⁻² min−1, gR = 2.4 × 10⁻² min−1, g = 1.2 × 10² nM−1 min−1, kP = 6.0 min−1, gP = 1.2 × 10⁻² min−1 and α = 0.5. kS are picked from a Gaussian distribution with mean k¯S=1.2×10⁻³nMmin-1 and standard deviation σ = 2.4 × 10⁻⁴ nM min−1. (E) Cartoon of the free mRNA threshold behaviour as a function of its transcription rate. Below the threshold the amount of free miRNA is greater then the amount of free mRNA, in proximity to the threshold their amount is nearly the same, above the threshold the free mRNA amount exceeds the miRNA.
Fig 2
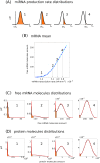
Fig 2. Emergence of bimodality in the presence of extrinsic noise.
(A) Qualitative representation of the miRNA production rate distribution. The black vertical line indicates the value of the miRNA transcription rate kS = αkR for different values of the target transcription rate kR. The distributions represent the different conditions labelled from 1 to 4 shown in (B). The region of the distribution contributing to the repressed state is coloured in orange. (B) The amount of free mRNA molecules as a function of the target transcription rate kR. Solid lines are analytic predictions while blue squares correspond to numerical simulations. (C) Free mRNA molecule distributions corresponding to the points highlighted in (B). Solid black lines correspond to numerical simulations while solid red lines are analytic predictions. The repressed region is coloured in orange. (D) Protein molecule distributions corresponding to the mRNA distributions in (C). Solid black lines correspond to numerical simulations while solid red lines are analytic predictions. The repressed region is coloured in orange. In (B) the parameters are gS = 1.2 × 10⁻² min−1, gR = 2.4 × 10⁻² min−1, g = 1.2 × 10² nM−1 min−1, kP = 6.0 min−1, gP = 1.2 × 10⁻² min−1, α = 0.5. kS are picked from a gaussian distribution with mean k¯S=1.2×10⁻³nMmin-1 and standard deviation σ = 4.8 × 10⁻⁴ nM min−1. kR ranges from 2.4 × 10⁻⁴ nM min−1 to 5.2 × 10⁻³ nM min−1. In (C) and (D) the parameters are the same as in (B) except for kR, which is fixed for each distribution and for dashed lines from 1 to 4 takes the values kR = 1.2 × 10⁻³ nM min−1, 3.1 × 10⁻³ nM min−1, 4.0 × 10⁻³ nM min−1, 4.8 × 10⁻³ nM min−1.
Fig 3
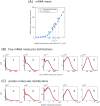
Fig 3. Bimodal distributions in the low-molecules regime.
(A) Free mRNA molecules amount as a function of the target transcription rate kR. Solid lines are analytic predictions while blue squares correspond to numerical simulations. (B) Free mRNA molecules distributions corresponding to the conditions labelled from 1 to 5 in (A). Solid black lines correspond to numerical simulations while solid red lines are analytical predictions. (C) Protein molecules distributions corresponding to the mRNA distributions in (B). Solid black lines correspond to numerical simulations while solid red lines are analytical predictions. In (A) the parameters are gS = 1.2 × 10⁻² min−1, gR = 2.4 × 10⁻² min−1, g = 1.2 × 10² nM−1 min−1, kP = 6.0 min−1, gP = 1.2 × 10⁻² min−1, α = 0.5. kS are picked from a gaussian distribution with mean k¯S=4.8×10⁻⁴nMmin-1 and standard deviation σ = 1.2 × 10⁻⁴ nM min−1. kR ranges from 1.2 × 10⁻⁴ nM min−1 to 19.2 × 10⁻⁴ nM min−1. In (B) and (C) the parameters are the same as in (A) except for kR that is fixed for each distribution and from left to right takes the values kR = 1.0 × 10⁻³ nM min−1, 1.2 × 10⁻³ nM min−1, 1.3 × 10⁻³ nM min−1, 1.4 × 10⁻³ nM min−1, 1.6 × 10⁻³ nM min−1.
Fig 4
Fig 4. Bimodality as a function of the parameters.
(A) Phase diagram for bimodality in the free mRNA molecules distribution. On the x axis there is the target transcription rate kR, on the y axis the extrinsic noise on the miRNA transcription rate. The color map indicates the presence of bimodality for different values of the miRNA-target interaction strength g. The presence of bimodality was computed by running several Gillespie’s simulations for fixed sets of parameters and sampling targets’ probability distributions. By using Matlab interpolation functions, we extracted the number of maxima of the distributions and used this value as a first measurement of bimodality. In the SI, we discussed a more refined version of this measurement. The width of the bimodality range increases as the interaction strength or the extrinsic noise are increased. The following parameters are equal for all the simulations: gS = 1.2 × 10⁻² min−1, gR = 2.4 × 10⁻² min−1, kP = 6.0 min−1, gP = 1.2 × 10⁻² min−1, α = 0.5. Target mRNA transcription rate is one of the control parameters and ranges from kR = 2.3 × 10⁻³ nM min−1 to kR = 5.8 × 10⁻³ nM min−1. miRNA-mRNA association rate is one of the control parameters and takes the following values: g = 1.2 × 10² nM−1 min−1, 3.0 × 10² nM−1 min−1, 4.8 × 10² nM−1 min−1, 9.6 × 10² nM−1 min−1. Extrinsic noise is tuned by varying the standard deviation of the distribution with mean k¯S=1.2×10⁻³nMmin-1 from which miRNA transcription rates are picked, the standard deviation takes the following values: σ = 0 nM min−1 (no extrinsic noise), 7.1 × 10⁻⁵ nM min−1, 2.4 × 10⁻⁴ nM min−1, 4.8 × 10⁻⁴ nM min−1. To define the origin of the bimodality region for the case with g = 1.2 × 10² nM−1 min−1 the value σ = 1.2 × 10⁻⁴ nM min−1 was also used. In the SI, a more systematic non-binary study of the appearance of the bimodality is reported (see S5 Fig). (B) Free mRNA distribution in case of pure intrinsic noise and small (g = 3.8 × 10² nM−1 min−1) miRNA-target interaction strength (black line), pure intrinsic noise and high (g = 1.1 × 10³ nM−1 min−1) miRNA-target interaction (blue histogram) and extrinsic noise (σ = 7.9 × 10⁻⁵ nM min−1) and small (g1 = 3.8 × 10² nM−1 min−1) miRNA-target interaction strength (orange histogram). The other parameters are as follows: kS = 1.2 × 10⁻³ nM min−1, gS = 1.2 × 10⁻² min−1, kR = 2.7 × 10⁻³ nM min−1, gR = 2.4 × 10⁻² min−1, kP = 6.0 min−1, gP = 1.2 × 10⁻² min−1, α = 0.5. The plot shows how extrinsic noise can compensate for small miRNA-target interaction strength in order to obtain bimodal distributions.
Fig 5
Fig 5. Competition between two targets of the same miRNA.
(A) Reference circuit including extrinsic noise for the case of two genes competing for the same miRNA. kS is the miRNA transcription rate. kR1 and kR2 are the mRNA transcription rates and gR1 and gR2 are the mRNA degradation rates of target 1 and 2 respectively. kP1 and kP2 are the translation rates and gP1 and gP2 are the degradation rates of protein 1 and 2 respectively. g1 and g2 are the miRNA interaction rates with target 1 and 2. α is the fraction of miRNAs that are not recycled after binding to the mRNAs. (B) Phase diagram for the bimodality of the target R1 for a fixed level of extrinsic noise (σ = 4.8 × 10⁻⁴ nM min−1), small miRNA/target 1 interaction strength (g1 = 1.2 × 10² nM−1 min−1) and different miRNA/target 2 interaction strengths g2. Bimodality here has been measured as in Fig 4. The other parameters are as follows: kR1 and kR2 range from 0 nM min−1 to 5.1 × 10⁻³ nM min−1, k¯S=1.2×10⁻³nMmin-1, gS = 1.2 × 10⁻² min−1, gR1 = gR2 = 2.4 × 10⁻² min−1, kP1 = kP2 = 6.0 min−1, gP1 = gP2 = 2.4 × 10⁻² min−1, α = 0.5. (C) Explanatory example of how it is possible to modulate target 1 distribution by increasing the expression of target 2 for small interaction strength between miRNA and targets (g1 = 1.2 × 10² nM−1 min−1, g2 = 30 nM−1 min−1). The extrinsic noise here is σ = 2.4 × 10⁻⁴ nM min−1. The other parameters are as in (B). (D) Intersection between the bimodality phase diagrams of both targets for g1 = 1.2 × 10² nM−1 min−1 and g2 = 30 nM−1 min−1. The other parameters are as in (B). Bimodality here is measured as in Fig 4. As a reference, with g1 = 1.2 × 10² nM−1 min−1 and g2 = 30 nM−1 min−1, in the bimodality region of the distribution of target 1, the average number of mRNA molecules of target 1 ranges from 40 to 250 and the average number of mRNA molecules of target 2 ranges from 0 to 125. In the bimodality region of the distribution of target 2, the average number of mRNA molecules of target 1 ranges from 0 to 60 and the average number of mRNA molecules of target 2 ranges from 5 to 180.
Fig 6
Fig 6. Protein half-life and bimodality.
In this panel three conditions (A), (B) and (C) in which the shape of the protein distribution is altered by an increased protein stability are reported. Histograms are the result of numerical simulations. The free mRNA distributions are represented in orange, and the protein distributions in blue, corresponding to different levels of scale separation between the mRNA and protein dynamics. Fast protein distributions are obtained for a protein half life comparable to that of the mRNA; in this condition the state of the protein copies that of the mRNA and the distributions almost coincide. Slow protein distributions are obtained for a protein half life up to 10 times longer than that of the mRNA. As a consequence of the higher protein stability different outcomes can be achieved depending on the level of extrinsic noise, the miRNA-target interaction strength and the proximity to the threshold (kR). Starting with a well defined bimodal distribution (A1) and (B1), for a fixed level of extrinsic noise, the repressed peak can be buffered (A2) or not (B2) depending on the value of kR. If the initial distribution is unimodal repressed (C1), for a given range of parameters, it can be converted into a unimodal unrepressed (C3), crossing a bimodal state (C2), by increasing the protein stability. In (A) the parameters are kR = 3.1 × 10⁻³ nM min−1, k¯S=1.2×10⁻³nMmin-1, σ = 2.4 × 10⁻⁴ nM min−1, gS = 1.2 × 10⁻² min−1, gR = 2.4 × 10⁻² min−1, g = 1.2 × 10² nM−1 min−1, α = 0.5, kP = 6.0 min−1, gP = 2.4 × 10⁻² min−1 for (A1) and kP = 6.0 × 10⁻¹ min−1, gP = 2.4 × 10⁻³ min−1 for (A2). In (B) the parameters are kR = 3.0 × 10⁻³ nM min−1, k¯S=1.2×10⁻³nMmin-1, σ = 2.4 × 10⁻⁴ nM min−1, gS = 1.2 × 10⁻² min−1, gR = 2.4 × 10⁻² min−1, g = 1.2 × 10² nM−1 min−1, α = 0.5, kP = 6.0 min−1, gP = 2.4 × 10⁻² min−1 for (B1) and kP = 6.0 × 10⁻¹ min−1, gP = 2.4 × 10⁻³ min−1 for (B2). In (C) the parameters are kR = 3.1 × 10⁻³ nM min−1, k¯S=1.4×10⁻³nMmin-1, σ = 1.7 × 10⁻⁴ nM min−1, gS = 1.2 × 10⁻² min−1, gR = 2.4 × 10⁻² min−1, g = 1.2 × 10² nM−1 min−1, α = 0.5, kP = 6.0 min−1, gP = 2.4 × 10⁻² min−1 for (C1), kP = 3.0min−1, gP = 1.2 × 10⁻² min−1 for (C2) and kP = 1.2min−1, gP = 4.8 × 10⁻³ min−1 for (C3). The ratio between kP and gP is always kept constant in order to maintain the mean of the protein distributions at a fixed value. Note that we do not present the analytic curves for such cases as the approximation fails to capture subtle features such as the (dis-)appearance of a small peak (see SI).
Fig 7
Fig 7. Mean molecules amounts and fold repression.
(A,C) Mean mRNA free amount (R) and protein amount (P) for two different sets of parameters, as a function of mRNA transcription rate and extrinsic noise level. The red line indicates the bimodality region. (B,D) Fold repression, i.e. ratio between the unregulated and regulated expression level, as a function of mRNA transcription rate and extrinsic noise level. The red line indicates the bimodality region. Mean values and fold repression are computed through the analytic approximation, while the bimodality region is obtained from numerical simulations. The set of parameters of panels (C) and (D) resembles an endogenous scenario, where the mean values of free mRNAs are of order of tens and the fold repression ranges between 2 and 6. In (A) and (B) the parameters are: gS = 1.2 × 10⁻² min−1, gR = 2.4 × 10⁻² min−1, kP = 6.0 min−1, gP = 1.2 × 10⁻² min−1, g = 3.0 × 10² nM−1 min−1, α = 0.5. Target mRNA transcription rate ranges from kR = 2.3 × 10⁻³ nM min−1 to kR = 5.8 × 10⁻³ nM min−1. Extrinsic noise is tuned by varying the standard deviation of the distribution with mean k¯S=1.2×10⁻³nMmin-1 from which miRNA transcription rates are picked. The amount of free miRNAs in this regime is of the order of tens, while its total amount (measured as the ratio between its transcription and degradation rates) is 250 molecules per cell. In (C) and (D) the parameters are: gS = 1.2 × 10⁻² min−1, gR = 2.4 × 10⁻² min−1, kP = 6.0 min−1, gP = 1.2 × 10⁻² min−1, g = 3.0 × 10² nM−1 min−1, α = 0.8. Target mRNA transcription rate ranges from kR = 0 nM min−1 to kR = 1.5 × 10⁻³ nM min−1. Extrinsic noise is tuned by varying the standard deviation of the distribution with mean k¯S=4.8×10⁻⁴nMmin-1 from which miRNA transcription rates are picked. The amount of free miRNAs in this regime is of the order of tens, while its total amount is 100 molecules per cell.
Fig 8
Fig 8. Bimodality appearance in presence of time-dependent extrinsic noise.
Solid cyan lines represent free mRNA molecules distributions with a time-dependent extrinsic noise on the miRNA transcription rate kS. The transcription rate is coupled to a birth and death process with finite pool N = 100. The steady-state distribution of kS is a nearly Gaussian distribution with mean k¯S=1.2×10⁻³nMmin-1 and standard deviation σ = 2.4 × 10⁻⁴ nM min−1. The time scale of this process is tuned by changing the values of the birth and death rates, keeping their ratio fixed. The time scales of the fluctuations of the miRNA transcription rate, from left to right are: 8.3 × 10⁻² min, 0.83 min, 21 min, 83 min and 830 min. The green histogram in the leftmost plot represents the free mRNA molecules distribution in absence of extrinsic noise. The orange histogram in the rightmost plot represents the free mRNA molecules distribution with static extrinsic noise introduced as described in the main text; the kS distribution used in this case is a Gaussian with mean k¯S=1.2×10⁻³nMmin-1 and standard deviation σ = 2.4 × 10⁻⁴ nM min−1. All the free mRNA molecules distributions are obtained from numerical simulations. The parameters are kR = 3.1 × 10⁻³ nM min−1, gR = 2.4 × 10⁻² min−1, gS = 1.2 × 10⁻² min−1, g = 1.2 × 10² nM−1 min−1, α = 0.5.

Similar articles

Cited by

References

    1. Bessarabova M, Kirillov E, Shi W, Bugrim A, Nikolsky Y, Nikolskaya T. Bimodal gene expression patterns in breast cancer. BMC Genomics. 2010;11(Suppl I): S8 doi: 10.1186/1471-2164-11-S1-S8 - DOI - PMC - PubMed
    1. Shalek AK, Satija R, Adiconis X, Gertner RS, Gaublomme JT, Raychowdhury R, et al. Single-cell transcriptomics reveals bimodality in expression and splicing in immune cells. Nature. 2013;498:236–240. doi: 10.1038/nature12172 - DOI - PMC - PubMed
    1. Nikolsky Y, Kirillov E, Serebryiskaya T, Rakhmatulin R, Perlina A, Bugrim A, et al. Sequential clustering of breast cancers using bimodal gene expression. Proceed AACR Ann Meeting. 2007; p. 141.
    1. Dozmorov I, Knowlton N, Tang Y, Shields A, Pathipvanich P, Jarvis J, et al. Hypervariable genes–experimental error or hidden dynamics. Nucleic Acids Res. 2004;32 (19):e147–10. doi: 10.1093/nar/gnh146 - DOI - PMC - PubMed
    1. Zhao H, Yue P, Fang K. Identification of differentially expressed genes with multivariate outlier analysis. J Biopharm Stat. 2004;14 (3):629–646. doi: 10.1081/BIP-200025654 - DOI - PubMed

Publication types

LinkOut - more resources