

A new model of wheezing severity in young children using the validated ISAAC wheezing module: A latent variable approach with validation in independent cohorts
- PMID: 29664908
- PMCID: PMC5903664
- DOI: 10.1371/journal.pone.0194739
A new model of wheezing severity in young children using the validated ISAAC wheezing module: A latent variable approach with validation in independent cohorts
Abstract
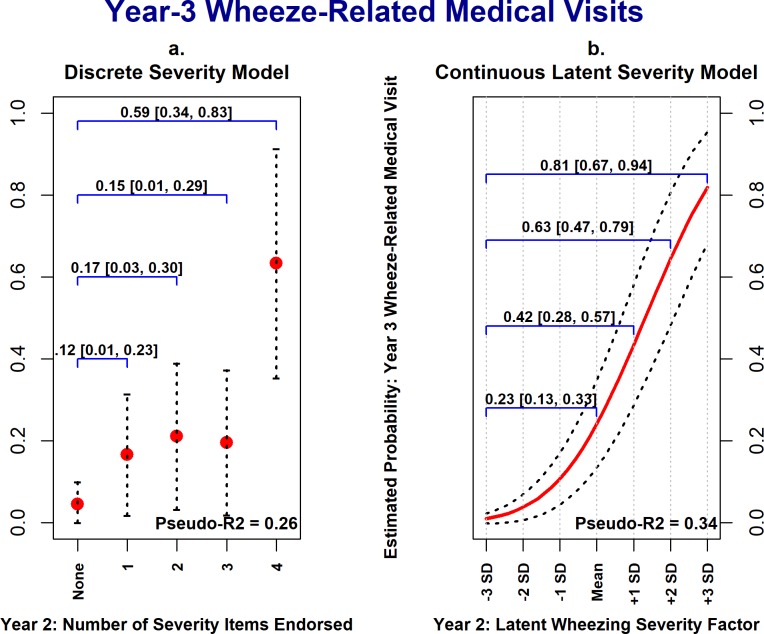
Background: The International Study of Asthma and Allergies in Children (ISAAC) Wheezing Module is commonly used to characterize pediatric asthma in epidemiological studies, including nearly all airway cohorts participating in the Environmental Influences on Child Health Outcomes (ECHO) consortium. However, there is no consensus model for operationalizing wheezing severity with this instrument in explanatory research studies. Severity is typically measured using coarsely-defined categorical variables, reducing power and potentially underestimating etiological associations. More precise measurement approaches could improve testing of etiological theories of wheezing illness.
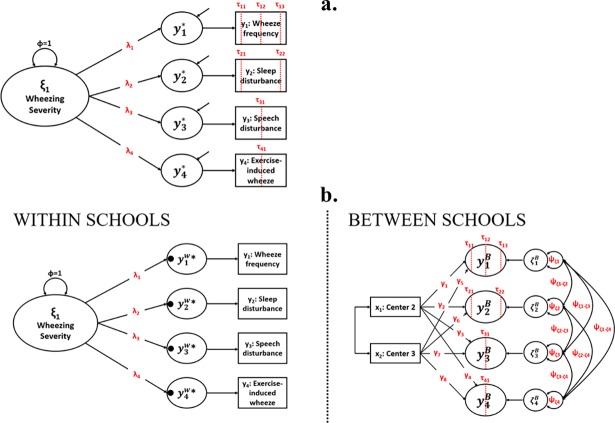
Methods: We evaluated a continuous latent variable model of pediatric wheezing severity based on four ISAAC Wheezing Module items. Analyses included subgroups of children from three independent cohorts whose parents reported past wheezing: infants ages 0-2 in the INSPIRE birth cohort study (Cohort 1; n = 657), 6-7-year-old North American children from Phase One of the ISAAC study (Cohort 2; n = 2,765), and 5-6-year-old children in the EHAAS birth cohort study (Cohort 3; n = 102). Models were estimated using structural equation modeling.
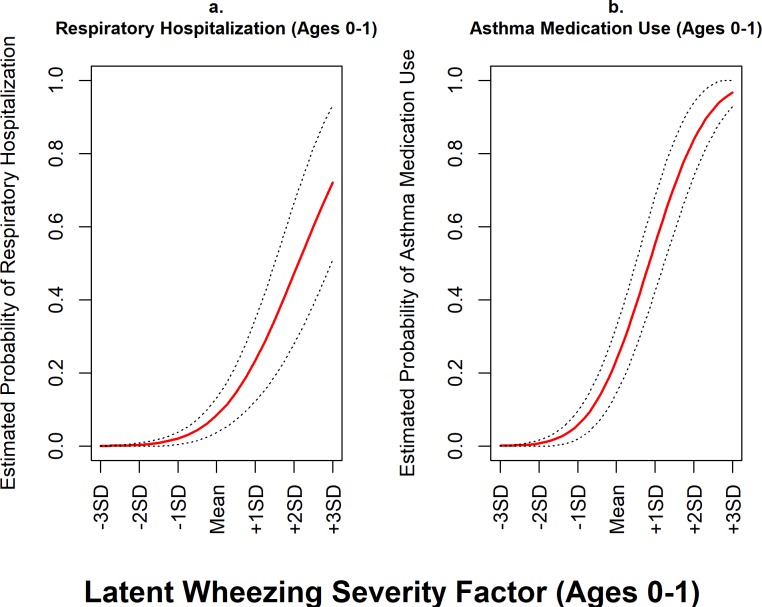
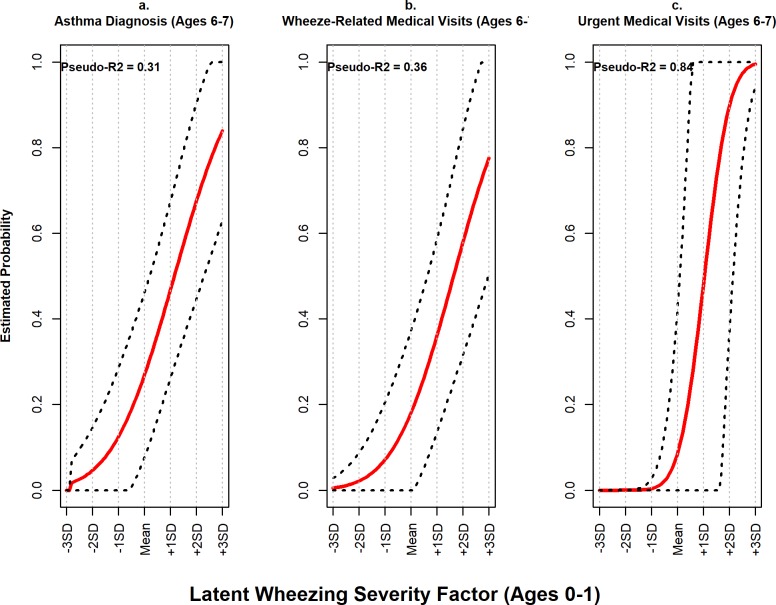
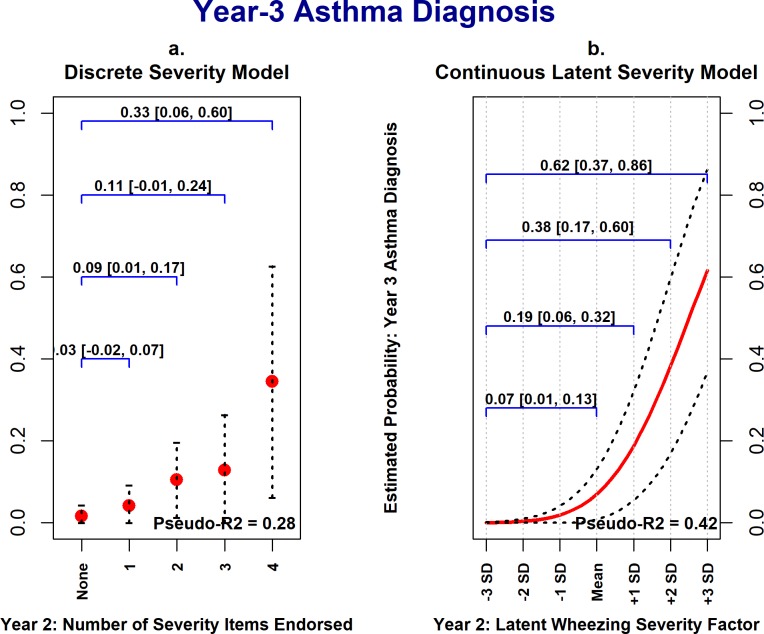
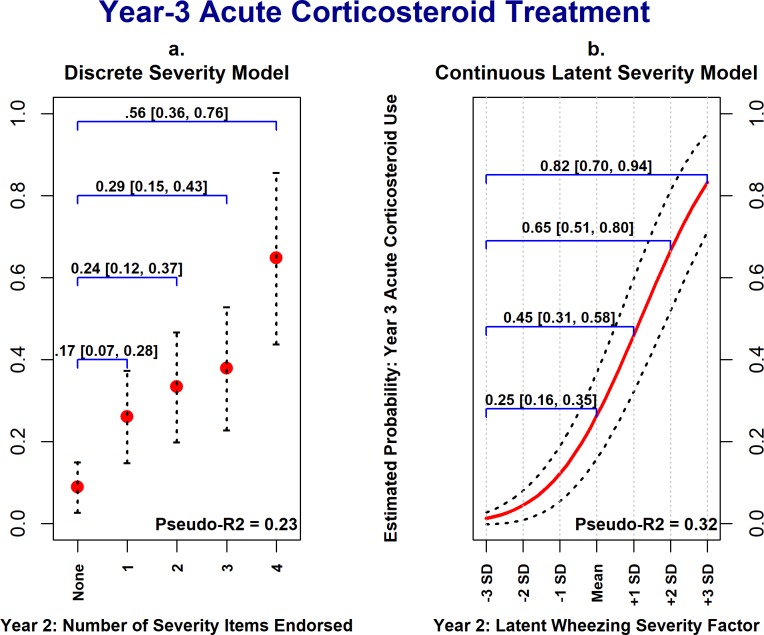
Results: In all cohorts, covariance patterns implied by the latent variable model were consistent with the observed data, as indicated by non-significant χ2 goodness of fit tests (no evidence of model misspecification). Cohort 1 analyses showed that the latent factor structure was stable across time points and child sexes. In both cohorts 1 and 3, the latent wheezing severity variable was prospectively associated with wheeze-related clinical outcomes, including physician asthma diagnosis, acute corticosteroid use, and wheeze-related outpatient medical visits when adjusting for confounders.
Conclusion: We developed an easily applicable continuous latent variable model of pediatric wheezing severity based on items from the well-validated ISAAC Wheezing Module. This model prospectively associates with asthma morbidity, as demonstrated in two ECHO birth cohort studies, and provides a more statistically powerful method of testing etiologic hypotheses of childhood wheezing illness and asthma.
Conflict of interest statement
Figures
Similar articles
-
Associations of wheezing phenotypes with late asthma outcomes in the Avon Longitudinal Study of Parents and Children: A population-based birth cohort.J Allergy Clin Immunol. 2016 Oct;138(4):1060-1070.e11. doi: 10.1016/j.jaci.2016.01.046. Epub 2016 Apr 20. J Allergy Clin Immunol. 2016. PMID: 27106203 Free PMC article.
-
Distinguishing Wheezing Phenotypes from Infancy to Adolescence. A Pooled Analysis of Five Birth Cohorts.Ann Am Thorac Soc. 2019 Jul;16(7):868-876. doi: 10.1513/AnnalsATS.201811-837OC. Ann Am Thorac Soc. 2019. PMID: 30888842 Free PMC article.
-
Comparison of childhood wheezing phenotypes in 2 birth cohorts: ALSPAC and PIAMA.J Allergy Clin Immunol. 2011 Jun;127(6):1505-12.e14. doi: 10.1016/j.jaci.2011.02.002. Epub 2011 Mar 16. J Allergy Clin Immunol. 2011. PMID: 21411131
-
"Why does he wheeze?": wheezing and asthma in young children.J Fam Health Care. 2006;16(3):87-9. J Fam Health Care. 2006. PMID: 16886732 Review.
-
Low-grade disease activity in early life precedes childhood asthma and allergy.Dan Med J. 2016 Aug;63(8):B5272. Dan Med J. 2016. PMID: 27477800 Review.
Cited by
-
The Children's Respiratory and Environmental Workgroup (CREW) birth cohort consortium: design, methods, and study population.Respir Res. 2019 Jun 10;20(1):115. doi: 10.1186/s12931-019-1088-9. Respir Res. 2019. PMID: 31182091 Free PMC article.
-
Risk Factors Associated With Health Care Utilization in Preschool Recurrent Wheezers in a Tropical Environment.Front Allergy. 2021 Oct 28;2:761492. doi: 10.3389/falgy.2021.761492. eCollection 2021. Front Allergy. 2021. PMID: 35387009 Free PMC article.
References
-
- Asher MI, Keil U, Anderson HR, Beasley R, Crane J, Martinez F, et al. International Study of Asthma and Allergies in Childhood (ISAAC): Rationale and methods. Eur Respir J. 1995;8: 483–491. - PubMed
Publication types
MeSH terms
Substances
Grants and funding
LinkOut - more resources
Full Text Sources
Other Literature Sources
Medical
Miscellaneous
