. 2018 Aug 1;526(11):1843-1858.
doi: 10.1002/cne.24452. Epub 2018 Apr 26.

Myelination of the developing lateral olfactory tract and anterior commissure

Affiliations

Myelination of the developing lateral olfactory tract and anterior commissure

L N Collins et al. J Comp Neurol. .

Abstract

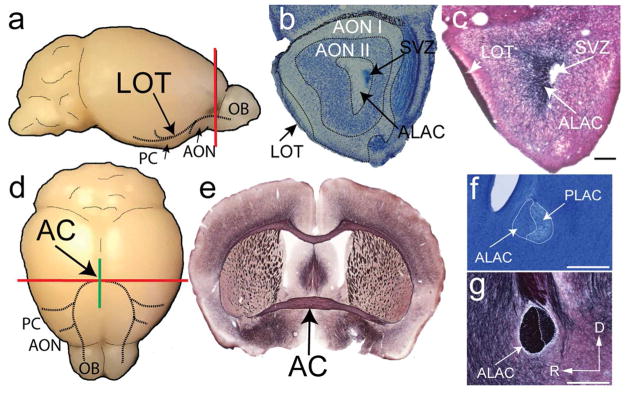
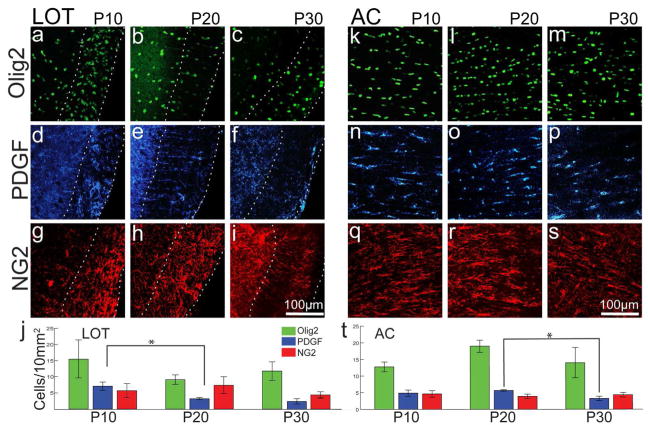
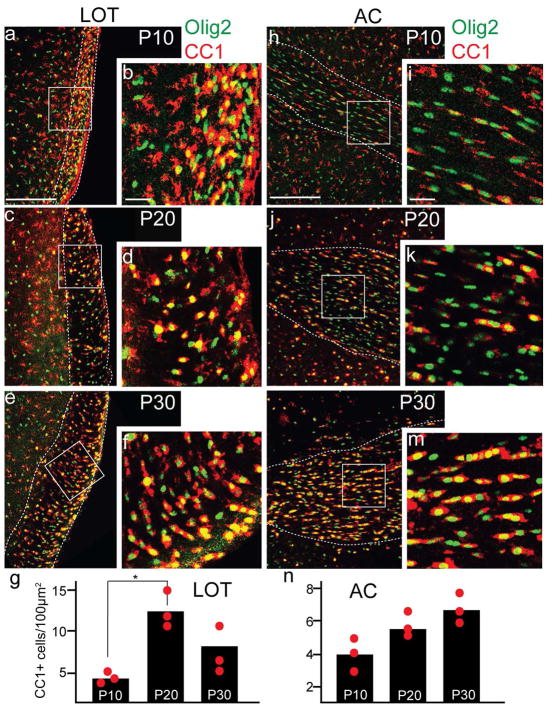
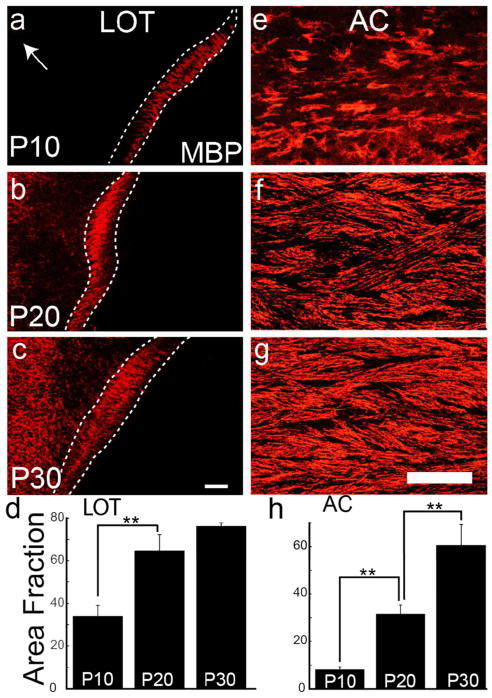
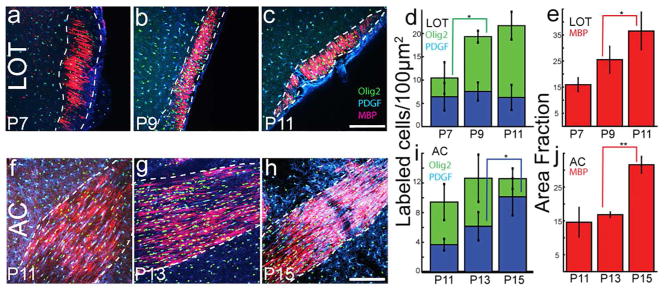
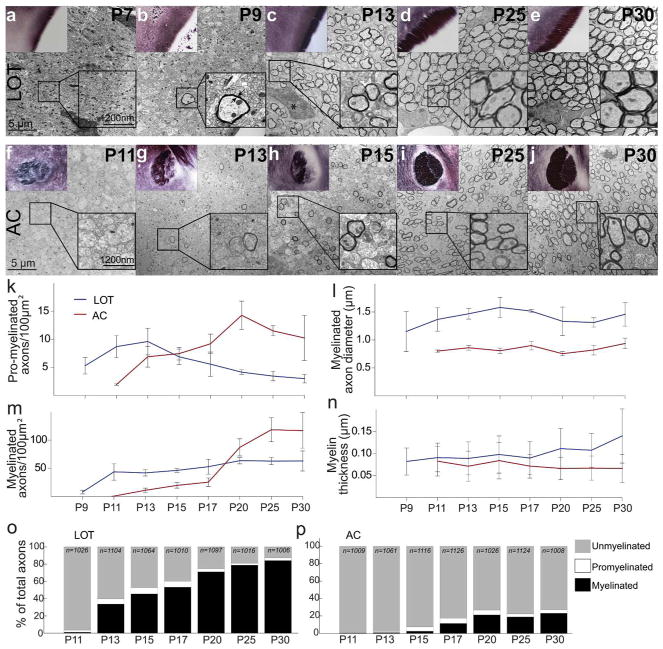
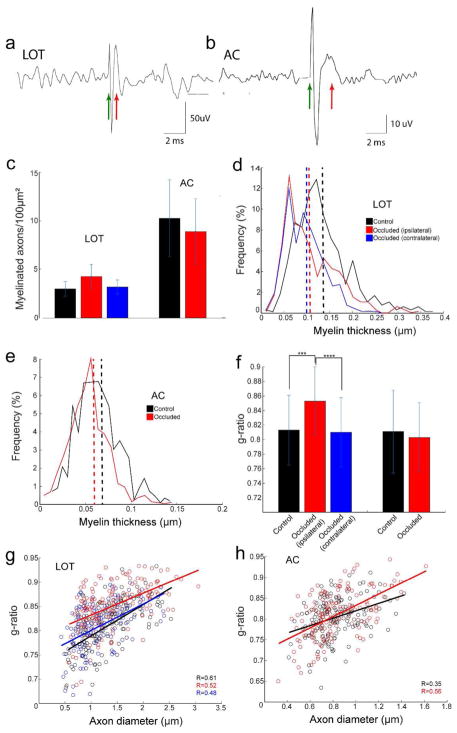
Both the lateral olfactory tract (LOT) and anterior limb of the anterior commissure (AC) carry olfactory information. The LOT forms the projection from the olfactory bulb to the ipsilateral olfactory cortices, while the AC carries odor information across the midline to the contralateral olfactory cortex and bulb. The LOT and AC differ on a number of dimensions, including early development and functional onset. The present work, examining their myelination in mice, reveals additional important differences. For example, the LOT initiates myelination 3-4 days earlier than the AC, evidenced by both an earlier increase in myelin basic protein staining seen with immunohistochemistry and an earlier appearance of myelinated fibers using electron microscopy. While both exhibit a period of rapid myelination, it occurs 4-5 days earlier in the LOT than the AC. The tracts also respond differently to early sensory restriction. Unilateral naris occlusion from the day after birth to postnatal day 30 had no consistent effects on the AC but resulted in significantly thinner myelin sheaths relative to axon caliber in the LOT. Finally, the two tracts differ structurally (the LOT contains larger, more densely packed axons with significantly thicker myelin sheaths resulting in a conduction velocity that is more than twice as fast as the AC). The findings indicate that these two large, accessible tracts provide an important means for studying brain maturation due to basic differences in both the timing of their maturation and general organization.

Keywords: RRID: AB_10141047; RRID: AB_11213678; RRID: AB_2057371; RRID: AB_2140491; RRID: AB_2236897; electron microscopy; immunohistochemistry; myelin precursors; olfactory cortex; oligodendrocytes.


Conflict of interest statement

This research was conducted in the absence of any commercial or financial relationships that could be construed as a potential conflict of interest.

Figures

Fig. 1
Fig. 1
General organization of the LOT and AC. a. Lateral view of the mouse brain. The LOT (dotted line) originates in the OB and projects ipsilaterally to the anterior olfactory nucleus (AON) and piriform cortex (PC). Solid red line indicates the approximate level of coronal Nissl- (b) and myelin- (c) stained sections. Myelin stained with Black Gold (Schmued, 1990). b. The LOT (arrowhead), on the ventrolateral surface of the olfactory peduncle, is adjacent to the AON pars lateralis. The AON is comprised of two zones, the outer plexiform (AON I) and an inner cellular (AON II) layer. The anterior (olfactory) limb of the AC (ALAC, arrow) courses lateral to the rostral migratory stream (subventricular zone: SVZ) in the center of the olfactory peduncle, c. Myelin- stained section through similar region demonstrating the location of the LOT and AC. d. Dorsal view of the mouse brain. The AC (dotted line) contains axons arising in the AON and PC that innervate the contralateral PC, AON, and OB. Solid red line indicates the approximate level of coronal section in (e) and the green, midsagittal line depicts the plane of section in panels (f) and (g). e. Myelin-stained coronal section at the level where the AC crosses the midline. f–g. Sagittal sections taken near the midline demonstrate a clear difference between the anterior (olfactory, ALAC) and posterior (PLAC) limbs of the AC in both cell body density (f, Nissl stain) and extent of myelination (g, myelin stain). D = dorsal; R = rostral.
Fig. 2
Fig. 2
Early oligodendrocyte maturation in the developing LOT and AC, including representative sections immunostained for Olig2, PDGF, or NG2 at P10, 20 and 30. Dotted lines indicate tract boundaries. J and T: Quantification of cell density of Olig2 (green), PDGF (blue), and NG2 (red) in the LOT and AC. Olig2 labeling (a marker for all cells in the oligodendroglial lineage) did not change over time in either tract (a–c, k–m). Developmental changes in PDGF+ cell density were observed between the LOT and AC. A significant decrease in PDGF labeling was observed in the LOT between P10 and P20 (j) and in the AC between P20 and P30 (t). NG2 labeling remained consistent over time in both tracts. Error bars represent standard deviation. *p<0.05
Fig. 3
Fig. 3
Later oligodendrocyte maturation in the developing LOT and AC. Representative LOT (a–f) and AC (h–m) sections immunostained for Olig2 (green) and CC1 (a marker for mature oligodendrocytes; red) at P10, 20, and 30. Dotted white boxes represent area enlarged in inset panels at right. Note the increase in colabeling (yellow) over time in both the LOT and AC. Scale bar = 100μm. Inset scale bar=50μm. g,n. Quantification of CC1 staining confirmed that between P10 and 20 large increases in CC1+ cell density occurred in the LOT while in the AC a more slight, steady increase was observed. Circles represent mean recorded density for each animal and bars represent average density across three animals. *p<0.05
Fig. 4
Fig. 4
Development of myelin sheaths in the LOT and AC. Representative LOT (a–c) and AC (e–g) sections immunostained for MBP, a marker of myelin sheaths, at P10, 20, and 30. Note the high staining density in the LOT as early as P10 (a), a time when very little myelin can be seen in the anterior limb of the anterior commissure (arrow) as it extends through the anterior olfactory nucleus (AON) or in the AC as it crosses the midline (e). A rapid increase in MBP labeling occurred in the LOT between P10 (a) and 20 (b), confirmed by quantification of the area fraction (proportion of labeled to total pixels; d). Note the difference in the timing of myelination between the LOT and the adjacent AON pars lateralis. While little myelin staining is present in the AON at P10, a large increase occurs between P20 and 30 (b,c). Significant increases in MBP labeling were observed in the AC between P10 and 20 as well as between P20 and 30 (e– h). Scale bars = 100μm. Error bars represent standard deviation. **p<0.01.
Fig. 5
Fig. 5
Comparison of the period of rapid myelination in the LOT and AC. Tissue was immunostained for Olig2 (green), PDGF (blue), and MBP (red). a–c. Representative LOT sections from mice aged P7, 9, and 11; f–h depict AC sections from P11, 13, and 15. Scale bar = 100μm. d–e,i–j. Quantification of developmental changes in immunostaining for each of the antigens (Olig2, green; PDGF, blue; and MBP, red). Note that as early as P7 MBP labeling is present in the LOT (a,e) and that the presence of PDGF+ precursor cells remained high in the AC as late as P15 (h–i), confirming an earlier developmental trajectory of the LOT. Error bars represent standard deviation. *p<0.05, **p<0.01.
Fig. 6
Fig. 6
Ultrastructural development of the LOT and AC. Top: Myelin-stained sections (insets) and EM micrographs of the developing LOT (a–e) and AC (f–j). With age the area of the LOT as well as the density of myelin staining increases dramatically, especially between P9 and P13. a. At P7 no myelinated axons are present, but pre-myelinating oligodendrocyte processes can be seen in between axons (boxed inset). b. Early myelination was observed at P9, evidenced by myelin wrappings and oligodendrocyte cytoplasm surrounding axons (inset). Myelin thickness was determined by measuring the distance between the inner and outermost point of compacted segments (arrows). c. Myelinated fibers were more apparent by P13, often clustered nearby glial cells or glial precursor cells (asterisk). d,e. Average myelinated cell density greatly increased by P25 (d), and continued to increase through P30 (e). Myelin stains demonstrated that with age the AC (f–j, inset) enlarges and the difference between the heavily myelinated anterior limb (left) and the posterior limb (right) becomes more apparent. Very few myelinated fibers were observed in the AC at P11 (f) with only sporadic promyelinated fibers. By P13 (g) the AC has begun myelinating large-caliber fibers. At the same time the LOT contained many myelinated figures (c). A large increase in myelinated fiber density caliber occurs between P13 and P15 (h) that continues through the period observed (i,j). Bottom panels: quantification of ultrastructural development of the LOT and AC. k. Number of promyelinated axons per 100μm2 in the LOT (blue line) and AC (red line) with age. Promyelinated fibers decreased in density earlier in the LOT (after P13) than in the AC (after P20). l. Mean axon caliber of myelinated fibers was substantially greater in the LOT than in the AC at every age examined. m. Myelinated cell counts (number of myelinated axons per 100μm2) increased much earlier in the LOT (between P9 and P11) than the AC (between P17 and 25). n. Mean myelin thickness was similar throughout the development of both the LOT the AC, but was consistently higher in the LOT compared to the AC. o–p. Percentages of myelinated (black), promyelinated (white), and unmyelinated (gray) axons in the LOT (o) and AC (p) followed a similar developmental trend to that observed with density measures (k,m).
Fig. 7
Fig. 7
Top: Representative evoked responses in the LOT (a) and AC (b). The interval between time of stimulation (green arrows) and the peak of the evoked responses (red arrows) was estimated and compared. Bottom: Quantification of the effects of unilateral naris occlusion from P1-P30 on myelination. c. No differences in the density of myelinated axons was observed between control and experimental animals in the LOT (left) or AC (right). d. In the LOT, a significant decrease in myelin thickness was observed in experimental animals compared to controls (black) in both the LOT ipsilateral (red) and contralateral (blue) to occlusion. The differences in the average thickness of the myelin sheath (dotted vertical lines) is reflected in frequency histograms: most myelin sheaths fell between 0.05 and 0.1μm in experimental animals and between 0.1 and 0.15μm in controls. e. In the AC, myelin was slightly thinner on average in experimental animals (red) compared to controls and the distributions between control and experimental samples differed significantly. f–h. To confirm that differences in myelin thickness could not be accounted for by a sampling of thinner axons, g-ratios were calculated and compared. In the LOT a significant increase in g-ratio (indicating thinner myelin sheaths relative to axon caliber) was observed in the tract ipsilateral to occlusion in experimental animals. However, in the AC, no difference in g-ratio was found, suggesting that the small difference observed in myelin thickness might be due to sampling artifacts. Open circles in (g) and (h) represent individual data points fit with a linear function (solid lines). Error bars represent standard deviation. ***p<0.001.

Similar articles

Cited by

References

    1. Aggarwal S, Yurlova L, Simons M. Central nervous system myelin: structure, synthesis, and assembly. Trends in Cell Biology. 2011;21(10):585–593. - PubMed
    1. Al-Mayhani MTF, Grenfell R, Narita M, Piccirillo S, Kenney-Herbert E, Fawcett JW, Watts C. NG2 expression in glioblastoma identifies an actively proliferating population with an aggressive molecular signature. Neuro-oncology. 2011;13(8):830–845. - PMC - PubMed
    1. Asou H, Hamada K, Miyazaki T, Sakota T, Hayashi K, Takeda Y, Marret S, Delpech B, Itoh K, Uyemura K. CNS myelinogenesis in vitro: time course and pattern of rat oligodendrocyte development. Journal of Neuroscience Research. 1995;40(4):519–534. - PubMed
    1. Barrera K, Chu P, Abramowitz J, Steger R, Ramos RL, Brumberg JC. Organization of myelin in the mouse somatosensory barrel cortex and the effects of sensory deprivation. Developmental Neurobiology. 2013;73(4):297–314. - PMC - PubMed
    1. Baumann N, Pham-Dinh D. Biology of oligodendrocyte and myelin in the mammalian central nervous system. Physiological Reviews. 2001;81(2):871–927. - PubMed

Publication types