. 2019 Jul;24(4):604-616.
doi: 10.1111/adb.12625. Epub 2018 Apr 17.

Silencing synaptic MicroRNA-411 reduces voluntary alcohol consumption in mice

Affiliations

Silencing synaptic MicroRNA-411 reduces voluntary alcohol consumption in mice

Dana Most et al. Addict Biol. 2019 Jul.

Abstract

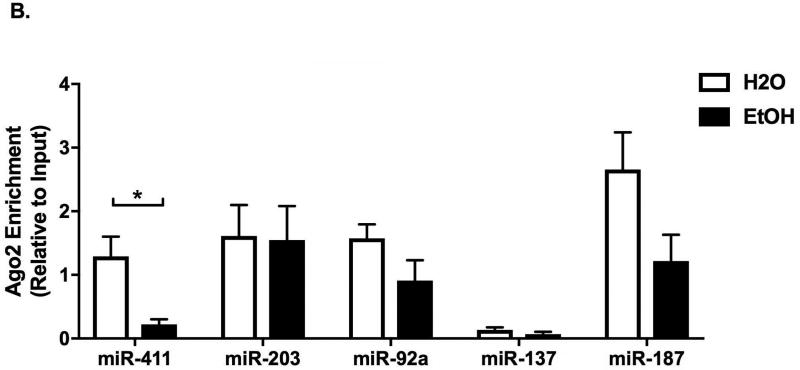
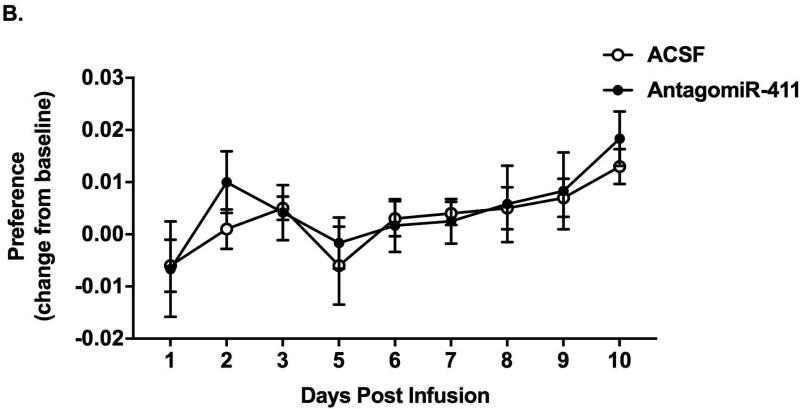
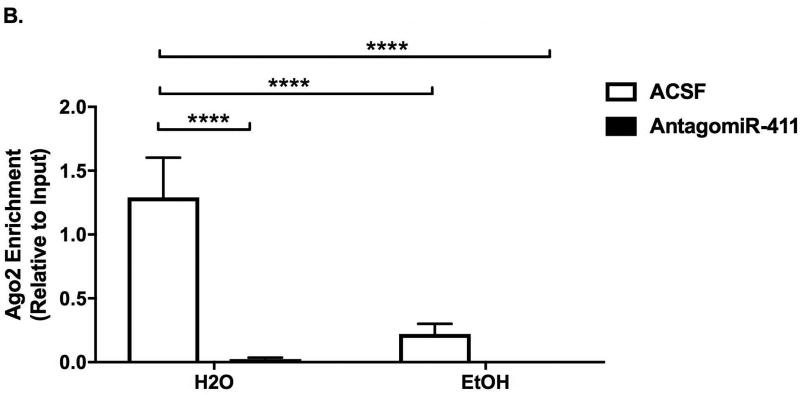
Chronic alcohol consumption alters the levels of microRNAs and mRNAs in the brain, but the specific microRNAs and processes that target mRNAs to affect cellular function and behavior are not known. We examined the in vivo manipulation of previously identified alcohol-responsive microRNAs as potential targets to reduce alcohol consumption. Silencing of miR-411 by infusing antagomiR-411 into the prefrontal cortex of female C57BL/6J mice reduced alcohol consumption and preference, without altering total fluid consumption, saccharin consumption, or anxiety-related behaviors. AntagomiR-411 reduced alcohol consumption when given to mice exposed to a chronic alcohol drinking paradigm but did not affect the acquisition of consumption in mice without a history of alcohol exposure, suggesting that antagomiR-411 has a neuroadaptive, alcohol-dependent effect. AntagomiR-411 decreased the levels of miR-411, as well as the association of immunoprecipitated miR-411 with Argonaute2; and, it increased levels of Faah and Ppard mRNAs. Moreover, antagomiR-411 increased the neuronal expression of glutamate receptor AMPA-2 protein, a known alcohol target and a predicted target of miR-411. These results suggest that alcohol and miR-411 function in a homeostatic manner to regulate synaptic mRNA and protein, thus reversing alcohol-related neuroadaptations and reducing chronic alcohol consumption.

Keywords: Ago2; C57BL/6 J mice; Faah mRNA and Ppard mRNA; GluA2; miR-411; two-bottle choice ethanol drinking.


Figures

Figure 1
Figure 1. Alcohol decreases the levels of miR-411, miR-203, miR-92a, and miR-137 and the levels of miR-411 associated with Ago2
A. Effects of alcohol on miR-411, miR-203, miR-92a, miR-137 and miR-187 levels measured by qPCR. Samples are from alcohol-consuming (EtOH, N=7–8) compared with control (H2O, N=7–8) mice. Results are shown as fold-change ΔΔCt values relative to H2O. B. Effects of alcohol on Ago2 association with miR-411, miR-203, miR-92a, miR-137 or miR-187, measured by immunoprecipitation (IP) and qPCR. Samples are from alcohol-consuming (EtOH, N=5) compared with control mice (H2O, N=7–8). IP data are shown relative to input microRNA levels. For all panels, significance was determined using unpaired t-tests followed by Holm-Sidak post-hoc tests (* P<0.05, ** P<0.01, *** P<0.001). Data represent mean + standard error of the mean.
Figure 2
Figure 2. AntagomiR-411 treatment decreases alcohol consumption in mice exposed to chronic alcohol
A. Timeline of cannulation and the two-bottle choice alcohol (15%) consumption procedure. Following chronic alcohol consumption, treatments were infused into the PFC, and drinking effects were measured for 6–10 days. Effects of antagomiR-411 (N=13), mimic-411 (N=15) or ACSF (N=14) on B. alcohol consumption, C. preference for alcohol over water and D. total fluid consumption. Data are presented as change from baseline per day (Day X - baseline). Significance was determined using repeated-measures ANOVA followed by Holm-Sidak post-hoc tests (* P<0.05, ** P<0.01). Data represent mean ± standard error of the mean. One data point was determined to be an outlier and was not included in the analysis. E. Histogram of the change in consumption levels following treatment with antagomiR-411 or ACSF, collapsed throughout the days post-infusion.
Figure 3
Figure 3. Antagomir-411 treatment does not change saccharin consumption
A–B. Effects of antagomir-411 (N=12) or ACSF (N=10) on A. saccharin consumption, B. preference for saccharin over water and C. total fluid intake. Data are presented as change from baseline per day (Day X - baseline). For all panels, significance was determined using repeated-measures ANOVA followed by Holm-Sidak post-hoc tests. Data represent mean ± standard error of the mean.
Figure 4
Figure 4. AntagomiR-411 treatment in alcohol-naïve mice does not change alcohol consumption
A. Timeline of cannulation and the two-bottle choice alcohol (15%) consumption procedure. B–D. Effects of antagomiR-411 (N=14) or ACSF (N=11) on B. alcohol consumption, C. preference for alcohol over water and D. total fluid consumption. Data are presented as two-day averages. Significance was determined using repeated-measures ANOVA followed by Holm-Sidak post-hoc tests. Data represent mean ± standard error of the mean.
Figure 5
Figure 5. AntagomiR-411 treatment decreases levels of miR-411 and miR-411 associated with Ago2
A. Effects of antagomiR-411 and alcohol on miR-411 levels measured by qPCR. Samples were taken from alcohol-consuming (EtOH) and control (H2O) mice after treatment with antagomiR-411 or ACSF: ACSF-H2O (N=8), AntagomiR-411-H2O (N=8), ACSF-EtOH (N=8) and AntagomiR-411-EtOH (N=5). Data were quantified using the ΔΔCt method (relative to ACSF-H2O levels). SnoRNA-234 was used as an endogenous control. B. Effects of antagomiR-411 and alcohol on Ago2 association with miR-411 measured by immunoprecipitation (IP) and qPCR: ACSF-H2O (N=5), AntagomiR-411-H2O (N=7), ACSF-EtOH (N=6) and AntagomiR-411-EtOH (N=5). IP data are shown relative to input microRNA levels. For all panels, significance was determined using unpaired t-tests followed by Holm-Sidak post-hoc tests (*** P<0.001, **** P<0.0001). Data represent mean + standard error of the mean.
Figure 6
Figure 6. AntagomiR-411 treatment increases GLUA2 protein levels
Normalized protein expression for GLUA2, GRINA and GABAB1 calculated with the Corrected Total Cell fluorescence (CTCF) method. Values were calculated using immunohistochemistry-stained prefrontal cortex slices from alcohol-consuming mice. Significance was determined using unpaired t-tests followed by Holm-Sidak post-hoc tests (** P<0.01). Data represent mean + standard error of the mean.

Similar articles

Cited by

References

    1. Ambros V. microRNAs: tiny regulators with great potential. Cell. 2001;107:823–826. - PubMed
    1. Bahi A, Dreyer JL. Striatal modulation of BDNF expression using microRNA124a-expressing lentiviral vectors impairs ethanol-induced conditioned-place preference and voluntary alcohol consumption. European Journal of Neuroscience. 2013;38:2328–2337. - PubMed
    1. Baingana F, al'Absi M, Becker AE, Pringle B. Global research challenges and opportunities for mental health and substance-use disorders. Nature. 2015;527:S172–S177. - PMC - PubMed
    1. Blednov YA, Benavidez JM, Black M, Ferguson LB, Schoenhard GL, Goate AM, Edenberg HJ, Wetherill L, Hesselbrock V, Foroud T. Peroxisome Proliferator-Activated Receptors α and γ are Linked with Alcohol Consumption in Mice and Withdrawal and Dependence in Humans. Alcoholism: Clinical and Experimental Research. 2015;39:136–145. - PMC - PubMed
    1. Blednov YA, Cravatt BF, Boehm SL, II, Walker D, Harris RA. Role of endocannabinoids in alcohol consumption and intoxication: studies of mice lacking fatty acid amide hydrolase. Neuropsychopharmacology. 2007;32:1570. - PubMed

Publication types

MeSH terms