. 2018 Sep;31(5):636-640.
doi: 10.1111/pcmr.12704. Epub 2018 Apr 29.

FBXW7 regulates a mitochondrial transcription program by modulating MITF

Affiliations

FBXW7 regulates a mitochondrial transcription program by modulating MITF

Franco Abbate et al. Pigment Cell Melanoma Res. 2018 Sep.

Abstract

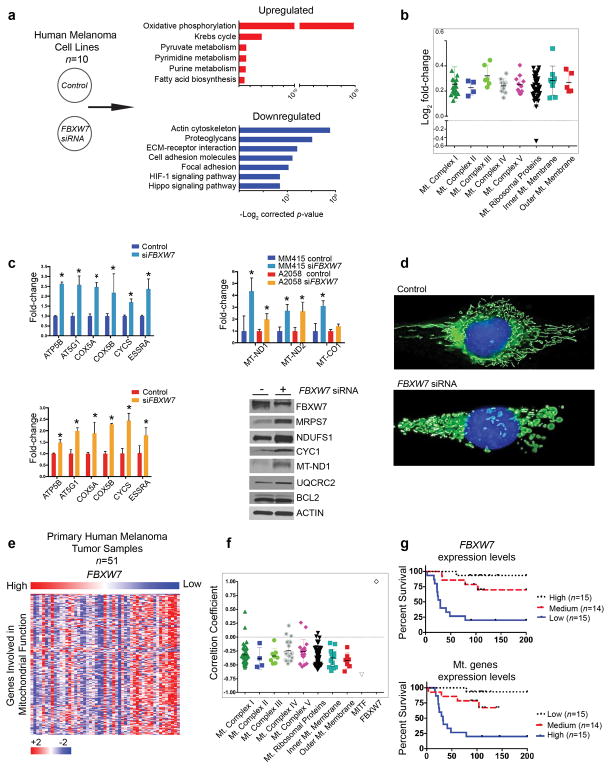
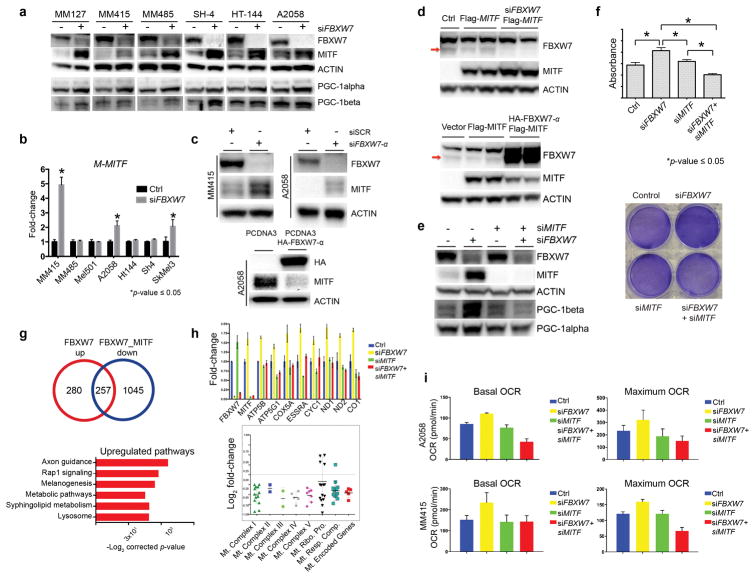
FBXW7 is well characterized as a tumor suppressor in many human cancers including melanoma; however, the mechanisms of tumor-suppressive function have not been fully elucidated. We leveraged two distinct RNA sequencing datasets: human melanoma cell lines (n = 10) with control versus silenced FBXW7 and a cohort of human melanoma tumor samples (n = 51) to define the transcriptomic fingerprint regulated by FBXW7. Here, we report that loss of FBXW7 enhances a mitochondrial gene transcriptional program that is dependent on MITF in human melanoma and confers poor patient outcomes. MITF is a lineage-specific master regulator of melanocytes and together with PGC-1alpha is a marker for melanoma subtypes with dependence for mitochondrial oxidative metabolism. We found that inactivation of FBXW7 elevates MITF protein levels in melanoma cells. In vitro studies examining loss of FBXW7 and MITF alone or in combination showed that FBXW7 is an upstream regulator for the MITF/PGC-1 signaling.

Keywords: FBXW7; MITF; PGC-1alpha; melanoma; metabolism; mitochondria.


Conflict of interest statement

CONFLICT OF INTEREST

The authors declare no conflict of interest.

Figures

Figure 1
Figure 1. FBXW7 silencing enhances a mitochondrial gene transcription program
(a) Human melanoma cell lines were transfected with either scrambled or FBXW7-specific pooled four distinct siRNAs (Dharmacon, Lafayette, CO), mRNA isolated, and subjected to RNA sequencing. Ten cell lines were examined: 501Mel, A2058, HT144, MeWo, MM415, MM485, SH4, SkMel3, WC119, and WM35. Differentially expressed genes between scrambled versus FBXW7 siRNA conditions were determined by using the limma software package (Law, Chen, Shi, & Smyth, 2014; Smyth, 2004). To identify functional pathways deregulated between the groups, the top 1000 up- and down-regulated genes were analyzed using DAVID (the Database for Annotation, Visualization, and Integrated Discovery). The x-axis represents the –log2 of the p-value and the y-axis the functional processes. (b) Genes involved in mitochondrial function found as differentially expressed between scrambled versus FBXW7 siRNA (adjusted p-value ≤ 0.05) were grouped based on functional category. The x-axis represents mitochondrial functional groups and the y-axis the log2 fold-change. (c) Two melanoma cell lines, A2058 and MM415, were transfected with scrambled or FBXW7-specific siRNA in triplicates, followed by total RNA isolation and qRT-PCR of genes for mitochondrial function, including those encoded by mitochondria (MT-ND1, MT-ND2, and MT-CO1). Selected proteins were validated by western blot using MM415 whole cell lysates. Densitometry analysis is indicated in Figure S1b. (d) MM415 cells were transfected with scrambled or FBXW7-specific siRNA for 48 hours. Cells were seeded on rat-tail collagen I coated plates for 24 hours prior to the following indicated treatments. Mitochondria and nuclei were labeled with MitoTracker Green (100 nM) and Hoechst 33342 (20 mM) for 30 minutes at 37°C, respectively. Phenol red free media supplemented with 10% FBS, 2 mM L-glutamine, and antibiotics was used for all imaging performed on a Zeiss Imager.Z1 equipped with a N-Achroplan 40×/0.75 water immersion lens and an AxioCAM MRm digital camera. Images were captured using AxioVision 4.8 and Zeiss Zen software. (e) Our previously published (Badal et al., 2017) RNA-Seq dataset of human primary melanomas (n=51) was queried for FBXW7 and mitochondrial genes. Heatmap represents supervised clustering based on FBXW7 mRNA expression levels (high to low, x-axis) and mitochondrial genes (y-axis). (f) Pearson correlation coefficient values (+1 to −1, y-axis) for FBXW7 and genes regulating mitochondrial function (x-axis) were calculated from the RNA-Seq dataset, and are shown in a dot plot graph that also includes MITF. (g) Kaplan-Meier survival curves of the patient cohort were examined for FBXW7 and genes regulating mitochondrial function. Survival curves showing clinical outcome of melanoma patients based on FBXW7 (top) and mitochondrial gene (bottom) expression levels are indicated. Samples are divided into three groups of similar size with high (n=15), medium (n=14), and low (n=15) expression levels.
Figure 2
Figure 2. FBXW7 tumor suppressor modulates MITF, and MITF-dependent mitochondrial gene transcriptional program and oxidative metabolism
(a) MITF protein levels were assayed using Western blotting (Pierce, Waltham, MA, USA) following transient transfection of either scrambled or FBXW7-specific siRNA in a panel of human melanoma cell lines. MM127, MM415, and MM485 harbor an NRASQ61 mutation whereas SH4, HT144, and A2058 melanoma lines have the BRAFV600E mutation. PGC-1alpha (Santa Cruz Biotechnology, Inc. Dallas, TX, USA) and PGC-1beta (Bethyl Laboratories, Inc. Montgomery, TX, USA) levels are shown. β-actin (Cell Signaling Technology, Inc., Danvers, MA, USA) was used as loading control. Densitometry is depicted in Figure S2. (b) A panel of human melanoma cell lines were transfected with scrambled or FBXW7-specific siRNA and at 72h was processed for total RNA isolation and qRT-PCR for M-MITF. Expression levels of M-MITF were normalized to β-actin. The data plotted represent means ± standard deviations of three independent experiments. Significance is indicated by p-value ≤ 0.05. (c) MITF levels were examined by Western blotting after silencing FBXW7 with FBXW7-α specific siRNA in MM415 and A2058 lines (top panel) and overexpressing FBXW7-α using HA-tagged FBXW7-α expression plasmid (bottom panel) in the A2058 human melanoma cell line. Experiments were performed at 72h. Densitometry is depicted in Figure S2. (d) MITF levels were examined upon silencing of FBXW7 using FBXW7-specific siRNA in the presence of flag-tagged MITF expression vector or expression vector alone (top panel). Empty vector and flag-tagged MITF expression plasmid alone or together with HA-tagged FBXW7-α were transiently transfected in 293T cells. MITF protein levels were examined using Western blotting (bottom panel). β-actin was used as loading control. Densitometry is depicted in Figure S2. (e) FBXW7 and MITF were silenced alone or in combination using gene-specific siRNAs in the MM415 human melanoma cell line (siMITF from Dharmacon, Lafayette, CO) followed by Western blotting. MITF, PGC-1alpha, and PGC-1beta levels were analyzed. β-actin was used as loading control. Densitometry is depicted in Figure S2. Densitometry is depicted in Figure S2. (f) FBXW7 and MITF were silenced alone or in combination using gene-specific siRNAs in MM415 melanoma cells followed by XTT assay (Cell Signaling Technology, Inc., Danvers, MA, USA) to analyze cell viability using manufacturer’s instructions (top panel). The absorbance was read at 450nm in a 96-well plate reader. Representative crystal violet stainings are depicted in the bottom panel showing cellular density in the different experimental conditions. (g) FBXW7 and MITF were silenced alone or in combination using gene-specific siRNAs in MM415 cells followed by total RNA isolation, library preparation (TruSeq RNA Library Prep Kit Illumina, San Diego, CA), and sequencing (Illumina NextSeq500, San Diego, CA), and analyzed as described previously (Badal et al., 2017). Differentially expressed genes for each condition were analyzed. Functional pathways and genes regulating mitochondrial function deregulated upon FBXW7 silencing that are dependent on MITF are selected and displayed. (h) Validation experiment was performed using qRT-PCR on the same conditions using a selected number of genes involved in mitochondrial function. (i) Oxygen consumption rate (OCR) was examined through the Seahorse technology using the manufacturer’s guidelines (Santa Clara, CA, USA). A2058 and MM415 melanoma cells were transfected with either scrambled, or gene-specific siRNAs for FBXW7 and MITF alone or in combination. At 72 hours the Mito Stress Test was performed and the data was normalized by a colorimetric assay.

Similar articles

Cited by

References

    1. Aydin IT, Abbate F, Rajan GS, Badal B, Aifantis I, Desman G, Celebi JT. FBXW7 inactivation in a BrafV600E-driven mouse model leads to melanoma development. Pigment Cell Melanoma Res. 2017 doi: 10.1111/pcmr.12603. - DOI - PMC - PubMed
    1. Aydin IT, Melamed RD, Adams SJ, Castillo-Martin M, Demir A, Bryk D, … Celebi JT. FBXW7 mutations in melanoma and a new therapeutic paradigm. J Natl Cancer Inst. 2014;106(6):dju107. doi: 10.1093/jnci/dju107. - DOI - PMC - PubMed
    1. Badal B, Solovyov A, Di Cecilia S, Chan JM, Chang LW, Iqbal R, … Celebi JT. Transcriptional dissection of melanoma identifies a high-risk subtype underlying TP53 family genes and epigenome deregulation. JCI Insight. 2017;2(9) doi: 10.1172/jci.insight.92102. - DOI - PMC - PubMed
    1. Dankort D, Curley DP, Cartlidge RA, Nelson B, Karnezis AN, Damsky WE, Jr, … Bosenberg M. Braf(V600E) cooperates with Pten loss to induce metastatic melanoma. Nat Genet. 2009;41(5):544–552. doi: 10.1038/ng.356. - DOI - PMC - PubMed
    1. Davis RJ, Welcker M, Clurman BE. Tumor suppression by the Fbw7 ubiquitin ligase: mechanisms and opportunities. Cancer Cell. 2014;26(4):455–464. doi: 10.1016/j.ccell.2014.09.013. - DOI - PMC - PubMed

Publication types

MeSH terms

Substances