. 2018 Jul;17(7):1337-1353.
doi: 10.1074/mcp.RA118.000623. Epub 2018 Apr 17.

Extensive Identification and In-depth Validation of Importin 13 Cargoes

Affiliations

Extensive Identification and In-depth Validation of Importin 13 Cargoes

Imke Baade et al. Mol Cell Proteomics. 2018 Jul.

Abstract

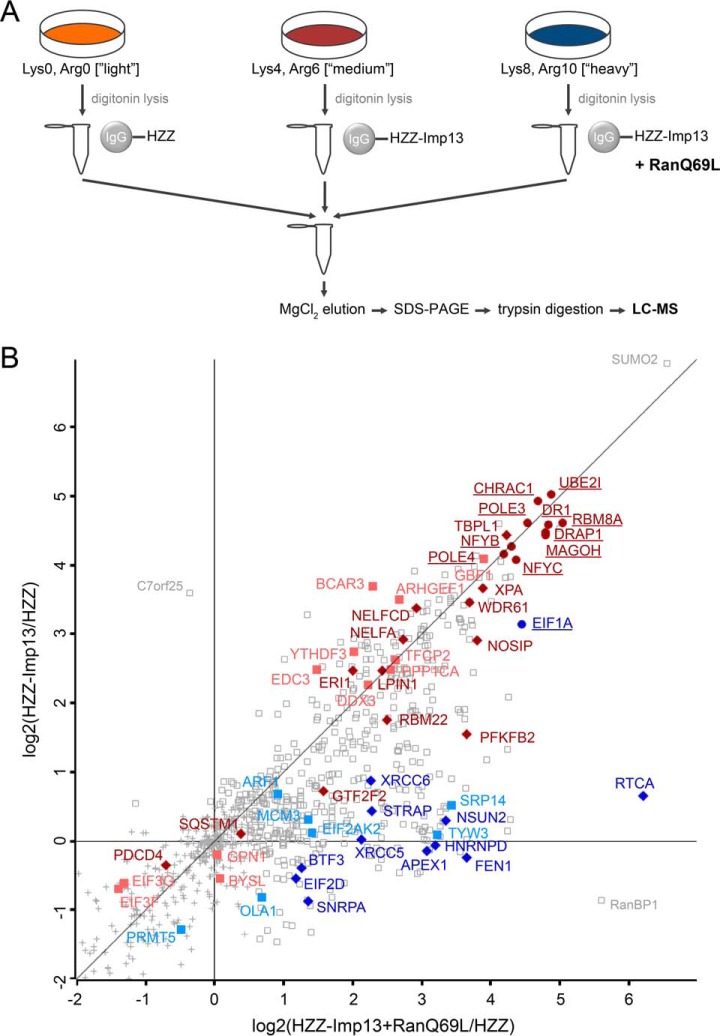
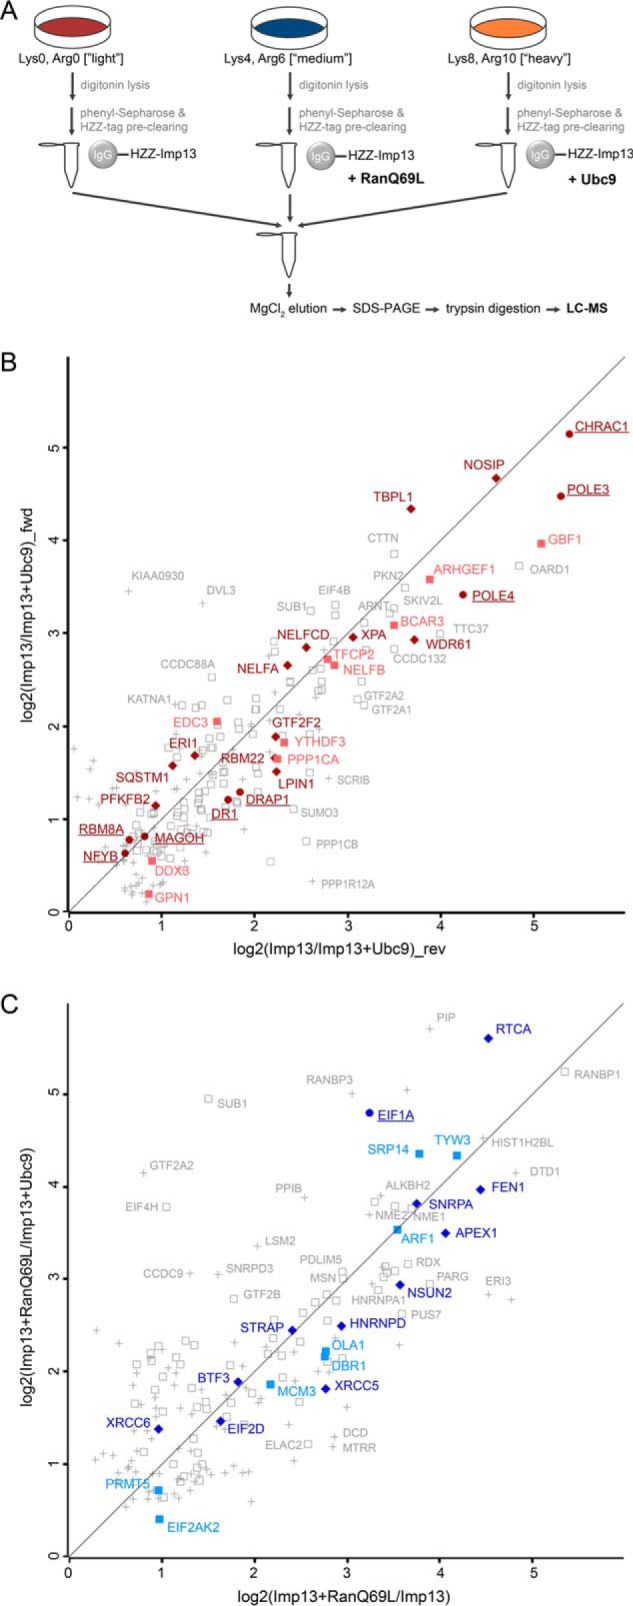
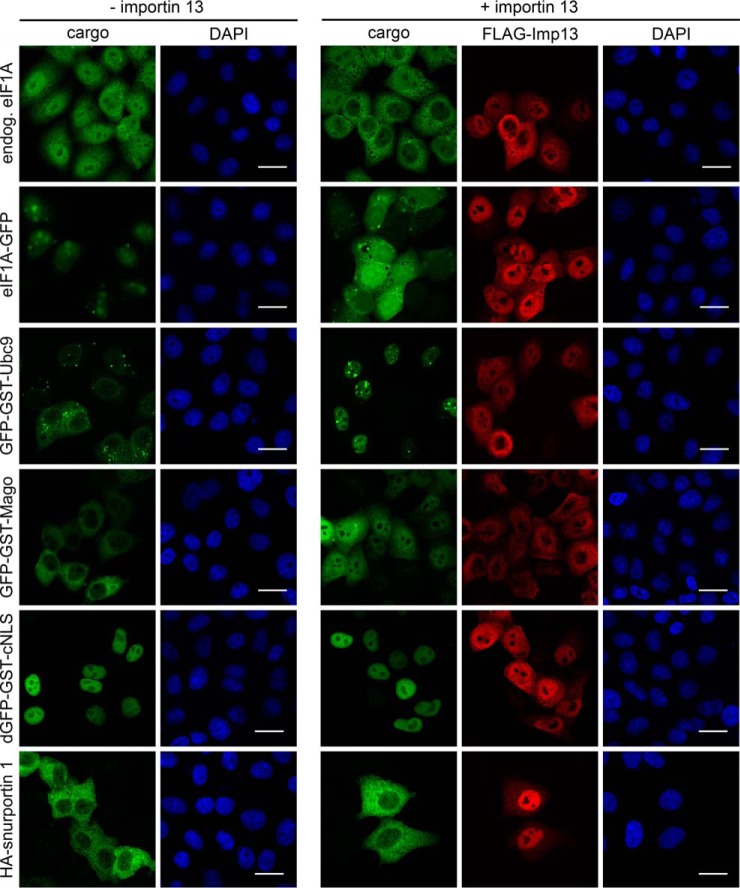
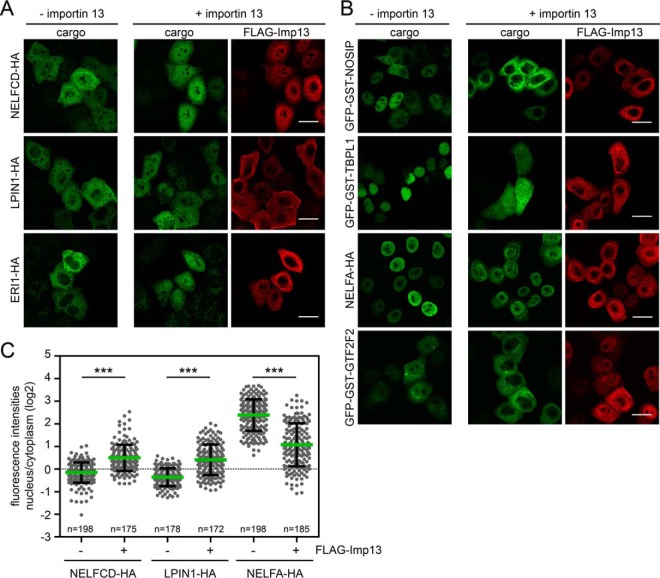
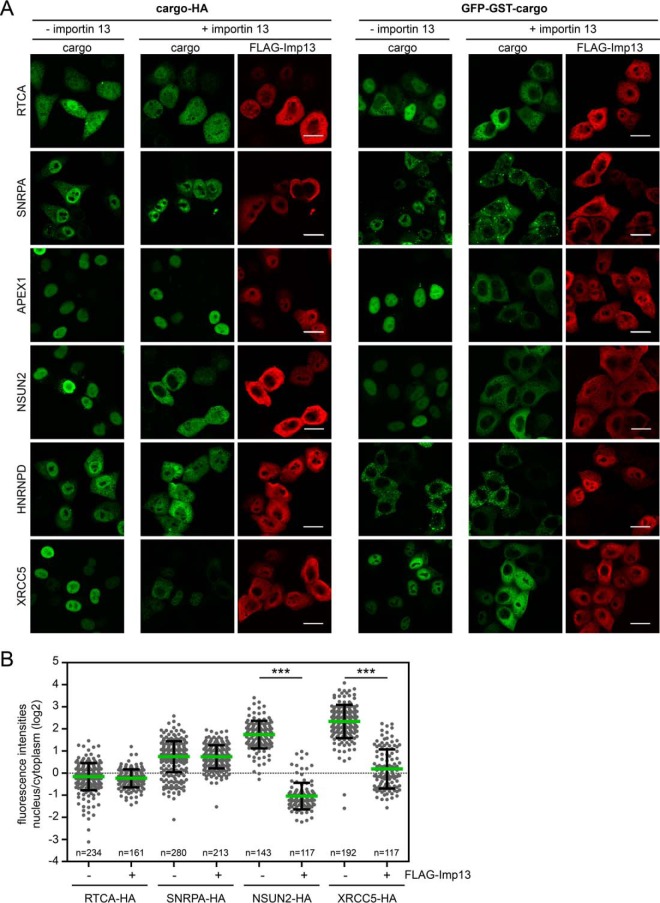
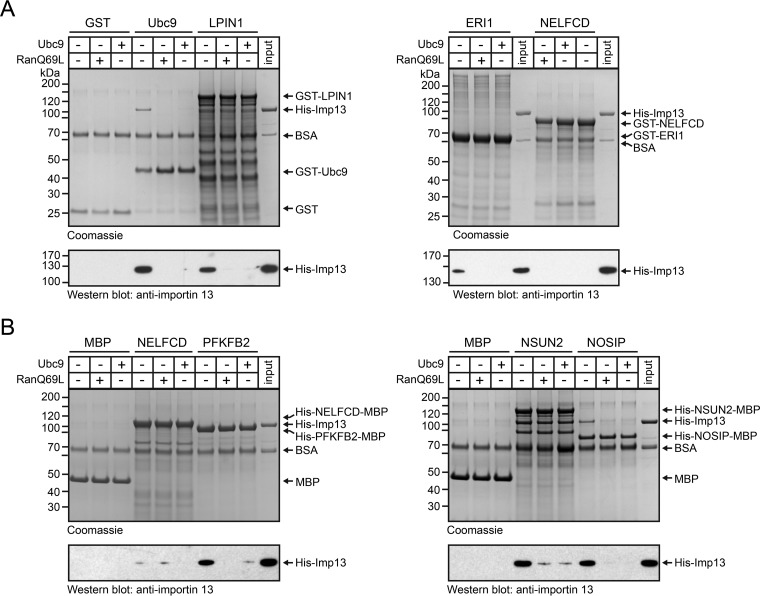
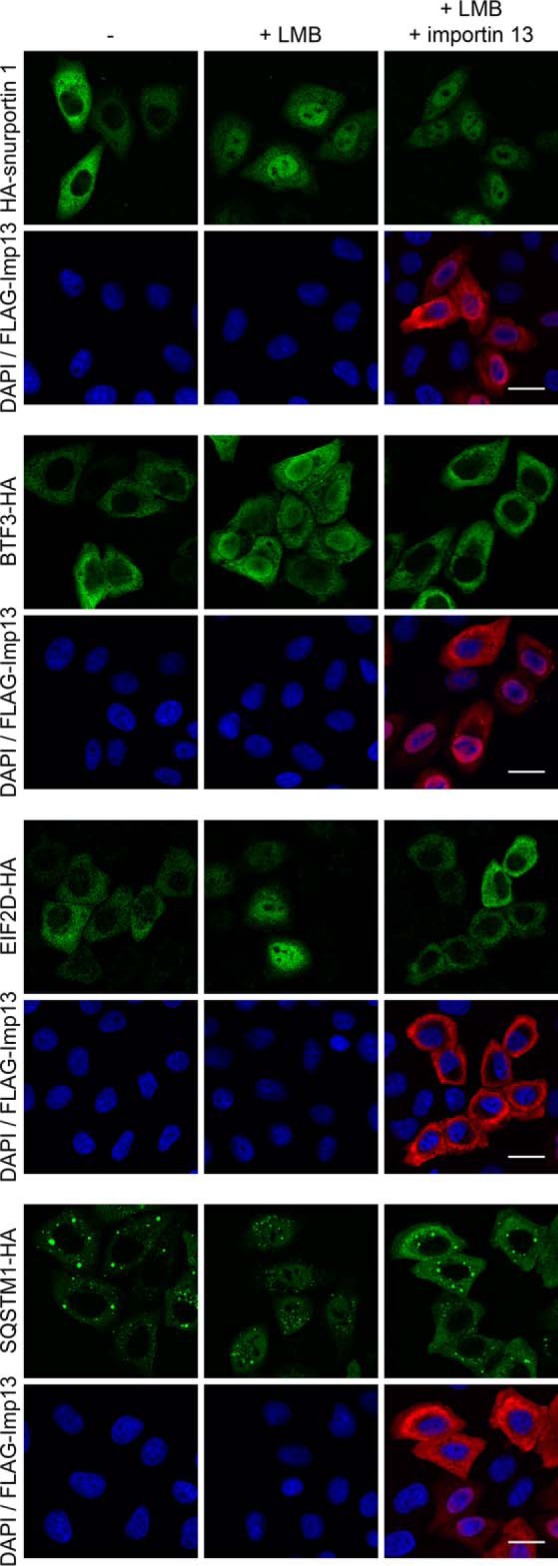
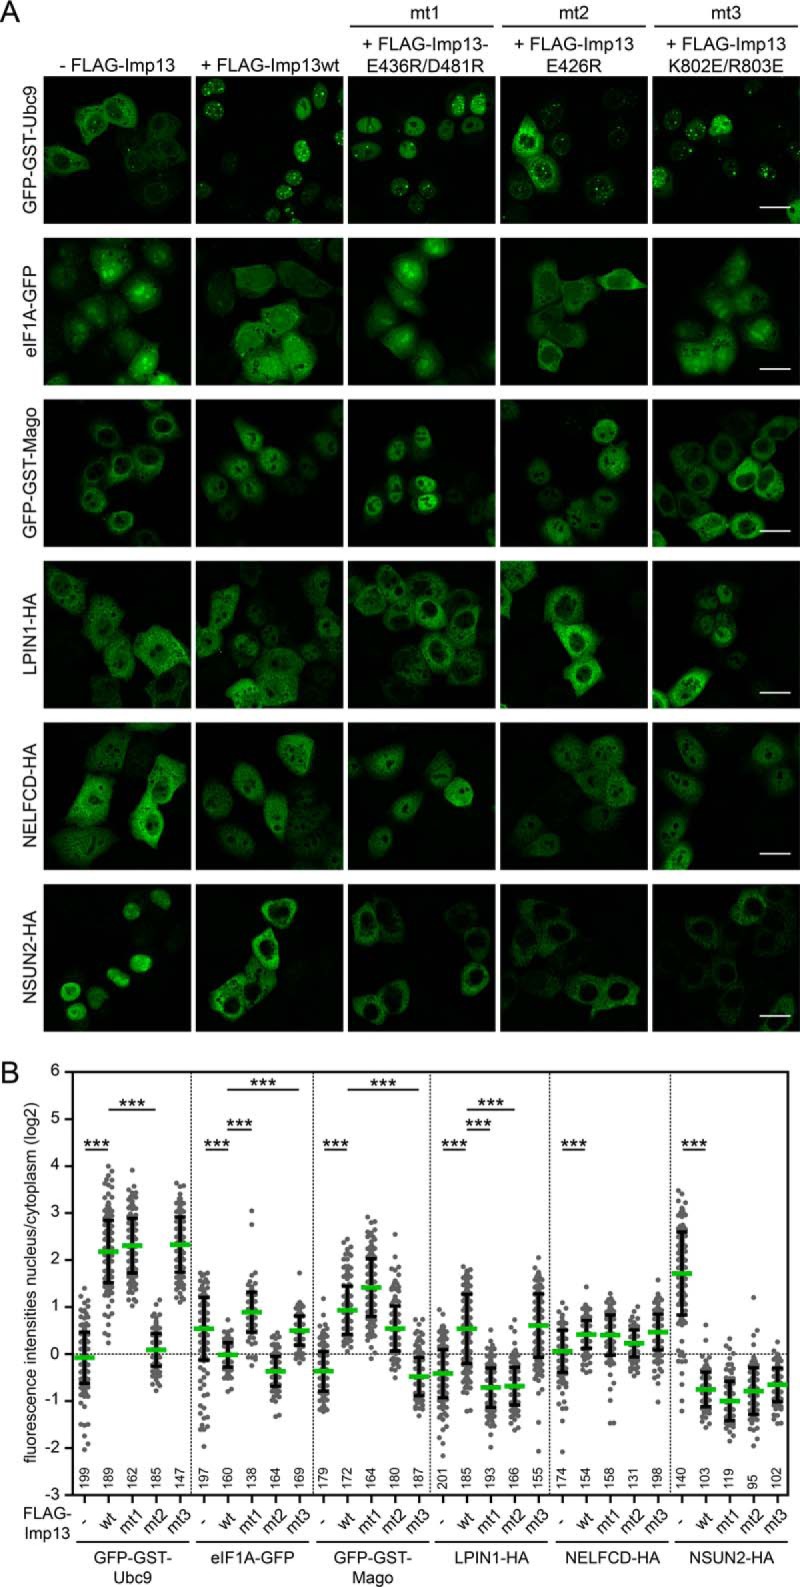
Importin 13 is a member of the importin β family of transport receptors. Unlike most family members, importin 13 mediates both, nuclear protein import and export. To search for novel importin 13 cargoes, we used stable isotope labeling of amino acids in cell culture (SILAC) and mass spectrometry. Using stringent criteria, we identified 255 importin 13 substrates, including the known cargoes Ubc9, Mago and eIF1A, and validate many of them as transport cargoes by extensive biochemical and cell biological characterization. Several novel cargoes can also be transported by the export receptor CRM1, demonstrating a clear redundancy in receptor choice. Using importin 13 mutants, we show that many of the novel substrates contact regions on the transport receptor that are not used by Ubc9, Mago or eIF1A. Together, this study significantly expands the repertoire of importin 13 cargoes and sets the basis for a more detailed characterization of this extremely versatile transport receptor.

Keywords: Affinity proteomics; Cell biology*; Mass Spectrometry; Nuclear Translocation; SILAC; Ubc9; eIF1A; importin 13; nucleus.


Figures

Fig. 1.
Fig. 1.
SILAC 1: identification of importin 13 cargoes using mass spectrometry. A, Experimental workflow. HZZ-tagged importin 13 or the HZZ-tag alone were immobilized on IgG-Sepharose and incubated with HeLa cell extracts containing either “light” (Lys0, Arg0), “medium” (Lys4, Arg6) or “heavy” (Lys8, Arg10) isotopes of lysine and arginine, with or without exogenous RanQ69L, as indicated. B, Scatter plot showing log2-ratios of importin 13 binding proteins enriched against the HZZ-affinity matrix in the presence (x axis) or absence (y axis) of RanQ69L. Colored proteins are either known importin 13 cargoes (underlined) or were further analyzed in this study. Gray squares correspond to proteins enriched with a log2 ratio ≥ 0.5. Gray crosses mark proteins that were considered insignificant. Red, proteins reduced by Ubc9 in SILAC 2–4. Blue, proteins enriched by RanQ69L in SILAC 2–4 (compare Fig. 2B, 2C). Proteins in dark colors were affected by overexpression of importin 13.
Fig. 2.
Fig. 2.
SILAC 2–4: importin 13 binding proteins from HeLa cell extracts. A, Experimental workflow. HZZ-tagged importin 13 was immobilized on IgG-Sepharose and incubated with labeled HeLa cell extracts (“light”, “medium”, “heavy”) supplemented with either RanQ69L, Ubc9 or buffer. B, Scatter plot showing log2-ratios of proteins binding to the importin 13 matrix in the absence or presence of Ubc9 in forward (fwd, y axis) and reverse (rev, x axis) reactions. C, Scatter plot showing log2-ratios of proteins binding to the importin 13 matrix in the presence or absence of RanGTP, with (y axis) or without (x axis) the addition of Ubc9. (B, C) Data are from three independent biological replicates with two experiments under identical labeling conditions (reverse) and one with a label switch (forward). Underlined proteins are known importin 13 cargoes. Proteins highlighted in red (B) and blue (C) but not underlined are cargo candidates that were further analyzed, and were (dark color, filled diamonds) or were not (light color, filled squares) affected by overexpression of importin 13. Gray open squares and gray crosses correspond to importin 13 cargo candidates identified in all three or in two out of three SILAC replicates with a log2 ratio ≥ 0.5, respectively.
Fig. 3.
Fig. 3.
Importin 13 is rate-limiting for transport of cargo proteins. HeLa cells were co-transfected with plasmids coding for eIF1A-GFP, GFP-GST-Ubc9, GFP-GST-Mago, dGFP-GST-cNLS or HA-snurportin 1 and FLAG-importin 13 or an empty vector. For endogenous eIF1A, HeLa cells were transfected with FLAG-importin 13 or an empty vector and stained with an antibody against eIF1A. FLAG-importin 13 and HA-snurportin 1 were visualized by indirect immunofluorescence using anti-FLAG and anti-HA antibodies, respectively. DNA was stained with DAPI. Scale bars, 20 μm. Note that eIF1A-GFP is enriched in nucleoli whereas endogenous eIF1A appears to be excluded from these sites. This, however, can be ascribed to the eIF1A antibody, which does not detect nucleolar eIF1A (data not shown).
Fig. 4.
Fig. 4.
Analysis of importin 13 cargo candidates. HeLa cells were transfected with plasmids coding for C-terminal HA-tagged or N-terminal GFP-GST-tagged importin 13 cargo candidates (i.e. proteins with reduced binding to importin 13 in the presence of Ubc9; compare Fig. 2B) and FLAG-importin 13 or an empty vector. Expressed proteins were detected by indirect immunofluorescence using anti-HA or anti-FLAG antibodies, or directly via the GFP-tag. NELFCD, LPIN1, and ERI1 showed a more nuclear localization upon importin 13 overexpression (A), and NOSIP, TBPL1, NELFA and GTF2F2 a more cytoplasmic localization (B). C, Dot plot of the log2-ratios of nuclear and cytoplasmic intensities of importin 13 cargo candidates with average values (green bars) and standard deviation (error bars). Data were scored from a minimum of three independent experiments. n, number of cells analyzed. ***, p value < 0.001. See Fig. 2B and Table I and S1 for additional proteins tested. Scale bars, 20 μm.
Fig. 5.
Fig. 5.
Analysis of importin 13 cargo candidates enriched with RanQ69L. A, HeLa cells were transfected with plasmids coding for C-terminal HA- or N-terminal GFP-GST-tagged importin 13 cargo candidates (compare Fig. 2C) and FLAG-importin 13 or an empty vector. Expressed proteins were detected by indirect immunofluorescence using anti-HA or anti-FLAG antibodies or directly via the GFP-tag. Scale bars, 20 μm. B, Dot plot of the log2-ratios of nuclear and cytoplasmic intensities of importin 13 cargo candidates with average values (green bars) and standard deviation (error bars). Data were scored from a minimum of three independent experiments. n, number of cells analyzed. ***, p value < 0.001. See Fig. 2C and Table I and S1 for additional proteins tested.
Fig. 6.
Fig. 6.
Importin 13 cargo candidates interact directly with importin 13. GST- (A) or MBP- (B) tagged importin 13 cargo candidates or the tags alone were immobilized on glutathione or amylose beads, respectively, and incubated with His-importin 13 in the absence or presence of RanQ69L(aa1–180)-GTP or Ubc9, as indicated. Bound proteins were analyzed by SDS-PAGE, followed by Coomassie staining (top) and immunoblotting with anti-importin 13 antibodies (bottom). GST-Ubc9 served as a positive control for importin 13 binding. The input corresponds to 10% or 1% of His-importin 13 used in the binding reactions for the Coomassie gels or the Western blots, respectively.
Fig. 7.
Fig. 7.
Redundancy in importin 13 and CRM1 mediated transport. HeLa cells were transfected with plasmids coding for HA-tagged importin 13 cargo candidates BTF3, EIF2D and SQSTM1 or HA-snurportin 1 and FLAG-importin 13 or an empty vector. Where indicated, cells were treated with 10 nm LMB for 2 h. Proteins were detected by indirect immunofluorescence using anti-HA or anti-FLAG antibodies. DNA was stained with DAPI. Scale bars, 20 μm.
Fig. 8.
Fig. 8.
Importin 13 has different binding modes for cargo proteins. A, HeLa cells were transfected with plasmids coding for GFP-tagged known importin 13 cargoes (Ubc9, Mago and eIF1A) or HA-tagged importin 13 cargo candidates (LPIN1, NELFCD, NSUN2) and FLAG-tagged wildtype (wt) or mutant importin 13 (mt1: E436R/D481R, mt2: E426R, mt3: K802E/R803E) or an empty vector (-FLAG-Imp13). Expressed proteins were detected by indirect immunofluorescence using anti-HA antibodies or directly via the GFP-tag. Scale bars, 20 μm. See supplemental Fig. S4 for DAPI staining and FLAG-Imp13 co-transfection. B, Dot plot of the log2-ratios of nuclear and cytoplasmic intensities of importin 13 cargo candidates with average values (green bars) and standard deviation (error bars). The number below each dot plot corresponds to the number of cells analyzed. Data were scored from a minimum of three independent experiments. ***, p value < 0.001.

References

    1. Beck M., and Hurt E. (2017) The nuclear pore complex: understanding its function through structural insight. Nat. Rev. Mol. Cell Biol. 18, 73–89 - PubMed
    1. Dickmanns A., Kehlenbach R. H., and Fahrenkrog B. (2015) Nuclear pore complexes and nucleocytoplasmic transport: from structure to function to disease. Int. Rev. Cell Mol. Biol. 320, 171–233 - PubMed
    1. Knockenhauer K. E., and Schwartz T. U. (2016) The nuclear pore complex as a flexible and dynamic gate. Cell 164, 1162–1171 - PMC - PubMed
    1. Schmidt H. B., and Görlich D. (2016) Transport selectivity of nuclear pores, phase separation, and membraneless organelles. Trends Biochem. Sci. 41, 46–61 - PubMed
    1. Fried H., and Kutay U. (2003) Nucleocytoplasmic transport: taking an inventory. Cell. Mol. Life Sci. 60, 1659–1688 - PMC - PubMed

Publication types