. 2018 May 1;115(18):E4284-E4293.
doi: 10.1073/pnas.1717308115. Epub 2018 Apr 16.

Drought delays development of the sorghum root microbiome and enriches for monoderm bacteria

Affiliations

Drought delays development of the sorghum root microbiome and enriches for monoderm bacteria

Ling Xu et al. Proc Natl Acad Sci U S A. .

Erratum in

Abstract

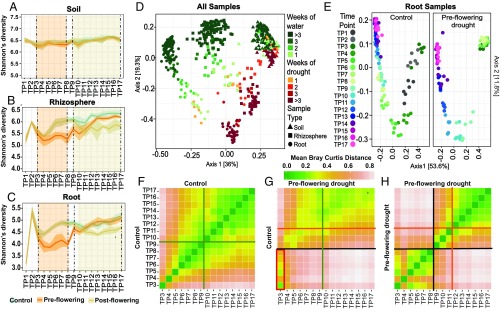
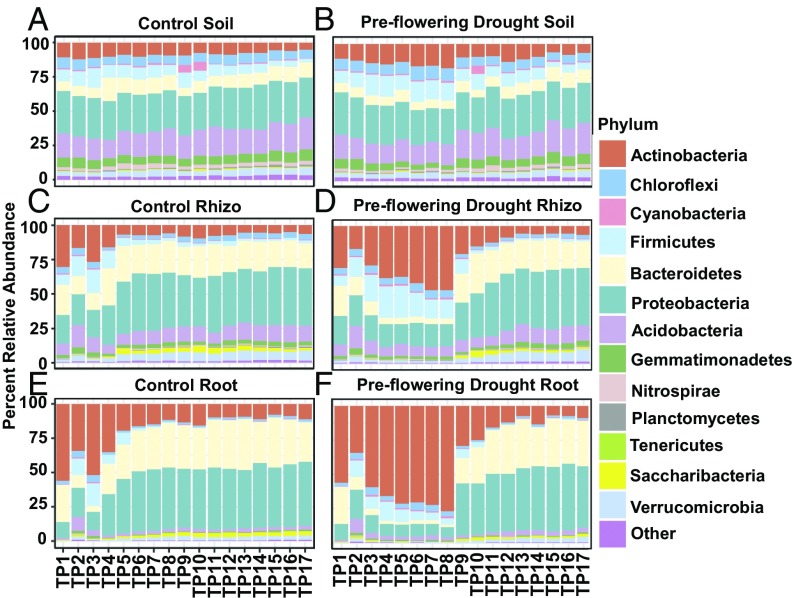
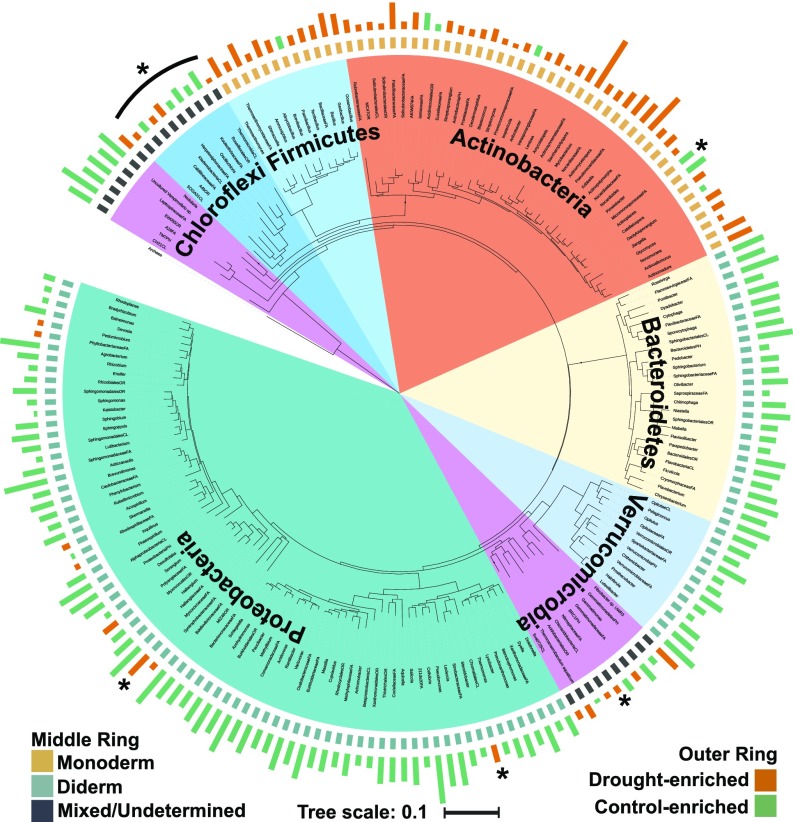
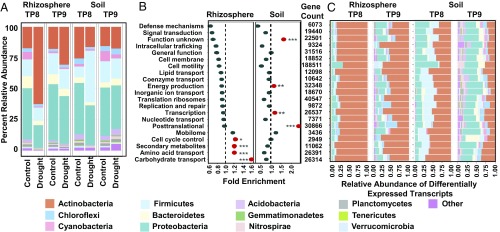
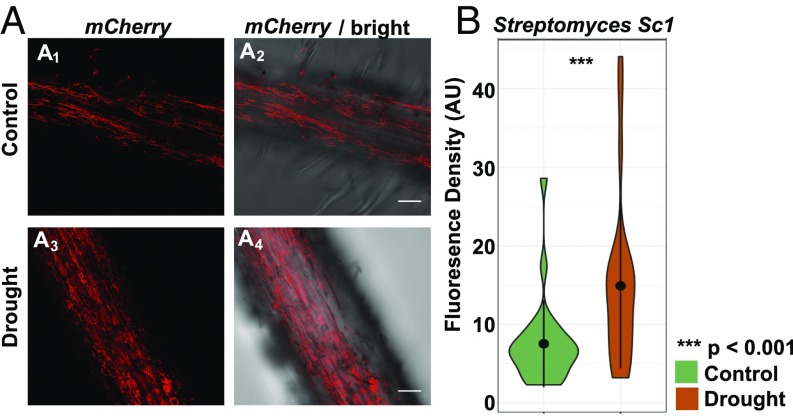
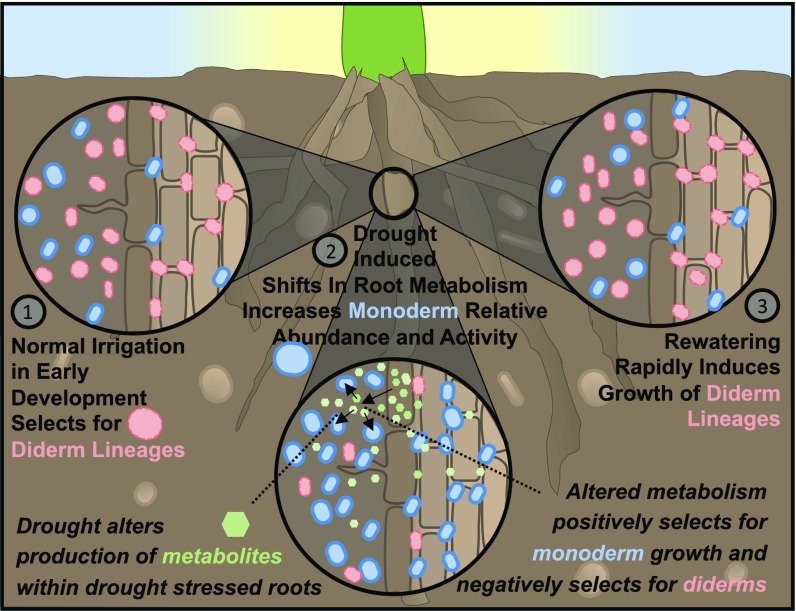
Drought stress is a major obstacle to crop productivity, and the severity and frequency of drought are expected to increase in the coming century. Certain root-associated bacteria have been shown to mitigate the negative effects of drought stress on plant growth, and manipulation of the crop microbiome is an emerging strategy for overcoming drought stress in agricultural systems, yet the effect of drought on the development of the root microbiome is poorly understood. Through 16S rRNA amplicon and metatranscriptome sequencing, as well as root metabolomics, we demonstrate that drought delays the development of the early sorghum root microbiome and causes increased abundance and activity of monoderm bacteria, which lack an outer cell membrane and contain thick cell walls. Our data suggest that altered plant metabolism and increased activity of bacterial ATP-binding cassette (ABC) transporter genes are correlated with these shifts in community composition. Finally, inoculation experiments with monoderm isolates indicate that increased colonization of the root during drought can positively impact plant growth. Collectively, these results demonstrate the role that drought plays in restructuring the root microbiome and highlight the importance of temporal sampling when studying plant-associated microbiomes.

Keywords: drought; metatranscriptome; microbiome; root; sorghum.


Conflict of interest statement

The authors declare no conflict of interest.

Figures

Fig. 1.
Fig. 1.
Drought impacts root microbiome development. Mean Shannon’s diversity across the soil (A), rhizosphere (B), and roots (C) at each time point under preflowering drought (orange lines), postflowering drought (yellow lines), and control (blue lines) treatments. The shaded areas above and below each line represent standard deviation from the mean. The orange- and yellow-shaded regions demarcated by vertical dashed lines indicate the periods in which preflowering drought and postflowering drought were applied, respectively. (D) PCoA of Bray Curtis distances for all control and preflowering drought samples. Soils (▲), rhizospheres (■), and root samples (●) are indicated. The color of each shape indicates the number of weeks of applied watering (shades of green) or drought treatment (shades of orange and red). (E) PCoA of Bray Curtis distances for all control and preflowering drought root samples colored by time point. Individual time points (TP1–TP17) are represented by distinct colors, with initial time points (TP1–TP2) shown as dark gray (control plot only), early time points (TP3–TP8) shown as shades of green, and late time points (TP9–TP17) shown as shades of blue and purple. (F–H) Heat maps of the mean pairwise Bray Curtis dissimilarity between all root sample replicates within the specified pairs of treatments and time points. A comparison of control samples versus control samples (F), a comparison of preflowering drought versus control samples (G), and a comparison of preflowering drought versus preflowering drought samples (H) are shown. Shades of green and pink represent low and high Bray Curtis distances, respectively. The orange and green lines indicate the mean flowering times in drought and control treatments, respectively, while the black lines represent the rewatering event at the end of drought treatment. (G, Lower Left) Red rectangle highlights the strong similarity between drought-treated samples at TP3–TP8 and the control treated samples belonging to TP3.
Fig. 2.
Fig. 2.
Relative abundance for the most abundant bacterial phyla. Percent relative abundance of the top 13 most abundant phyla for control (A, C, and E) and drought (B, D, and F) treatments across soils (A and B), rhizospheres (C and D), and roots (E and F). All time points (TP1–TP17) are arranged in order along the x axis in each panel.
Fig. 3.
Fig. 3.
Phylogenetic tree of all drought-enriched and -depleted root genera. The phylogenetic tree at the center of the figure was constructed from one representative OTU sequence from all genera that contained preflowering drought-enriched or -depleted OTUs in root samples. The inner colored ring represents the phylum each genus belongs to (legend as in Fig. 2). The middle ring indicates the expected status of each genus as belonging to phyla commonly considered monoderms (tan), to phyla commonly considered diderms (light blue), or to phyla for which monoderm status remains uncharacterized or is mixed (dark blue). The outer ring of colored bars represents the relative log2-fold enrichment (red) or depletion (blue) of each genus within drought-treated roots compared with control roots. The asterisks indicate select lineages that are elaborated upon in Discussion.
Fig. 4.
Fig. 4.
Drought impacts root microbiome transcription. (A) Percent relative abundance across the top 13 phyla for all transcripts in the metatranscriptome data for which taxonomies could be assigned from rhizospheres (Left) and soils (Right) for all control and drought-treated samples at TP8 and TP9. (B) GO enrichment analysis for all genes showing enrichment under drought for both rhizospheres (Left) and soils (Right) at TP8. The values on the x axis indicate the fold enrichment ratio of the relative percentages of genes up-regulated under drought in each category relative to the total relative percentage of genes in the corresponding category within the entire dataset. Categories for which there were fewer than five differentially expressed genes were omitted. The red circles indicate categories for which the enrichment had a P value of <0.05 in a hypergeometric test (*P ≤ 0.05; **P ≤ 0.01; ***P ≤ 0.001). (C) Relative abundance across the top 13 phyla for all transcripts for which taxonomies could be assigned and which showed differential expression by treatment from rhizospheres (Left) and soils (Right) at TP8 and TP9, separated according to GO categories (y axis). Categories for which there were fewer than five differentially expressed genes were omitted. The legend for colors used for each phylum is as in Fig. 2.
Fig. 5.
Fig. 5.
Streptomyces exhibit increased colonization of sorghum roots under drought. Confocal fluorescence (A1 and A3) and bright-field (A2 and A4) imaging of colonization of mCherry-tagged Streptomyces strain Sc1 on control (Top) and drought-treated (Bottom) roots of genotype RTx430. (Scale bars: 50 μm.) Violin plots of the fluorescence intensity are measured using confocal fluorescence microscopy across 24 control (green) and 24 drought-treated (orange) root samples. AU, arbitrary unit.
Fig. 6.
Fig. 6.
Proposed model for selection of monoderm lineages during drought in the root-associated microbiome. (1) Early plant root development selects for diderm lineages under normal irrigation. (2) Drought induces shifts in plant root metabolism, including increases in a range of carbohydrates, secondary metabolites, and amino acids. These shifts lead to exudation of these and possibly other metabolites, which, in turn, supports growth of specific lineages. Additionally, negative selection through an as yet unknown mechanism causes decreases in the absolute abundance of all bacteria, but with greater selection against cells with diderm cell wall characteristics. (3) Rewatering leads to a release from metabolite-mediated and other unknown selective pressures, allowing for rapid growth of diderms and a return to the pattern of root microbiome development and activity observed under control conditions.

Similar articles

Cited by

References

    1. Nie M, Bell C, Wallenstein MD, Pendall E. Increased plant productivity and decreased microbial respiratory C loss by plant growth-promoting rhizobacteria under elevated CO2. Sci Rep. 2015;5:9212. - PMC - PubMed
    1. Goh C-H, Veliz Vallejos DF, Nicotra AB, Mathesius U. The impact of beneficial plant-associated microbes on plant phenotypic plasticity. J Chem Ecol. 2013;39:826–839. - PMC - PubMed
    1. Edwards J, et al. Structure, variation, and assembly of the root-associated microbiomes of rice. Proc Natl Acad Sci USA. 2015;112:E911–E920. - PMC - PubMed
    1. Lundberg DS, et al. Defining the core Arabidopsis thaliana root microbiome. Nature. 2012;488:86–90. - PMC - PubMed
    1. Hartman K, van der Heijden MG, Roussely-Provent V, Walser J-C, Schlaeppi K. Deciphering composition and function of the root microbiome of a legume plant. Microbiome. 2017;5:2. - PMC - PubMed

Publication types

MeSH terms

LinkOut - more resources