

Global shifts in the phenological synchrony of species interactions over recent decades
- PMID: 29666247
- PMCID: PMC5960279
- DOI: 10.1073/pnas.1714511115
Global shifts in the phenological synchrony of species interactions over recent decades
Abstract
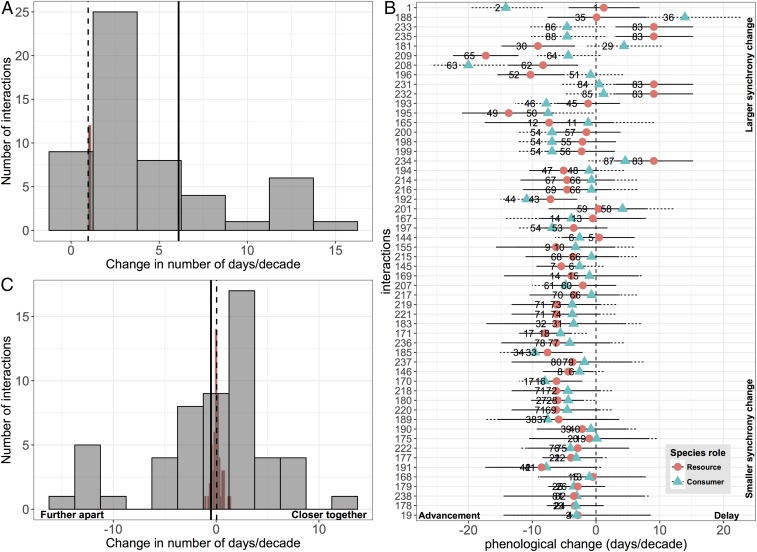
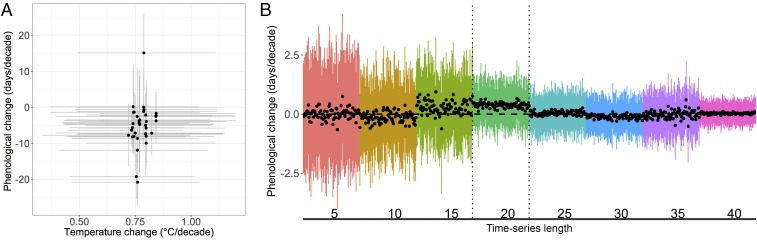
Phenological responses to climate change (e.g., earlier leaf-out or egg hatch date) are now well documented and clearly linked to rising temperatures in recent decades. Such shifts in the phenologies of interacting species may lead to shifts in their synchrony, with cascading community and ecosystem consequences. To date, single-system studies have provided no clear picture, either finding synchrony shifts may be extremely prevalent [Mayor SJ, et al. (2017) Sci Rep 7:1902] or relatively uncommon [Iler AM, et al. (2013) Glob Chang Biol 19:2348-2359], suggesting that shifts toward asynchrony may be infrequent. A meta-analytic approach would provide insights into global trends and how they are linked to climate change. We compared phenological shifts among pairwise species interactions (e.g., predator-prey) using published long-term time-series data of phenological events from aquatic and terrestrial ecosystems across four continents since 1951 to determine whether recent climate change has led to overall shifts in synchrony. We show that the relative timing of key life cycle events of interacting species has changed significantly over the past 35 years. Further, by comparing the period before major climate change (pre-1980s) and after, we show that estimated changes in phenology and synchrony are greater in recent decades. However, there has been no consistent trend in the direction of these changes. Our findings show that there have been shifts in the timing of interacting species in recent decades; the next challenges are to improve our ability to predict the direction of change and understand the full consequences for communities and ecosystems.
Keywords: baseline; global warming; mismatch; time series; trophic interactions.
Conflict of interest statement
The authors declare no conflict of interest.
Figures
Comment in
-
Adaptive and nonadaptive changes in phenological synchrony.Proc Natl Acad Sci U S A. 2018 May 15;115(20):5057-5059. doi: 10.1073/pnas.1805698115. Epub 2018 Apr 30. Proc Natl Acad Sci U S A. 2018. PMID: 29712854 Free PMC article. No abstract available.
References
-
- Thackeray SJ, et al. Phenological sensitivity to climate across taxa and trophic levels. Nature. 2016;535:241–245. - PubMed
-
- Høye TT, Post E, Meltofte H, Schmidt NM, Forchhammer MC. Rapid advancement of spring in the high Arctic. Curr Biol. 2007;17:R449–R451. - PubMed
-
- Both C, van Asch M, Bijlsma RG, van den Burg AB, Visser ME. Climate change and unequal phenological changes across four trophic levels: Constraints or adaptations? J Anim Ecol. 2009;78:73–83. - PubMed
Publication types
MeSH terms
LinkOut - more resources
Full Text Sources
Other Literature Sources
Medical
Miscellaneous
