. 2018 May 1;115(18):E4274-E4283.
doi: 10.1073/pnas.1720795115. Epub 2018 Apr 16.

Desynchronization of slow oscillations in the basal ganglia during natural sleep

Affiliations

Desynchronization of slow oscillations in the basal ganglia during natural sleep

Aviv D Mizrahi-Kliger et al. Proc Natl Acad Sci U S A. .

Abstract

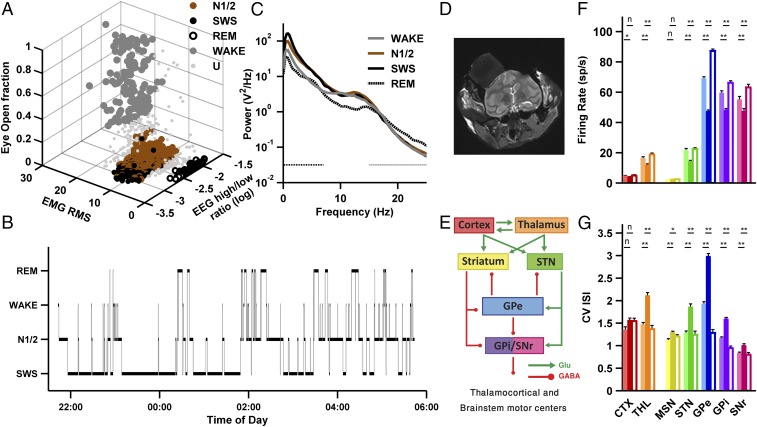
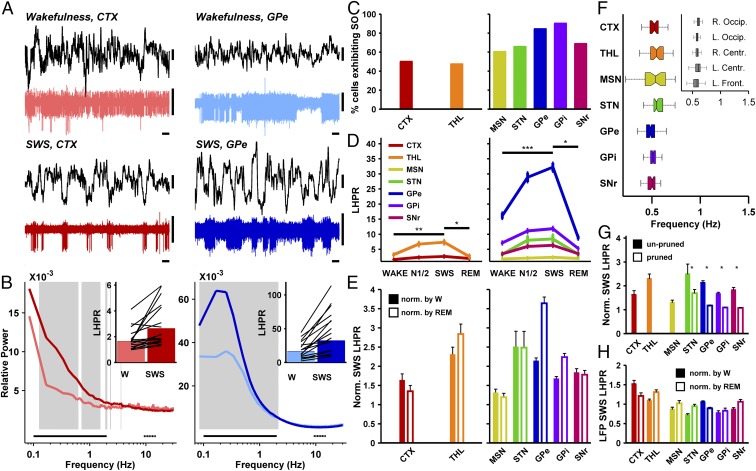
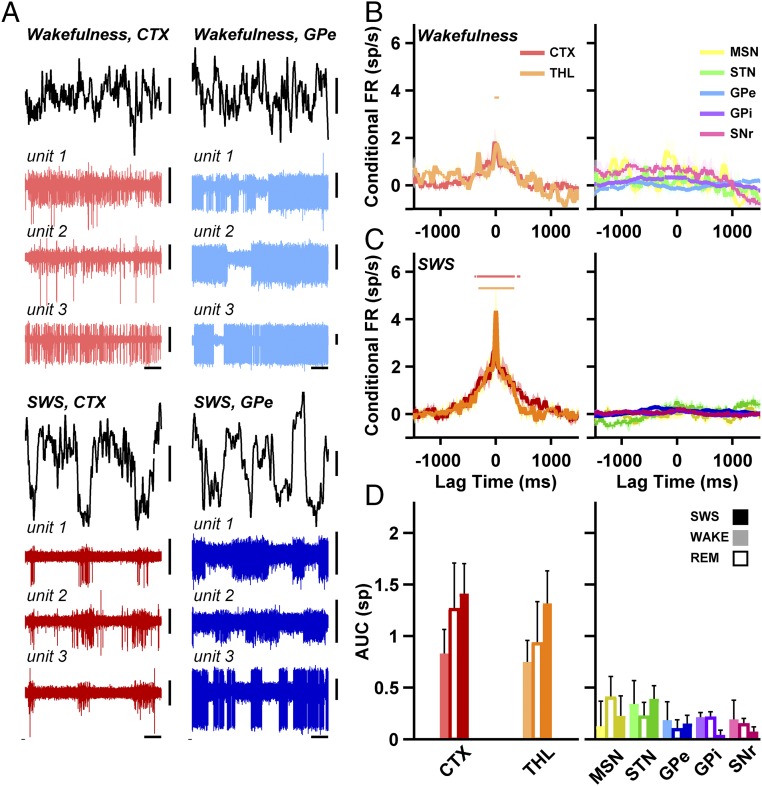
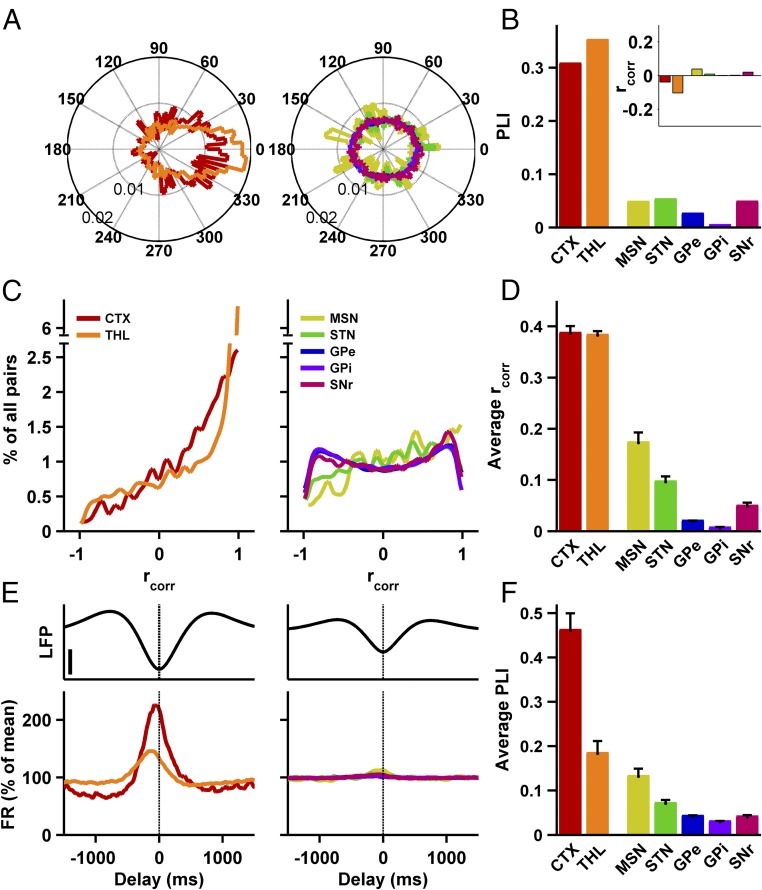
Slow oscillations of neuronal activity alternating between firing and silence are a hallmark of slow-wave sleep (SWS). These oscillations reflect the default activity present in all mammalian species, and are ubiquitous to anesthesia, brain slice preparations, and neuronal cultures. In all these cases, neuronal firing is highly synchronous within local circuits, suggesting that oscillation-synchronization coupling may be a governing principle of sleep physiology regardless of anatomical connectivity. To investigate whether this principle applies to overall brain organization, we recorded the activity of individual neurons from basal ganglia (BG) structures and the thalamocortical (TC) network over 70 full nights of natural sleep in two vervet monkeys. During SWS, BG neurons manifested slow oscillations (∼0.5 Hz) in firing rate that were as prominent as in the TC network. However, in sharp contrast to any neural substrate explored thus far, the slow oscillations in all BG structures were completely desynchronized between individual neurons. Furthermore, whereas in the TC network single-cell spiking was locked to slow oscillations in the local field potential (LFP), the BG LFP exhibited only weak slow oscillatory activity and failed to entrain nearby cells. We thus show that synchrony is not inherent to slow oscillations, and propose that the BG desynchronization of slow oscillations could stem from its unique anatomy and functional connectivity. Finally, we posit that BG slow-oscillation desynchronization may further the reemergence of slow-oscillation traveling waves from multiple independent origins in the frontal cortex, thus significantly contributing to normal SWS.

Keywords: basal ganglia; desynchronization; nonhuman primate; sleep; slow oscillations.


Conflict of interest statement

The authors declare no conflict of interest.

Figures

Fig. 1.
Fig. 1.
Polysomnography, electrophysiological targets, and basic discharge features of the basal ganglia and thalamocortical networks. (A) A typical example of the output of the semiautomatic sleep staging algorithm for one night (monkey D). The algorithm was used to cluster the different sleep stages (wakefulness, N1/2, SWS, and REM sleep) by high/low EEG power ratio, EMG activity (see also Fig. S2), and eye-open ratio (Materials and Methods). (B) A typical hypnogram depicting the succession of sleep stages for a single night (monkey D). (C) Power spectrum density histogram of EEG activity (C4 electrode) for all epochs of a representative night (monkey N) reveals differences between sleep stages. N1/2 and SWS show increased power in the slow-oscillation range as well as in the spindle (11 to 16 Hz) range. Black dash-dotted and gray dotted horizontal lines indicate the low- (0.1 to 7 Hz) and high- (15 to 25 Hz) frequency ranges, respectively, used for calculating the high/low EEG power ratio. (D) A coronal section (∼anterior commissure −6 mm) from the postoperative MRI scan showing the brain and the recording chamber (gray box above left hemisphere, monkey N). (E) Box and arrow schematic model of the functional anatomy of the TC and BG networks. The color scheme used here is used in all subsequent plots. (F) Average firing rate in different brain structures, for wakefulness (light bars), SWS (dark bars), and REM sleep (empty bars). (G) Average coefficient of variation (CV) of the distribution of interspike intervals (ISIs) in different brain structures and sleep stages. For F and G, n = 66, 96, 72, 94, 321, 175, and 85 for the cortex, thalamus, MSN, STN, GPe, GPi, and SNr. Horizontal bars indicate statistical comparisons of wakefulness vs. SWS and REM sleep vs. SWS. n, nonsignificant; *P < 0.05, **P < 5 × 10⁻⁴, Wilcoxon signed-rank test, Bonferroni-corrected. Error bars represent SEM. CTX, cortex; GABA, γ-aminobutyric acid; Glu, glutamate; THL, thalamus; U, unclassified.
Fig. 2.
Fig. 2.
Slow oscillations in firing rate during SWS in the basal ganglia are at least as prominent as in the thalamocortical network. (A) Typical examples of cortical and GPe unit activity during wakefulness and SWS, both recorded simultaneously with cortical-depth EEG (LFP, black). Horizontal bars, 1 s; vertical bars, 100 µV. (B) Average relative power spectra of cortical (Left) and GPe (Right) firing rate during wakefulness (light trace) and SWS (dark trace). Gray background represents frequency ranges where SWS relative power was significantly higher than during wakefulness (Mann–Whitney U test, FDR correction for multiple comparisons, P < 0.05). (B, Insets) Low (0.1 to 2 Hz; solid black line in main panel) to high (9 to 15 Hz; dashed black line) power ratios for wakefulness and SWS, across cortical or GPe cells. Bars indicate average LHPR for all neurons, and black lines represent LHPRs for 20 randomly selected neurons. For B, C, and H: n = 66, 96, 72, 94, 321, 175, and 85 neurons or LFP recording sites. (C) Percent of cells exhibiting slow oscillations in the TC (Left) and BG (Right) networks during SWS (out of cells recorded during SWS). (D) Average LHPRs over all sleep stages in the TC (Left) and BG (Right) networks, for cells exhibiting slow oscillations. For DG: n = 27, 43, 41, 61, 257, 154, and 57 neurons. *P < 0.05, **P < 0.001, ***P < 10−5. SWS vs. N1/2: P < 0.05 for MSN, GPe, GPi, and SNr; others nonsignificant, Wilcoxon signed-rank test, Bonferroni-corrected. (E) Average LHPRs for the TC and BG, during SWS, normalized by either mean wakefulness LHPR (filled bars) or mean REM LHPR (empty bars). Wakefulness normalization: All comparisons were nonsignificant except thalamus vs. MSN, P < 5 × 10⁻³. REM normalization: cortex vs. GPe, GPi, and SNr, P < 0.05; thalamus vs. MSN and SNr, P < 5 × 10⁻⁵. All other comparisons were nonsignificant. Mann–Whitney U test, Bonferroni-corrected. (F) SWS slow-oscillation frequency per structure. (F, Inset) EEG slow-oscillation frequency. (G) SWS LHPRs (normalized by mean wakefulness LHPR) before and after random spike pruning of BG high-frequency discharge neurons (Fig. S6). Before vs. after pruning, P < 0.05 for all four structures, Wilcoxon signed-rank test, Bonferroni-corrected. *P < 5 × 10⁻⁴, Wilcoxon signed-rank test, power ratio vs. 1. (H) LFP SWS LHPRs, normalized by mean wakefulness LHPR (filled bars) or by mean REM LHPR (empty bars) for all recording sites in the TC and BG networks. Wakefulness-normalized LFP LHPR was higher than 1 for the cortex (P < 5 × 10⁻⁵) and lower than 1 (P < 5 × 10⁻³) for all BG structures except the GPe (Wilcoxon signed-rank test, Bonferroni-corrected). REM sleep normalization of LFP LHPRs yielded similar results. Error bars represent SEM. SO, slow oscillations; W, wakefulness.
Fig. 3.
Fig. 3.
Unlike the thalamus and cortex, spike-to-spike correlations in the basal ganglia are absent even during SWS. (A) Typical examples of multielectrode simultaneous recording of three neurons in the TC and BG networks during wakefulness and SWS (units 1 to 3 in Upper and Lower are not the same). Horizontal bars, 1 s; vertical bars, 100 µV. (B) Average spike-to-spike correlation histograms in the TC (Left) and BG (Right) networks during wakefulness. The firing rate was smoothed and normalized such that the mean background firing was 0 for all nuclei. Colored horizontal lines represent delays where the cross-correlogram was significantly higher than one spike per s. Numbers of pairs: n = 34, 89, 17, 41, 496, 348, and 60 for the seven structures. Wilcoxon signed-rank test, FDR-corrected for multiple comparisons, P < 0.05. (C) Same as B, only for SWS (n = 42, 114, 23, 55, 575, 404, and 73 pairs). (D) Area under the curve (AUC) for 1,500 ms around the trigger spike in the cross-correlation histograms. Light, empty, and dark bars are for wakefulness, REM, and SWS (wakefulness and SWS numbers of pairs as in B and C; REM numbers of pairs: n = 19, 47, 7, 27, 347, 281, and 46). AUC for TC group vs. BG group, one-way ANOVA, planned contrasts; SWS: df = (6, 1,280), P < 5 × 10⁻⁶; wakefulness: df = (6, 1,079), P < 5 × 10⁻⁴; REM: df = (6, 768), P < 5 × 10⁻³. Continuous shading around the traces in B and C and error bars in D represent SEM. FR, firing rate.
Fig. 4.
Fig. 4.
Slow oscillations in the basal ganglia are desynchronized between cells and decoupled from the LFP. (A) Polar histograms of phase differences between slow-oscillation peaks of simultaneously recorded cells in the TC (Left) and BG (Right) networks. Circle radii, marked on circles, indicate relative proportions of phases in 4.8° bins (n = 565, 4,916, 699, 2,593, 170,098, 98,942, and 7,875 slow-wave pairs, for the seven structures, for all data in AD). (B) Phase-lock index for the distribution of phase differences. Thalamus or cortex vs. each of the BG structures, two-group concentration homogeneity test, P < 5 × 10⁻¹⁴, Bonferroni-corrected. (B, Inset) Pearson correlation coefficients of the correlation between phase difference and intercell distance, for all BG and TC structures. (C) Distribution of Pearson correlation coefficients between concurrent slow-oscillation waveforms. Note the break of the y axis for the thalamus trace (Left). (D) Mean population Pearson correlation coefficient. Mann–Whitney U test, thalamus or cortex vs. each of the BG structures, P < 5 × 10⁻¹⁷, Bonferroni-corrected. (E) Unit discharge rate around the trough of concurrent LFP slow oscillation in TC (Left) and BG (Right) neurons exhibiting slow oscillations (smoothed and averaged across units). (E, Upper) Average traces of LFP slow oscillation. Vertical bar, 50 µV. Firing rate for every unit is calculated as the percent of the average firing rate of the unit. For E and F: n = 27, 43, 41, 61, 257, 154, and 57 neurons for the seven structures. (F) PLI of the distribution of single-spike phases in relation to the concurrent LFP slow oscillation, for all structures, averaged across cells. Mann–Whitney U test, cortex vs. each of the BG structures, P < 1 × 10⁻⁷, Bonferroni-corrected. Thalamus vs. GPe, GPi, and SNr, P < 5 × 10⁻⁴; thalamus vs. MSN and STN, nonsignificant, Bonferroni-corrected. Error bars in D and F represent SEM.

References

    1. Nir Y, Massimini M, Boly M, Tononi G. Sleep and consciousness. In: Cavanna AE, Nani A, Blumenfeld H, Laureys S, editors. Neuroimaging of Consciousness. Springer; Berlin: 2013. pp. 133–182.
    1. Timofeev I, Grenier F, Steriade M. Disfacilitation and active inhibition in the neocortex during the natural sleep-wake cycle: An intracellular study. Proc Natl Acad Sci USA. 2001;98:1924–1929. - PMC - PubMed
    1. Destexhe A, Contreras D, Steriade M. Spatiotemporal analysis of local field potentials and unit discharges in cat cerebral cortex during natural wake and sleep states. J Neurosci. 1999;19:4595–4608. - PMC - PubMed
    1. Steriade M, Contreras D, Curró Dossi R, Nuñez A. The slow (< 1 Hz) oscillation in reticular thalamic and thalamocortical neurons: Scenario of sleep rhythm generation in interacting thalamic and neocortical networks. J Neurosci. 1993;13:3284–3299. - PMC - PubMed
    1. Wolansky T, Clement EA, Peters SR, Palczak MA, Dickson CT. Hippocampal slow oscillation: A novel EEG state and its coordination with ongoing neocortical activity. J Neurosci. 2006;26:6213–6229. - PMC - PubMed

Publication types

LinkOut - more resources