. 2018 Apr 17;9(1):1504.
doi: 10.1038/s41467-018-03719-6.

Improved calcium sensor GCaMP-X overcomes the calcium channel perturbations induced by the calmodulin in GCaMP

Affiliations

Improved calcium sensor GCaMP-X overcomes the calcium channel perturbations induced by the calmodulin in GCaMP

Yaxiong Yang et al. Nat Commun. .

Abstract

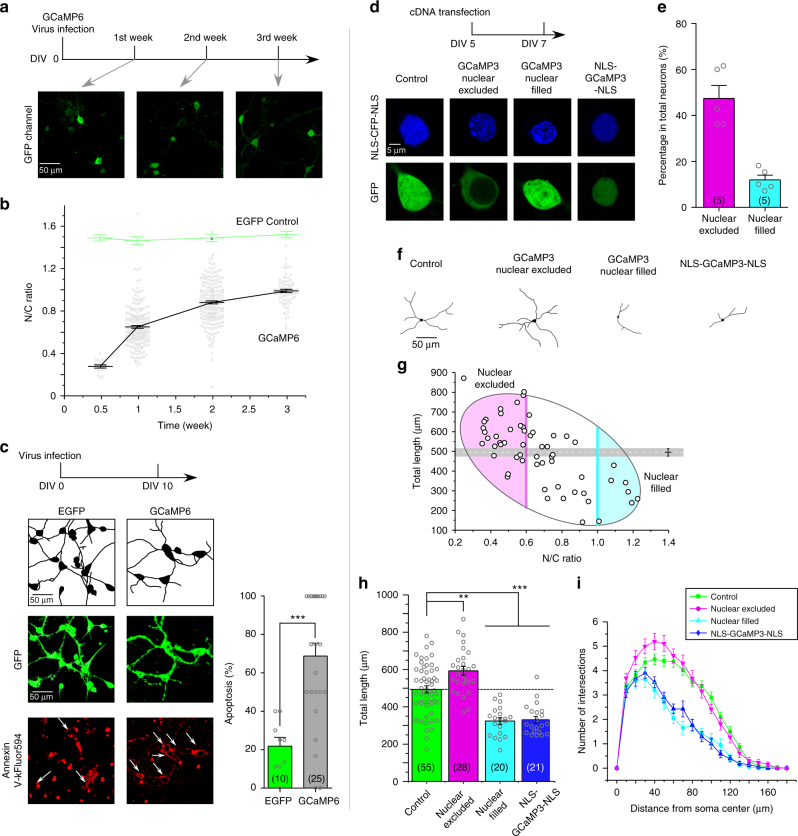
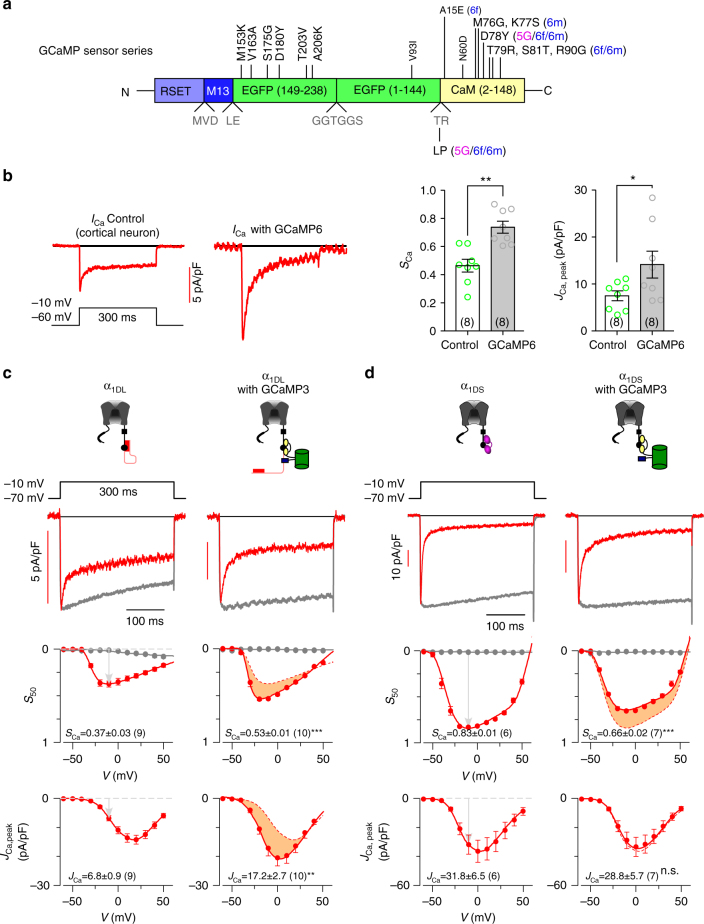
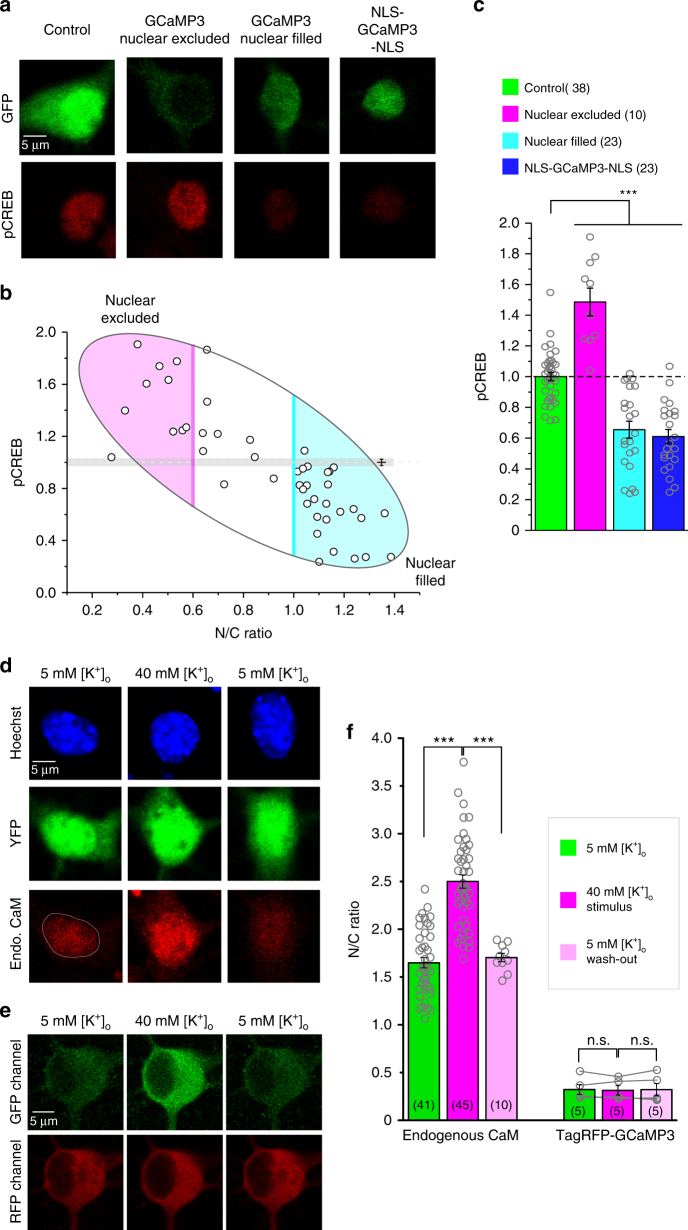
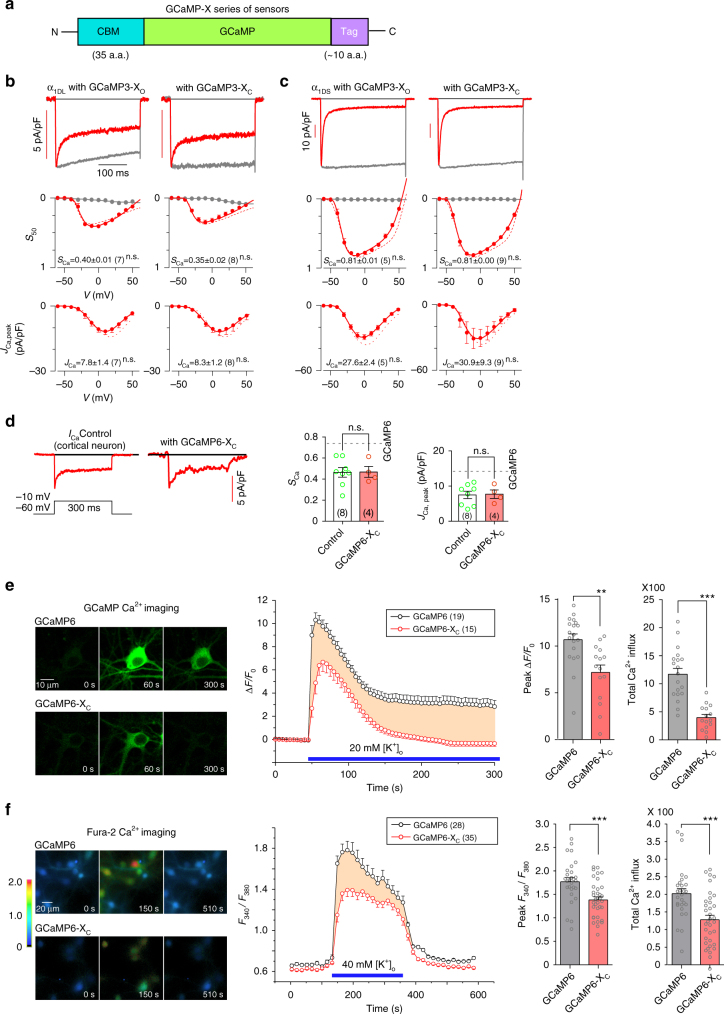
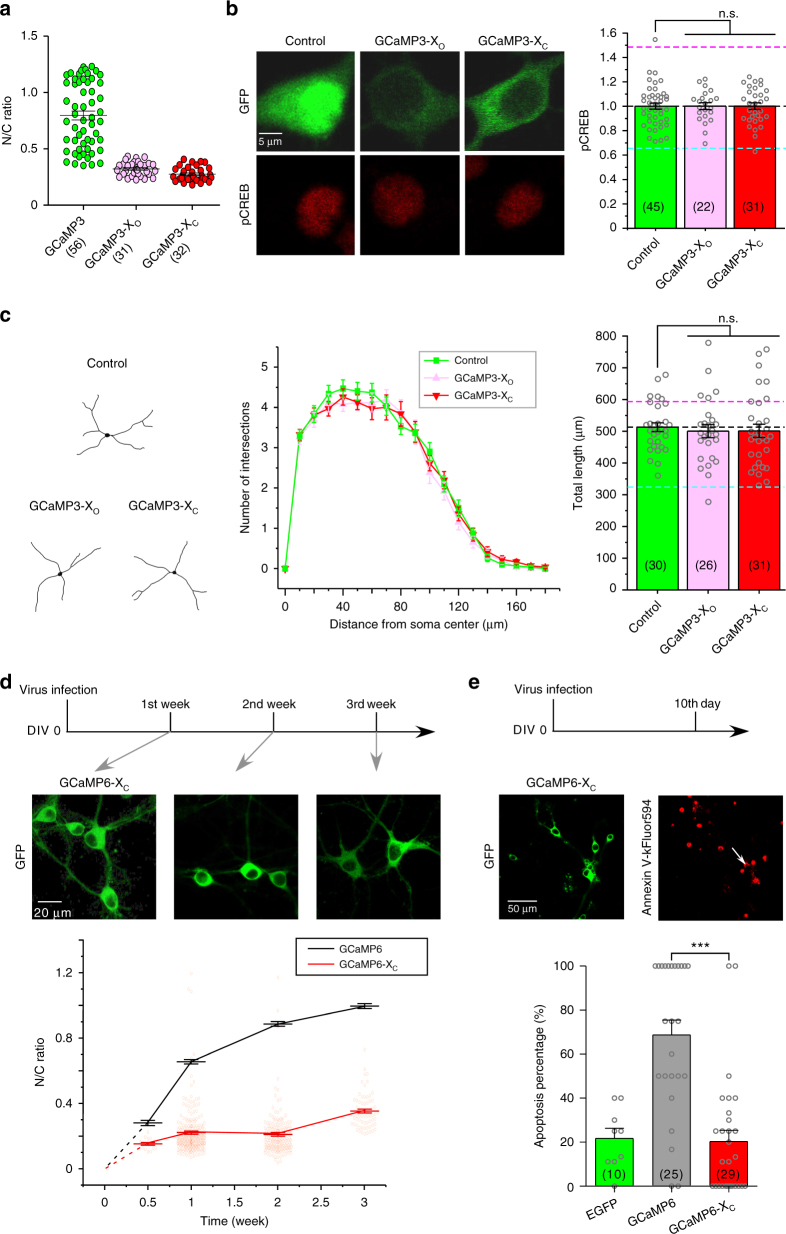
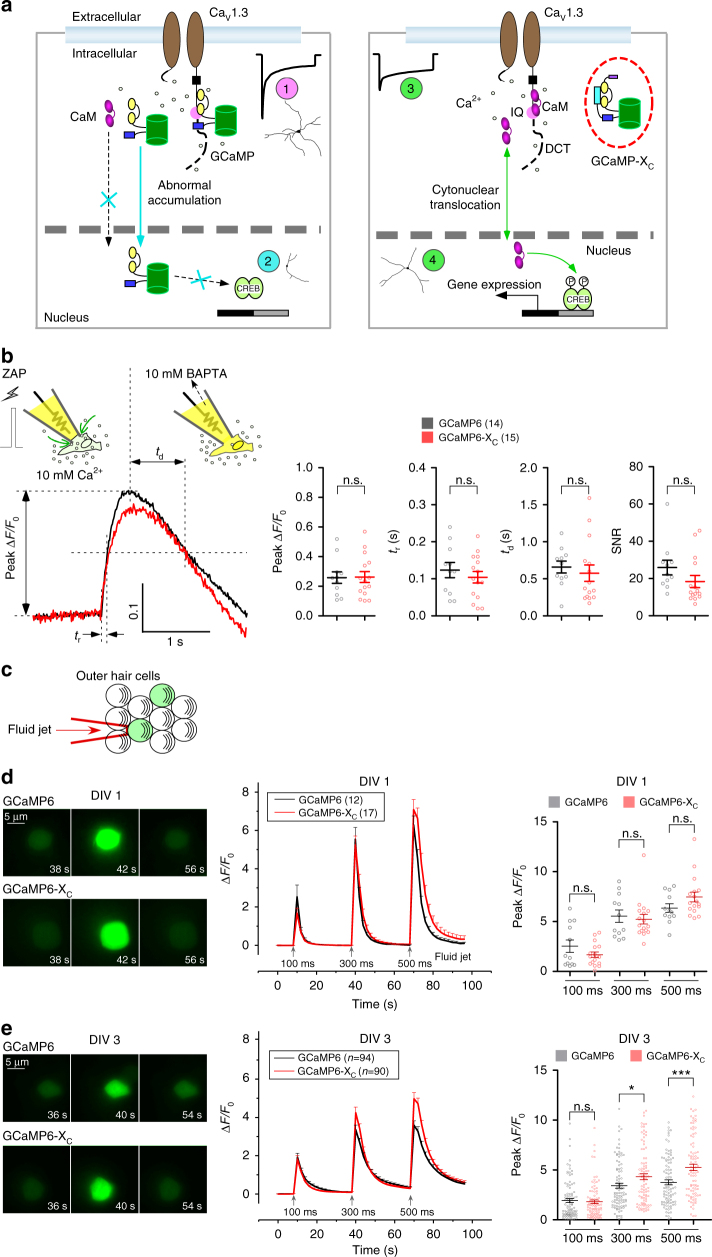
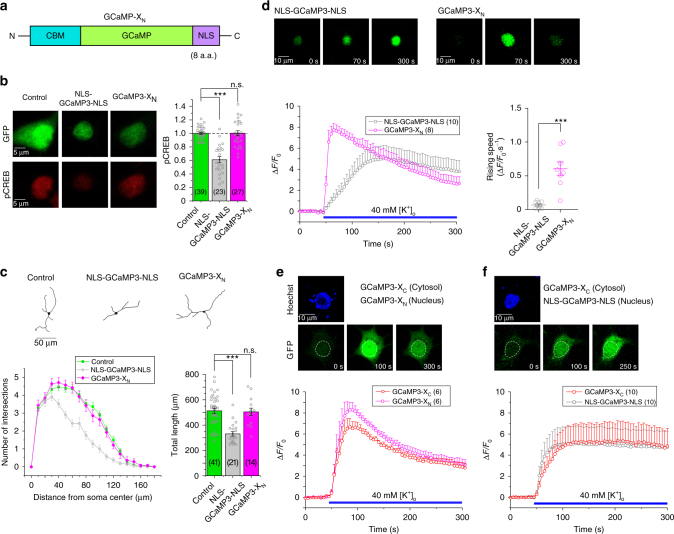
GCaMP, one popular type of genetically-encoded Ca2+ indicator, has been associated with various side-effects. Here we unveil the intrinsic problem prevailing over different versions and applications, showing that GCaMP containing CaM (calmodulin) interferes with both gating and signaling of L-type calcium channels (CaV1). GCaMP acts as an impaired apoCaM and Ca2+/CaM, both critical to CaV1, which disrupts Ca2+ dynamics and gene expression. We then design and implement GCaMP-X, by incorporating an extra apoCaM-binding motif, effectively protecting CaV1-dependent excitation-transcription coupling from perturbations. GCaMP-X resolves the problems of detrimental nuclear accumulation, acute and chronic Ca2+ dysregulation, and aberrant transcription signaling and cell morphogenesis, while still demonstrating excellent Ca2+-sensing characteristics partly inherited from GCaMP. In summary, CaM/CaV1 gating and signaling mechanisms are elucidated for GCaMP side-effects, while allowing the development of GCaMP-X to appropriately monitor cytosolic, submembrane or nuclear Ca2+, which is also expected to guide the future design of CaM-based molecular tools.


Conflict of interest statement

The authors declare no competing interests.

Figures

Fig. 1
Fig. 1
Side-effects of GCaMP on cortical neurons. a Abnormal nuclear accumulation of GCaMP. Cultured cortical neurons infected with GCaMP6 (AAV-Syn-GCaMP6f) virus were examined with confocal live-cell imaging. b Analyses indexed with nuclear/cytosolic (N/C) fluorescence ratio indicate time-dependent nuclear accumulation of GCaMP6, in contrast to stable GFP distribution. c GCaMP6 caused apoptosis. For cortical neurons infected with AAV-Syn-EGFP and AAV-Syn-GCaMP6f (green), tracing images of dendritic morphology (black and white) and confocal fluorescence images of Annexin V-kFluor594 (red) are shown. Arrows are to identify apoptotic neurons where both green and red fluorescence are present and the percentage of such neurons (per view) are counted (right, number of views in parentheses). d Subcellular distributions of YFP, GCaMP3 or NLS-GCaMP3-NLS overexpressed in cortical neurons. CFP fluorescence (NLS-CFP-NLS, upper) indicates the nucleus (blue) in cortical neurons. GFP images (lower row) of neurons expressing GCaMP3 (2 days after cDNA transfection) could be categorized into two major subgroups of interest: nuclear-excluded (N/C ratio < 0.6) and nuclear-filled (N/C ratio > 1.0), with the latter mimicked by neurons expressing NLS-GCaMP3-NLS. Such criteria (N/C ratio < 0.6 and >1) were applied throughout this study (unless indicated otherwise). e Based on the above criteria neurons of nuclear-filled group and nuclear-excluded group accounted for ~10% and ~50% of the total number of GCaMP3-expressing neurons, respectively (5 experiments). f Representative images tracing neurite morphology for cortical neurons from different subgroups. g Correlations between N/C ratio of GCaMP3 and neurite outgrowth. The grey line/area represents the total neurite length per neuron (control group). The eclipse enclosing most neurons contains two major areas representing the subgroups of nuclear-filled (cyan) and nuclear-excluded (pink). Nuclear GCaMP accumulation (N/C ratio) and neurite outgrowth (neurite length per neuron) are highly correlated (the correlation coefficient is −0.7). h, i Additional experiments and analyses for neurite morphology. Neurite outgrowth was quantified for the four subgroups by neurite length (h) and Sholl analysis (i), with the total number of cells in parentheses. Standard error of the mean (S.E.M.) and Student’s t-test (two-tailed unpaired with criteria of significance: *p < 0.05; **p < 0.01, and p < 0.001) were calculated when applicable
Fig. 2
Fig. 2
GCaMP interferes with CaV1.3 gating. a Schematic summary of GCaMP series. Upgrades of GCaMP (from GCaMP3 to GCaMP5 and GCaMP6) were achieved by mutations of the EGFP and CaM domains at the sites indicated by vertical letters (GCaMP3 vs. GCaMP), or by horizontal letters (GCaMP5G/6f/6m vs. GCaMP3). Details see Supplementary Fig. 1. b Effects on ICa were examined for neurons infected with AAV-Syn-GCaMP6f. Representative traces of Ca2+ current (left), SCa and JCa analyses (right) for native CaV1.3 in cortical neurons expressing GCaMP6. Neurons were treated with a cocktail recipe to isolate CaV1 current (mostly CaV1.3) and recorded at the membrane potential (V) of −10 mV. SCa (quantified as 1−ICa,50 /ICa, peak, where ICa,50 and ICa, peak represent the currents measured at 50 ms and the instantaneous peak, respectively) and JCa (pA/pF, the current density of ICa, peak) serve as the indices for CDI and VGA respectively. c Effects of GCaMP3 on recombinant α1DL. Representative Ca2+ current traces were compared for ICa recorded from HEK293 cells expressing long variant α1DL alone (left), or with GCaMP3 (right) at −10 mV. Ba2+ currents (rescaled) and Ca2+ currents (ICa) were shown as grey and red traces, respectively, with scale bars indicative of ICa amplitudes. CDI (SCa) and VGA (JCa) profiles at different membrane potentials are compared between α1DL control and α1DL overexpressed with GCaMP3 (differences highlighted by orange areas). d Effects of GCaMP3 on recombinant α1DS alone (left), or with GCaMP3 (right), in a similar fashion to c. Standard error of the mean (S.E.M.) and Student’s t-test (two-tailed unpaired with criteria of significance: *p < 0.05; **p < 0.01 and, ***p < 0.001) were calculated when applicable, and n.s. denotes “not significant”
Fig. 3
Fig. 3
GCaMP perturbs CaV1-dependent E–T coupling. a GCaMP3 effects on CREB signaling. Cortical neurons (DIV 5) were transfected with YFP, GCaMP3 or NLS-GCaMP3-NLS for 2 days, then stained with pCREB antibodies under basal conditions. Green fluorescence represents the distributions of protein expression (upper) and red staining represents the levels of pCREB signals (lower), for all the four groups of neurons: YFP control, GCaMP3 nuclear excluded, GCaMP3 nuclear filled, and NLS-GCaMP3-NLS. b High correlation between subcellular localization of GCaMP3 (N/C ratio) and pCREB signals in cortical neurons expressing GCaMP3 (correlation coefficient = −0.8). Shades of areas indicate the neurons in the nuclear-excluded group (pink) and the nuclear-filled group (cyan). c Statistical summary of basal pCREB intensities. All neurons were normalized by the average value of pCREB fluorescence intensities calculated from the control group. df Cytonuclear translocations of CaM and GCaMP3 by confocal imaging. Endogenous CaM of cortical neurons translocated into nucleus under 5 min of 40 mM [K+]o stimulation, and recovered to the resting state when washed back by 2 h of 5 mM [K+]o (d). Representative images of fixed neurons for Hoechst (blue, indicating nucleus), YFP (indicating soma) and endogenous CaM (red, staining of CaM antibodies) at three different time points are shown in order (before 40 mM [K+]o, at the end of 5 min of 40 mM [K+]o stimulation, after washed back to 5 mM [K+]o for 2 h). 1 μM TTX was added throughout the experimental protocol in order to examine subthreshold activities of CaV1 channels. For comparison, neurons expressing TagRFP-GCaMP3 were similarly excited and monitored, during which localizations of GCaMP3 were confirmed by fluorescent TagRFP (e). RFP fluorescence at three representative time points (resting, stimulation, and wash-out) was analyzed with the index of N/C ratio and compared (paired Student’s t-test) for GCaMP3 localization, in addition to endogenous CaM (f). Standard error of the mean (S.E.M.) and Student’s t-test (two-tailed unpaired with criteria of significance: *p < 0.05; **p < 0.01, and p < 0.001) were calculated when applicable, and n.s. denotes “not significant”
Fig. 4
Fig. 4
Design principles and basic validations of new GCaMP-X sensors. a Design principles of GCaMP-X. CaM binding motif (CBM) was fused onto N-terminus of GCaMP to tightly bind apoCaM at rest but with relatively low affinity (e.g., much lower than the M13 motif) to Ca2+/CaM, as the central strategy for GCaMP-X design. Also, additional tags of NES (nuclear export signal), NLS (nuclear localization signal) and MTS (membrane targeting signal) motifs could be appended onto C-terminus (or N-terminus), to control specific subcellular localization of GCaMP. Accordingly, a series of GCaMP-X sensors were developed, in addition to GCaMP-XO without any tag, including GCaMP-XC, GCaMP-XN, and GCaMP-XM, tagged with NES, NLS, and MTS respectively. b, c Design validation with GCaMP3 and recombinant CaV1.3 channels. Neither CDI nor VGA of α1DL channels (b) and α1DS channels (c) were altered by GCaMP3-XO or GCaMP3-XC overexpressed in HEK293 cells, as demonstrated by ICa exemplars (top) and voltage-dependent CDI (middle) and VGA (bottom) profiles. d Validation of GCaMP6m-XC with neuronal CaV1.3 channels. Effects of GCaMP6-XC on α1DL gating were examined in cortical neurons infected with AAV-Syn-GCaMP6m-XC, indexed with SCa and JCa. Dotted lines represent GCaMP6f profiles (Fig. 2b). e, f GCaMP-X eliminated perturbations on subthreshold Ca2+ dynamics. For cortical neurons infected with AAV-Syn-GCaMP6m or AAV-Syn-GCaMP6m-XC, confocal fluorescent images depict Ca2+ dynamics in response to extracellular stimuli of 20 mM [K+]o, indexed by normalized fluorescence changes (ΔF/F0). Exemplar images (left), averaged curves of ΔF/F0 (middle) and statistical summary (right) are shown for GCaMP6m and GCaMP6m-XC. Particularly, peak ΔF/F0 and total calcium influx (rightmost, area integral within 300 s, in the units of ΔF/F0·s) were evaluated and compared (e). To confirm, similar experiments and analyses were performed with Fura-2 ratiometric Ca2+ imaging, indexed with fluorescence emission ratio F340/F380 achieved from 340 nm and 380 nm excitation (f). Standard error of the mean (S.E.M.) and Student’s t-test (two-tailed unpaired with criteria of significance: *p < 0.05; **p < 0.01, and ***p < 0.001) were calculated when applicable, and n.s. denotes “not significant”
Fig. 5
Fig. 5
Additional validations of GCaMP-X. a Nuclear accumulation was substantially relieved for cortical neurons transfected with GCaMP-X. N/C fluorescence ratios indicative of GCaMP distributions in cortical neurons (DIV 5) were quantified 2 days after being transfected with GCaMP3, GCaMP3-XO or GCaMP3-XC. b GCaMP-X sensors no longer perturbed pCREB signals. For cortical neurons transfected with YFP, GCaMP3-XO or GCaMP3-XC, fluorescence of pCREB immunostaining (left) was normalized and compared (right). Dotted lines represent the mean values from nuclear-excluded GCaMP3 (pink) or nuclear-filled GCaMP3 (cyan) neurons, respectively (adopted from Fig. 3c). c Dysregulations of neurite outgrowth were diminished with GCaMP-X. Based on neurite tracing images (left), Sholl analysis (middle) and measurement of neurite length (right) were performed for cortical neurons transfected with YFP, GCaMP3-XO or GCaMP3-XC. Similar to b, dotted lines depict mean values of neurite length for nuclear-excluded GCaMP3 (pink) or nuclear-filled GCaMP3 (cyan) neurons (adopted from Fig. 1h). d Problematic nuclear accumulations were strongly attenuated for long-term viral expression of GCaMP6m-XC. Fluorescence indicative of sensor localization was mostly restricted to the cytosol of neurons infected with AAV-Syn-GCaMP6m-XC (GCaMP6-XC), as shown by representative images at different time points (upper panel). The temporal trend of N/C ratio for GCaMP6-XC (red) is distinct from that for GCaMP6f (black, GCaMP6 data adopted from Fig. 1b). e Apoptotic damages arising from GCaMP were strongly attenuated in GCaMP-XC expressing neurons. Fluorescence signals of apoptosis (red) were detected by Annexin V assay, to correlate with the expression of sensors (green). AAV-Syn-GCaMP6m-XC (GCaMP6-XC), EGFP and GCaMP6f (data adopted from Fig. 1c) were compared in a similar fashion to Fig. 1c. Standard error of the mean (S.E.M.) and Student’s t-test (two-tailed unpaired with criteria of significance: *p < 0.05; **p < 0.01, and ***p < 0.001) were calculated when applicable, and n.s. denotes “not significant”
Fig. 6
Fig. 6
Schematic summary and sensor performance for GCaMP and GCaMP-X. a GCaMP defects and advantages of GCaMP-X. In neurons, GCaMP sensors behave as CaM-like proteins perturbing CaV1 gating and distorting Ca2+ dynamics (1). The abnormal enhancement of CaV1 by cytosolic GCaMP underlies overgrown neurites. Different from endogenous CaM, GCaMP itself could no longer properly translocate into the nucleus in response to membrane excitation, which also dominant-negatively impairs the acute mobility of endogenous CaM. Once present in the nucleus (by accumulation or NLS), nuclear GCaMP perturbs transcription signaling and gene expression potentially through its aberrant CaM motif, impairing general health of neurons including Ca2+ signals (reflected as abnormal sensor readouts) and neurite outgrowth (2). The new GCaMP-X sensors are designed with apoCaM protection and explicit localization (e.g., GCaMP-XC for cytosolic Ca2+) to eliminate GCaMP perturbations on CaV1 gating (3) and signaling (4). b Sensor performance of GCaMP-XC validated by single-AP like Ca2+ transients in HEK293 cells. Briefly, glass electrodes formed the Giga-Ohm seal with cell membrane (resting); then 3 ms ZAP for break-in generated a rapid Ca2+ influx due to transient membrane rupture, immediately followed by a fast decay arising from strong Ca2+ chelators of 10 mM BAPTA included in the pipette solution. Key indices of peak ΔF/F0, rise time tr, decay time td and SNR were compared between GCaMP6m and GCaMP6m-XC. Epi-fluorescence images were acquired at the sampling rate of 100 Hz or higher. ce Sensor performance of GCaMP-XC validated with mechanosensing outer hair cells. Cells were transfected with GCaMP6m or GCaMP6m-XC at P1 by electroporation, and cultured for 1 day (DIV 1) or 3 days (DIV 3). Fluid-jet pulses of 100, 300 or 500 ms were applied to cells (c). Representative images, normalized fluorescence changes (ΔF/F0) indicative of Ca2+ dynamics and statistical summary of peak ΔF/F0 were compared between DIV 1 (d) and DIV 3 (e) cells expressing GCaMP6m or GCaM6m-XC. Standard error of the mean (S.E.M.) and Student’s t-test (two-tailed unpaired with criteria of significance: *p < 0.05; **p < 0.01, and ***p < 0.001) were calculated when applicable, and n.s. denotes “not significant”
Fig. 7
Fig. 7
Characterizations and validations of GCaMP-XN targeting nuclear Ca2+. a Design of GCaMP-XN. Based on the design principle of GCaMP-X, similar to GCaMP-XC, CBM was fused into N-terminus of GCaMP; and a nuclear localization signal (NLS) was tagged onto C-terminus of GCaMP. b, c Basic validations of GCaMP3-XN with pCREB signals and neurite outgrowth. Representative images of pCREB immunostaining (b, left), statistical summary of pCREB intensities (b, right), tracing of neurite morphology (c, upper), Sholl analysis and statistical summary of neurite length (c, lower) were compared among neurons transfected with YFP, NLS-GCaMP3-NLS or GCaMP3-XN. d Different Ca2+ dynamics resulted from neurons expressing NLS-GCaMP3-NLS or GCaMP3-XN. Confocal images representing Ca2+ fluorescence at three phases: before, during and at the end of extracellular stimuli of 40 mM [K+]o (upper). Ca2+ response (ΔF/F0) (lower left) and its rising speed (ΔF/F0·s−1, normalized change of fluorescence per second, lower right) were averaged from multiple neurons (number indicated within parentheses), to compare NLS-GCaMP3-NLS with GCaMP3-XN. e, f Simultaneous monitoring of cytosolic and nuclear Ca2+ dynamics. Representative confocal images indicative of Ca2+ fluorescence (upper in green) and time-dependent responses (ΔF/F0, lower) are to compare Ca2+ dynamics in the cytosol vs. the nucleus of the same neuron upon 40 mM [K+]o stimuli. Cytosolic Ca2+ was monitored by GCaMP3-XC for both cases, whereas nuclear Ca2+ was either by GCaMP3-XN (e) or by NLS-GCaMP3-NLS (f). Neurons were loaded with Hoechst 33342 to label the nuclei of neurons (upper, blue). Standard error of the mean (S.E.M.) and Student’s t-test (two-tailed unpaired with criteria of significance: *p < 0.05; **p < 0.01, and ***p < 0.001) were calculated when applicable, and n.s. denotes “not significant”

References

    1. Berridge MJ, Bootman MD, Roderick HL. Calcium: calcium signalling: dynamics, homeostasis and remodelling. Nat. Rev. Mol. Cell. Biol. 2003;4:517–529. doi: 10.1038/nrm1155. - DOI - PubMed
    1. Tian L, Hires SA, Looger LL. Imaging neuronal activity with genetically encoded calcium indicators. Cold Spring Harb. Protoc. 2012;2012:647–656. doi: 10.1101/pdb.top069609. - DOI - PubMed
    1. Nakai J, Ohkura M, Imoto K. A high signal-to-noise Ca2+ probe composed of a single green fluorescent protein. Nat. Biotechnol. 2001;19:137–141. doi: 10.1038/84397. - DOI - PubMed
    1. Tallini YN, et al. Imaging cellular signals in the heart in vivo: Cardiac expression of the high-signal Ca2+ indicator GCaMP2. Proc. Natl Acad. Sci. 2006;103:4753–4758. doi: 10.1073/pnas.0509378103. - DOI - PMC - PubMed
    1. Tian L, et al. Imaging neural activity in worms, flies and mice with improved GCaMP calcium indicators. Nat. Methods. 2009;6:875–881. doi: 10.1038/nmeth.1398. - DOI - PMC - PubMed

Publication types

MeSH terms