. 2018 Dec;25(12):2165-2180.
doi: 10.1038/s41418-018-0103-x. Epub 2018 Apr 17.

A p53/miR-30a/ZEB2 axis controls triple negative breast cancer aggressiveness

Affiliations

A p53/miR-30a/ZEB2 axis controls triple negative breast cancer aggressiveness

Alessandra di Gennaro et al. Cell Death Differ. 2018 Dec.

Erratum in

Abstract

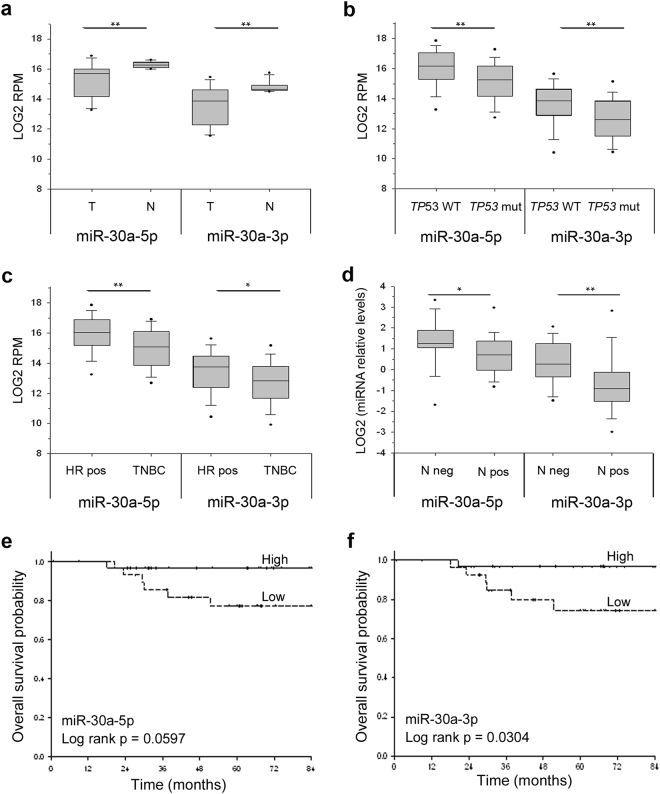
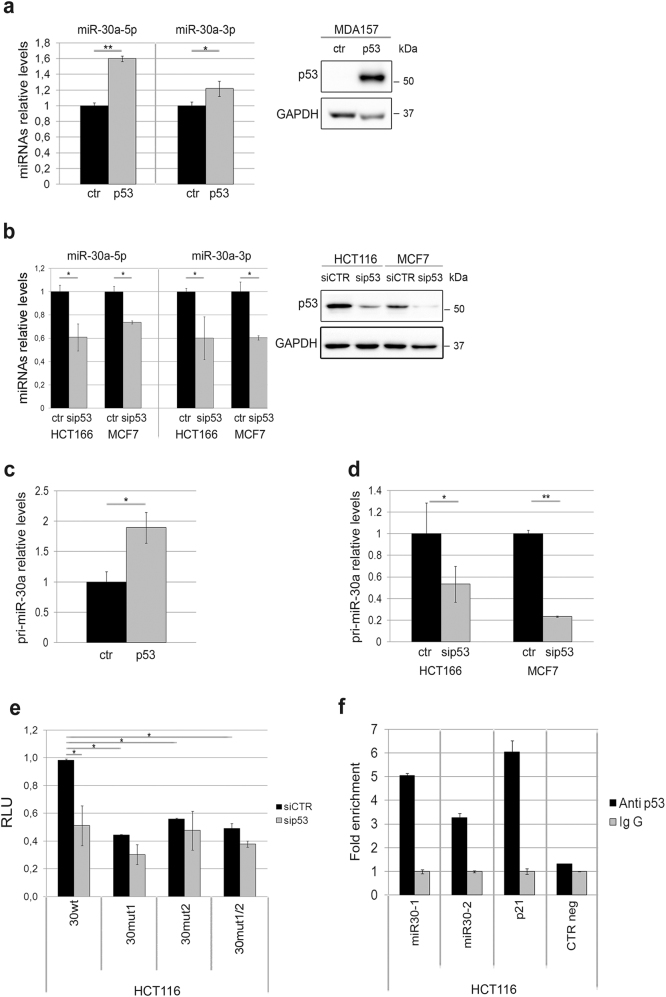
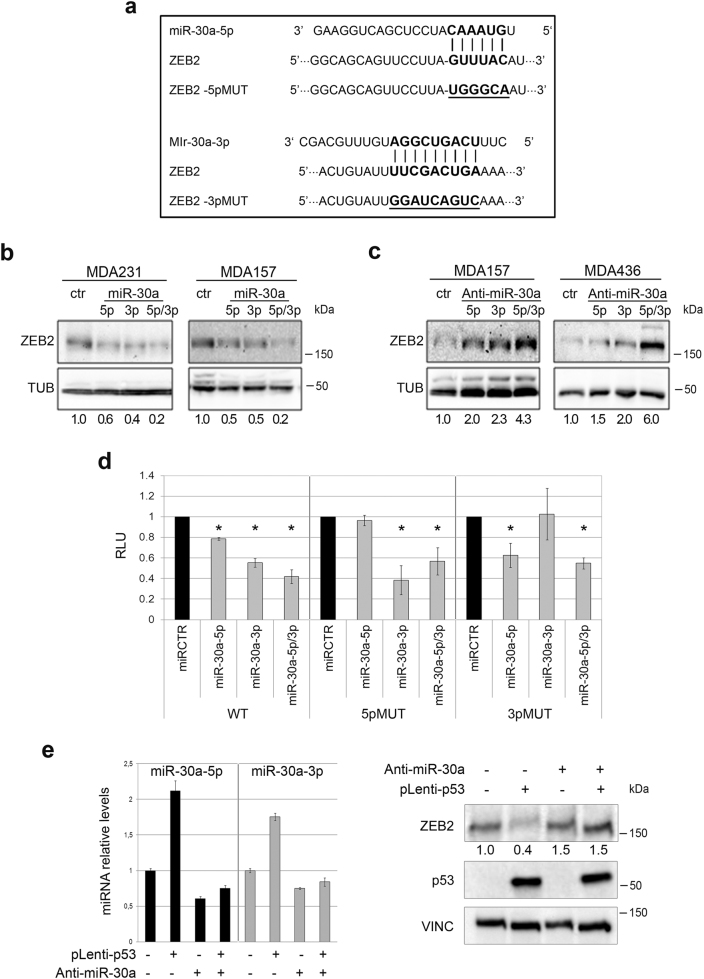
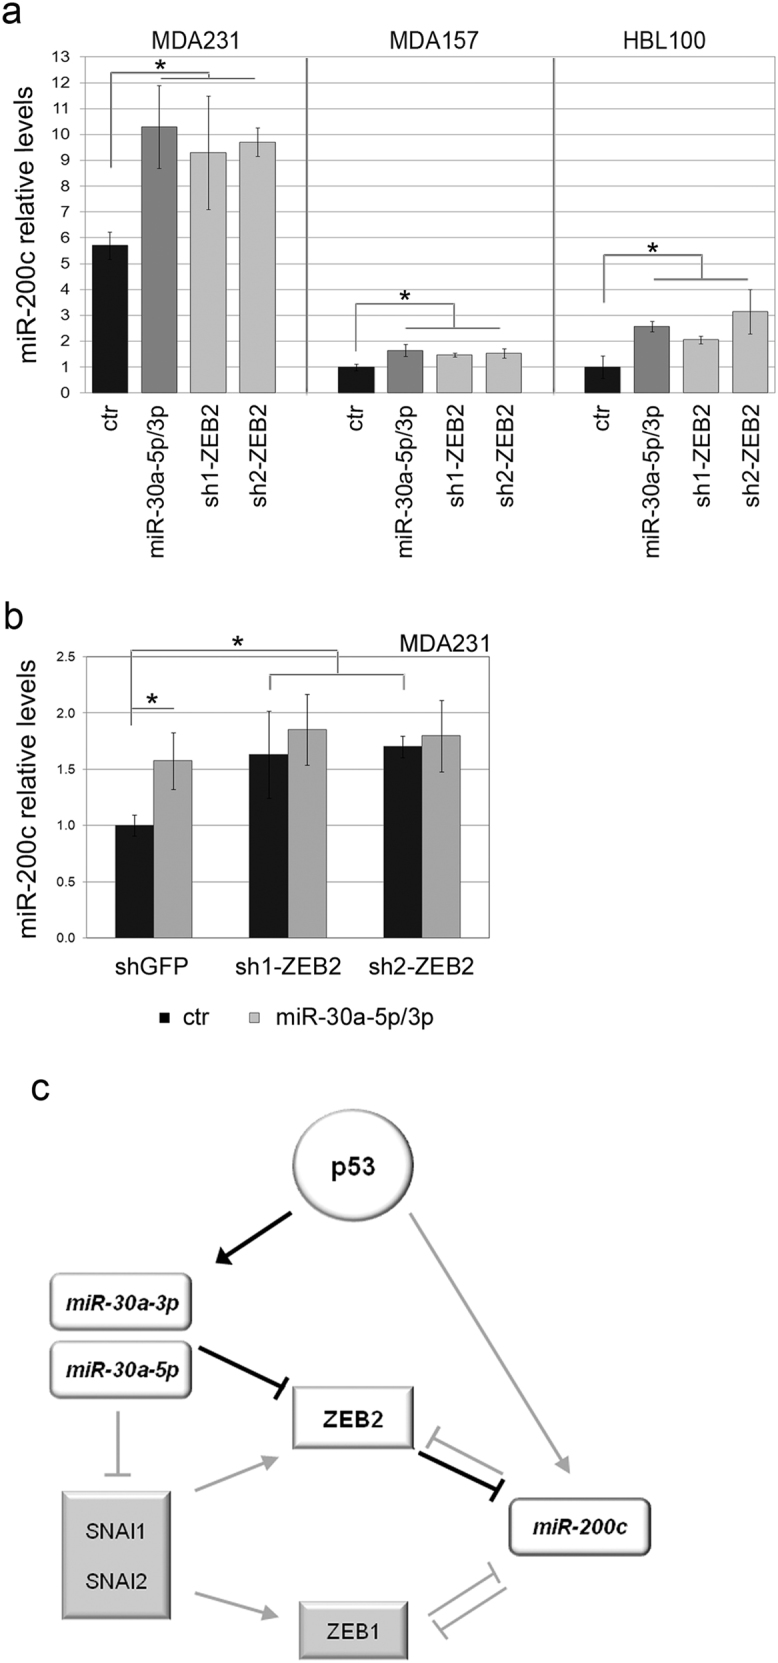
Inactivation of p53 contributes significantly to the dismal prognosis of breast tumors, most notably triple-negative breast cancers (TNBCs). How the relief from p53 tumor suppressive functions results in tumor cell aggressive behavior is only partially elucidated. In an attempt to shed light on the implication of microRNAs in this context, we discovered a new signaling axis involving p53, miR-30a and ZEB2. By an in silico approach we identified miR-30a as a putative p53 target and observed that in breast tumors reduced miR-30a expression correlated with p53 inactivation, lymph node positivity and poor prognosis. We demonstrate that p53 binds the MIR30A promoter and induces the transcription of both miRNA strands 5p and 3p. Both miR-30a-5p and -3p showed the capacity of targeting ZEB2, a transcription factor involved in epithelial-mesenchymal transition (EMT), tumor cell migration and drug resistance. Intriguingly, we found that p53 does restrain ZEB2 expression via miR-30a. Finally, we provide evidence that the new p53/miR-30a/ZEB2 axis controls tumor cell invasion and distal spreading and impinges upon miR-200c expression. Overall, this study highlights the existence of a novel axis linking p53 to EMT via miR-30a, and adds support to the notion that miRNAs represent key elements of the complex network whereby p53 inactivation affects TNBC clinical behavior.


Conflict of interest statement

The authors declare that they have no conflict of interest.

Figures

Fig. 1
Fig. 1
miR-30a-5p and miR-30a-3p expression in breast cancers of the TCGA series (ac) and of the in-house series (d–f). TCGA series: a the expression levels of miR-30a-5p and miR-30a-3p (expressed as LOG2 RPM) are lower in breast tumors (T) compared to matched normal breast tissues (N; 12 cases). b, c miR-30a-5p and miR-30a-3p levels are lower in the 82 BCs carrying TP53 mutations (missense, nonsense, frameshift; TP53 mut) compared to the 163 TP53 wild-type tumors (TP53 WT) (b) and in TNBC (27 cases) compared to hormone receptor-positive tumors (HR, 204 cases) (c). The p values were calculated by Mann–Whitney rank sum test; *p < 0.05, **p < 0.01. In-house series: d low levels of either miRNA strand are associated with lymph node positivity. Data are reported as LOG2 of miRNA relative levels; p values were calculated by two-tailed t-test; *p < 0.05, **p < 0.01. e, f Kaplan–Meier analysis showing overall survival in the TNBC patients classified according to miR-30a-5p (e) and miR-30a-3p (f) median levels. Survival curves are truncated at 84 months. In (ad) lines within the boxes mark the median, boundaries represent the 25th and the 75th percentiles and whiskers below and above the boxes indicate the 5th and 95th percentiles
Fig. 2
Fig. 2
p53 regulates miR-30a-5p and miR-30a-3p expression. a Ectopic p53 expression in MDA157 results in an augment of mature miR-30a-5p and miR-30a-3p levels. The immunoblot on the right shows p53 expression in MDA157 engineered cells. GAPDH was used as a loading control. b p53 silencing in HCT116 results in a decrement of both miR-30a-5p and miR-30a-3p. The extent of p53 silencing is shown in the right panel. c Ectopic p53 induces an increase of pri-miR-30a levels in MDA157. d Decrease of pri-miR-30a levels in p53-depleted HCT116 and MCF7 cells. ad Gray columns represent p53-modulated samples; black columns represent control cells. e p53 regulates the MIR30A promoter. Silencing of p53 results in a decrement of the MIR30A promoter activity (30wt). The mutagenesis of the two p53 binding sites, singularly (30mut1, 30mut2) or in combination (30mut1/2), abrogates this effect. Results represent the mean value of three independent experiments ± SD. f p53 binds the miR-30a promoter. Chromatin immunoprecipitation was performed with the DO-1 anti-p53 monoclonal antibody on HCT116 genomic DNA. Isotype-matched pre-immune mouse IgG was used as a negative control. The immunoprecipitated chromatin was assayed for the enrichment of the target MIR30A promoter (miR30-1 and 2, the regions encompassing the two p53BS) by qPCR. The p53 binding region of the p21 promoter and an irrelevant genomic region (CTR neg) [59] were used as positive and negative control, respectively. Data are reported as fold enrichment over control samples (immunoprecipitation with pre-immune IgG) p values were calculated by two-tailed t-test; *p < 0.05, **p < 0.01.
Fig. 3
Fig. 3
miR-30a-5p and miR-30a-3p inhibit ZEB2 and mediate the p53 control over ZEB2. a Alignment of ZEB2 3’UTR with miR-30a-5p and miR-30a-3p (Targetscan). Nucleotides mutagenized to disrupt the miRNA/mRNA base pairing are underlined. b Immunoblots showing the modulation of ZEB2 in response to miR-30a (5p, 3p or both) ectopic expression and c after anti-miR-mediated inhibition of miR-30a. ZEB2 relative levels, normalized over Tubulin (loading control), are reported below. d miR-30a targets the 3′UTR of ZEB2: luciferase activity of the ZEB2 3’UTR reporter, wild-type (WT) or mutated in the miR-30a-5p and -3p binding sites (5pMUT and 3pMUT), was measured 48 h post transfection of MDA231 cells with the indicated miRNAs. miRCTR was set as a reference. CMV-Renilla was used for normalization. Results represent the mean value ± SD of three experiments. The asterisks (*) indicate the comparisons of miR-30a vs miRCTR that are statistically significant (p < 0.05). e miR-30a-5p and miR-30a-3p expression in MDA157 stably transduced with p53 (pLenti-p53+) or pLenti-GFP (pLenti-p53−), in the absence (anti-miR-30a−) or presence (anti-miR-30a+) of an anti-miRNA targeting miR-30a. Immunoblots for ZEB2, p53 and Vinculin (loading control) are shown on the right. Numbers below the blot indicate ZEB2 relative levels normalized over Vinculin
Fig. 4
Fig. 4
miR-30a (5p/3p) overexpression results in a reduced BC cell migration in vitro and in a zebrafish xeno-transplantation model. a In vitro cell migration assay of MDA231 engineered to ectopically express miR-30a-5p, miR-30a-3p or control miRNA (miRCTR) in a ZEB2-proficient (siCTR) or ZEB2-deficient (si1-ZEB2 and si2-ZEB2) context (left panel). The right panel shows the migration capacity of MDA231 engineered to stably overexpress ZEB2 or GFP, used as a negative control. b In vitro cell migration assay of MDA231 transfected with anti-miR-30a-5p (A-miR-30a-5p), anti-miR-30a-5p (A-miR-30a-5p) or control anti-miRNA (A-CTR). The percentage of transmigrated cells was measured at 7 h post seeding. Data represent the mean of three independent experiments; *p < 0.05. c Scatter plot representing cell dissemination in zebrafish embryos of mCHERRY MDA231 transiently silenced for ZEB2 (si1-ZEB2 and si2-ZEB2) or engineered to stably express miR-30a (5p/3p). Cells transfected with an empty vector were used as a control (ctr). Cells were implanted in the yolk sac of 2-day-old embryos (fli1:EGFP strain). Embryos were automatically imaged at 6 dpi. Dots represent single cells; colors identify each microinjected embryo; x-axis indicates the migration from the injection point (0,0) toward the head (positive values) or the tail (negative values); n indicates the number of embryos analyzed. d Spreading distance of MDA231 and MDA157 calculated from data represented in (c) and in Supplementary Figure S8b, respectively; *p < 0.05. e Representative images of zebrafishes injected with MDA231 cells at 6 dpi. Cells were injected into the blood circulation (duct of Cuvier) of 2-day-old zebrafish embryos. Scale bar = 100 µm. f Percentages of embryos that show caudal micrometastatic colonization after injection with MDA231 or MDA157 cells engineered with control vector (ctr), miR-30a (5p/3p) or silenced for ZEB2 (si1-ZEB2 and si2-ZEB2). The percentage of ctr embryos showing metastasis was arbitrarily set to 100. Data are shown at 1, 4 and 6 dpi. Figures represent the results of two independent experiments
Fig. 5
Fig. 5
The p53/miR-30a/ZEB2 axis impinges upon miR-200c. a miR-200c levels in MDA231, MDA157 and HBL100 cell lines engineered to express miR-30a (5p/3p) or silenced for ZEB2 (sh1-ZEB2; sh2-ZEB2). Control vectors (pLenti6GFP and shGFP) yielded similar values and are here represented once as ctr. miR-200c levels in HBL100 ctr were set to 1. b miR-200c levels in MDA231 proficient (shGFP) or deficient (sh1-ZEB2, sh2-ZEB2) for ZEB2 expression, in the absence (ctr, pLenti6GFP) or presence (miR-30a-5p/3p) of ectopic miR-30a; *p < 0.05. c A unifying model of the new p53/miR-30a/ZEB2 axis (highlighted in bold) involved in TNBC

References

    1. Perou CM, Sørlie T, Eisen MB, van de Rijn M, Jeffrey SS, Rees CA, et al. Molecular portraits of human breast tumours. Nature. 2000;406:747–52. doi: 10.1038/35021093. - DOI - PubMed
    1. Lin NU, Vanderplas A, Hughes ME, Theriault RL, Edge SB, Wong YN, et al. Clinicopathologic features, patterns of recurrence, and survival among women with triple-negative breast cancer in the National Comprehensive Cancer Network. Cancer. 2012;118:5463–72. doi: 10.1002/cncr.27581. - DOI - PMC - PubMed
    1. Kalimutho M, Parsons K, Mittal D, López JA, Srihari S, Khanna KK. Targeted therapies for triple-negative breast cancer: combating a stubborn disease. Trends Pharmacol Sci. 2015;36:822–46. doi: 10.1016/j.tips.2015.08.009. - DOI - PubMed
    1. Miller LD, Smeds J, George J, Vega VB, Vergara L, Ploner A, et al. An expression signature for p53 status in human breast cancer predicts mutation status, transcriptional effects, and patient survival. Proc Natl Acad Sci USA. 2005;102:13550–5. doi: 10.1073/pnas.0506230102. - DOI - PMC - PubMed
    1. Cancer Genome Atlas Network. Comprehensive molecular portraits of human breast tumours. Nature. 2012;490:61–70. doi: 10.1038/nature11412. - DOI - PMC - PubMed

Publication types

MeSH terms