. 2019 Jan;26(1):146-161.
doi: 10.1038/s41418-018-0106-7. Epub 2018 Apr 17.

Single-cell analysis of pyroptosis dynamics reveals conserved GSDMD-mediated subcellular events that precede plasma membrane rupture

Affiliations

Single-cell analysis of pyroptosis dynamics reveals conserved GSDMD-mediated subcellular events that precede plasma membrane rupture

Nathalia M de Vasconcelos et al. Cell Death Differ. 2019 Jan.

Abstract

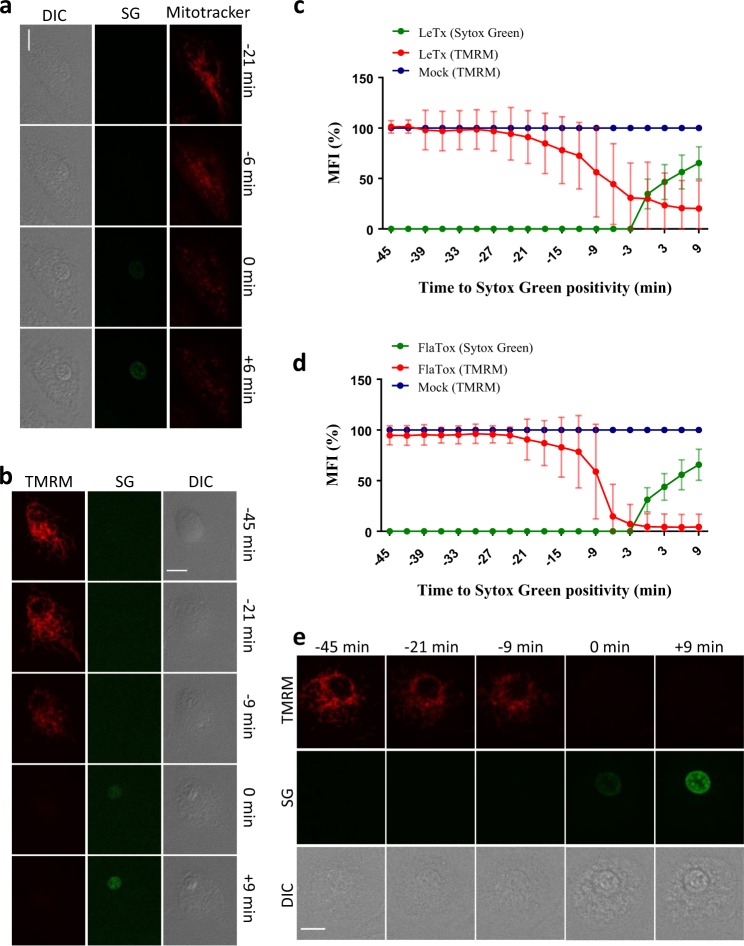
Pyroptosis is rapidly emerging as a mechanism of anti-microbial host defense, and of extracellular release of the inflammasome-dependent cytokines interleukin (IL)-1β and IL-18, which contributes to autoinflammatory pathology. Caspases 1, 4, 5 and 11 trigger this regulated form of necrosis by cleaving the pyroptosis effector gasdermin D (GSDMD), causing its pore-forming amino-terminal domain to oligomerize and perforate the plasma membrane. However, the subcellular events that precede pyroptotic cell lysis are ill defined. In this study, we triggered primary macrophages to undergo pyroptosis from three inflammasome types and recorded their dynamics and morphology using high-resolution live-cell spinning disk confocal laser microscopy. Based on quantitative analysis of single-cell subcellular events, we propose a model of pyroptotic cell disintegration that is initiated by opening of GSDMD-dependent ion channels or pores that are more restrictive than recently proposed GSDMD pores, followed by osmotic cell swelling, commitment of mitochondria and other membrane-bound organelles prior to sudden rupture of the plasma membrane and full permeability to intracellular proteins. This study provides a dynamic framework for understanding cellular changes that occur during pyroptosis, and charts a chronological sequence of GSDMD-mediated subcellular events that define pyroptotic cell death at the single-cell level.


Conflict of interest statement

The authors declare that they have no conflict of interest.

Figures

Fig. 1
Fig. 1
Cell detachment and blebbing during necroptosis and pyroptosis. a B6Nlrp1b+ BMDMs were stimulated with TNF+BV6+zVAD-fmk (TBz: 20 ng/ml, 2 µM and 50 µM, respectively) and imaged in culture media containing Sytox Green. b The rCTB-stained B6Nlrp1b+ BMDMs were stimulated with LeTx and imaged as in (a). a, b Confocal images were acquired every 3 min. c, d B6Nlrp1b+ BMDMs pretreated with Y27632 (10 μM) (c) or (−)-blebbistatin (10 μM) (d) were stimulated with LeTx or TBz and imaged. Fluorescent micrographs show the maximum intensity projection (Sytox Green) or the single plane (rCTB) of a representative cell from 3 independent experiments (TBz n = 30; LeTx n = 30; LeTx+Y27632 n = 25; TBz+Y27632 n = 23; LeTx+(−)-blebbistatin n = 19; TBz+(−)-blebbistatin n = 20). In all panels, time point zero indicates the first detection of Sytox Green. All scale bars, 10 µm
Fig. 2
Fig. 2
PS exposure happens during pyroptosis. ad B6Nlrp1b+ BMDMs were stimulated with LeTx (a, b) or FlaTox (c, d) and imaged in culture media containing Annexin-V–FITC and PI. Confocal images were acquired every 3 min. Graphs show the percentage of mean fluorescence intensity (MFI) calculated as described in the Methods section, and values represent the mean ± SD of all individual cells that were imaged in three independent experiments (LeTx n = 18; FlaTox n = 21). Single-cell plots are shown in Supplemental Fig. 1. Fluorescent micrographs show the maximum intensity projection of a representative. In all panels, time point zero indicates the first detection of PI. All scale bars, 10 µm
Fig. 3
Fig. 3
Mitochondria are damaged during pyroptosis. a B6Nlrp1b+ BMDMs were preloaded with Mitotracker Red CMXRos and stimulated with LeTx in culture media containing Sytox Green (n = 50). Confocal images were acquired every 3 min. be B6Nlrp1b+ BMDMs were preloaded with TMRM and stimulated with either LeTx (b, c) or FlaTox (d, e) and imaged as in (a). Graphs show the percentage of mean fluorescence intensity (MFI) calculated as described in the Methods section, and values represent the mean ± SD of all individual cells that were imaged in five independent experiments (LeTx, n = 28; FlaTox n = 28). Single-cell plots are shown in Supplemental Fig. 3. Fluorescent micrographs show the maximum intensity projection (TMRM and Sytox Green) or the single plane (Mitotracker) of a representative cell. In all panels, time point zero indicates the first detection of Sytox Green. All scale bars, 10 µm
Fig. 4
Fig. 4
Lysosomes decay prior to pyroptotic cell lysis. ad B6Nlrp1b+or B6 BMDMs preloaded with Lysotracker and stimulated with LeTx (a, b) or FlaTox (c, d), respectively, were imaged throughout cell death in culture media containing Sytox Green. Confocal images were taken every 3 min. Graphs show the percentage of mean fluorescence intensity (MFI) calculated as described in the Methods section, and values represent the mean ± SD of all individual cells that were imaged in 3 independent experiments (LeTx, n = 27; FlaTox n = 19). Single-cell plots are shown in Supplemental Fig. 5. Fluorescent micrographs show the maximum intensity projection of a representative cell out of at least 19 imaged cells. In all panels, time point zero indicates the first detection of Sytox Green. All scale bars, 10 µm
Fig. 5
Fig. 5
Nuclei round up and condense during pyroptosis. ae B6Nlrp1b+ BMDMs were preloaded with Hoechst dye and stimulated with LeTx (ac) or FlaTox (ce) before imaging in culture media containing Sytox Green. Confocal images were acquired every 10 min. Graphs show the percentage of mean fluorescence intensity (MFI) of Sytox Green and nuclear sphericity or the Feret’s diameter based on Hoechst staining, all calculated as described in the Methods section. Values represent the mean ± SD of individual cells imaged in three independent experiments (LeTx: Sphericity n = 24, Feret’s diameter n = 18; FlaTox: Sphericity n = 26, Feret’s diameter n = 20). Single-cell plots are shown in Supplemental Fig. 6. Fluorescent micrographs show the maximum intensity projection of a representative cell. In all panels, time point zero indicates the first detection of Sytox Green. All scale bars, 10 µm
Fig. 6
Fig. 6
Cell swelling precedes pyroptotic cell rupture. ad B6Nlrp1b+ or B6 BMDMs stained with Cholera Toxin subunit B-Alexa 594 (rCTB) were stimulated with LeTx (a, b) or FlaTox (c, d), respectively, and imaged in culture media containing Sytox Green. Confocal images were acquired every 1.5 min. Graphs show the percentage of mean fluorescence intensity (MFI) of Sytox Green and cell volume quantifications based on rCTB-Alexa 594 staining, both calculated as described in the Methods section. Values represent the mean ± SD of individual cells imaged in 3 independent experiments (LeTx, n = 26; FlaTox n = 16). Fluorescent micrographs show the maximum intensity projection (Sytox Green) or the single plane (rCTB) of a representative cell. Single-cell plots are shown in Supplemental Fig. 7. In all panels, time point zero indicates the first detection of Sytox Green. All scale bars, 10 µm
Fig. 7
Fig. 7
Ca2+ influx occurs prior to total membrane permeabilization in pyroptosis. ad B6Nlrp1b+ BMDMs preloaded with the cell-permeant Ca2+ indicator Fluo4 were imaged after stimulation with LeTx (a, b) or FlaTox (c, d) in culture media containing PI. Confocal images were acquired every 1.5 min. Graphs show the percentage of mean fluorescence intensity (MFI) calculated as described in the Methods section, and values represent the mean ± SD of individual cells imaged in 4 independent experiments (LeTx, n = 24; FlaTox n = 23). Single-cell plots are shown in Supplemental Figure 10. Fluorescent micrographs show the maximum intensity projection of a representative cell. In all panels, time point zero indicates the first detection of PI. All scale bars, 10 µm
Fig. 8
Fig. 8
GSDMD deficiency prevents LPS transfection-induced early Ca2+ influx and mitochondrial decay. a, c Pam3csk4-primed BMDMs of the indicated genotypes were preloaded with the cell-permeant Ca2+ indicator Fluo4 and imaged after transfection with LPS (2 µg/ml, Fugene+LPS), treated with Fugene alone or 'mock'-treated in culture media containing PI. Confocal images were acquired every 2 min. Fluorescent micrographs show the maximum intensity projection of a representative cell. b, e BMDMs of the indicated genotypes were preloaded with TMRM and imaged after transfection with LPS (2 µg/ml, Fugene+LPS), treated with Fugene alone, or 'mock'-treated in culture media containing Sytox Green. Confocal images were acquired every 3 min. Fluorescent micrographs show the maximum intensity projection of a representative cell. d, f Graphs show the percentage of mean fluorescence intensity (MFI) calculated as described in the Methods section, and values represent the mean ± SD of individual cells imaged in 3 or 4 independent experiments (Fluo4: WT n = 18, GSDMD-/- n = 28; TMRM: WT n = 18, GSDMD-/- n = 29). Single-cell plots are shown in Supplemental Figure 14. In all panels, time point zero indicates the first detection of PI/Sytox Green. All scale bars, 10 µm
Fig. 9
Fig. 9
Pyroptosis triggers non-selective release of cytosolic and organellar proteins. Culture supernatants and cell lysates of B6Nlrp1b+ BMDMs stimulated with LeTx (a) or FlaTox (b) for the depicted durations were analyzed by western blotting for the indicated proteins. c, d Culture supernatants used in (a, b) were assayed for LDH activity. Data are representative of 3 independent experiments

References

    1. Vande Walle L, Lamkanfi M. Pyroptosis. Curr Biol. 2016;26:R568–572. doi: 10.1016/j.cub.2016.02.019. - DOI - PubMed
    1. Jorgensen I, Miao EA. Pyroptotic cell death defends against intracellular pathogens. Immunol Rev. 2015;265:130–42. doi: 10.1111/imr.12287. - DOI - PMC - PubMed
    1. Kayagaki N, et al. Non-canonical inflammasome activation targets caspase-11. Nature. 2011;479:117–21. doi: 10.1038/nature10558. - DOI - PubMed
    1. Lamkanfi M, Dixit VM. Mechanisms and functions of inflammasomes. Cell. 2014;157:1013–22. doi: 10.1016/j.cell.2014.04.007. - DOI - PubMed
    1. Kayagaki N, et al. Caspase-11 cleaves gasdermin D for non-canonical inflammasome signalling. Nature. 2015;526:666–71. doi: 10.1038/nature15541. - DOI - PubMed

Publication types

MeSH terms

Substances

LinkOut - more resources