. 2018 Feb 5:2018:4038034.
doi: 10.1155/2018/4038034. eCollection 2018.

Analysis of a Pulse Rate Variability Measurement Using a Smartphone Camera

Affiliations

Analysis of a Pulse Rate Variability Measurement Using a Smartphone Camera

András Bánhalmi et al. J Healthc Eng. .

Abstract

Background: Heart rate variability (HRV) provides information about the activity of the autonomic nervous system. Because of the small amount of data collected, the importance of HRV has not yet been proven in clinical practice. To collect population-level data, smartphone applications leveraging photoplethysmography (PPG) and some medical knowledge could provide the means for it.

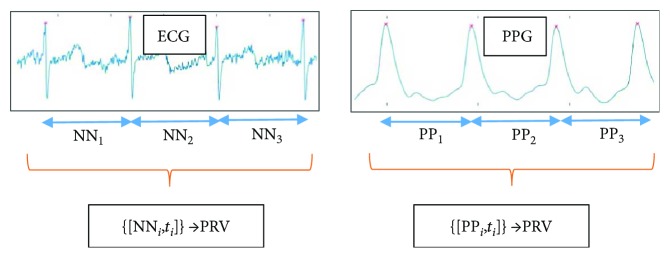
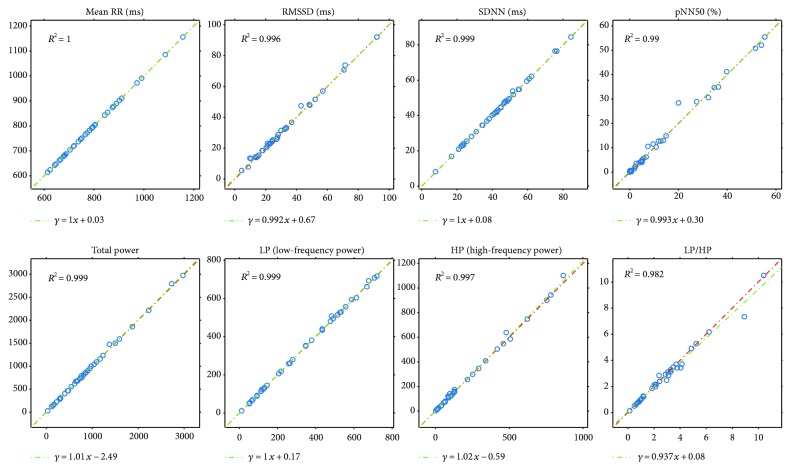
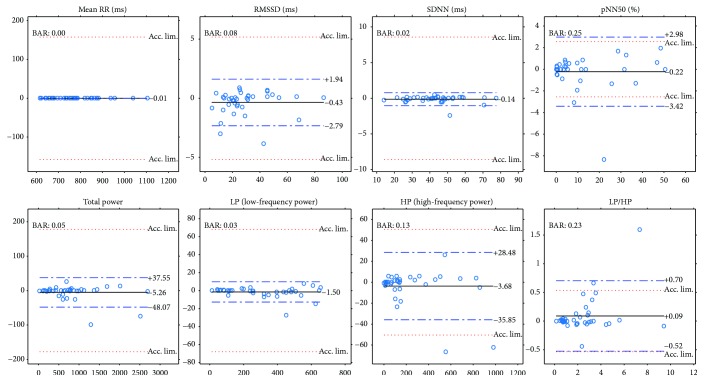
Objective: To assess the capabilities of our smartphone application, we compared PPG (pulse rate variability (PRV)) with ECG (HRV). To have a baseline, we also compared the differences among ECG channels.

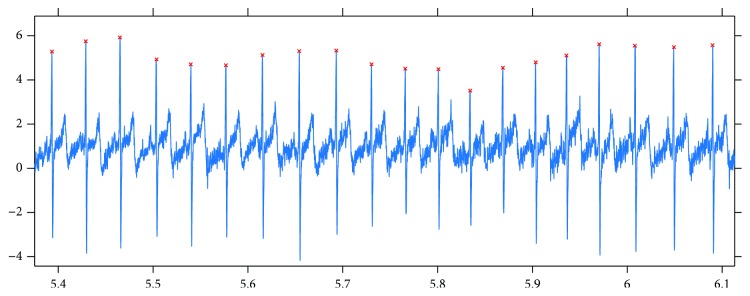
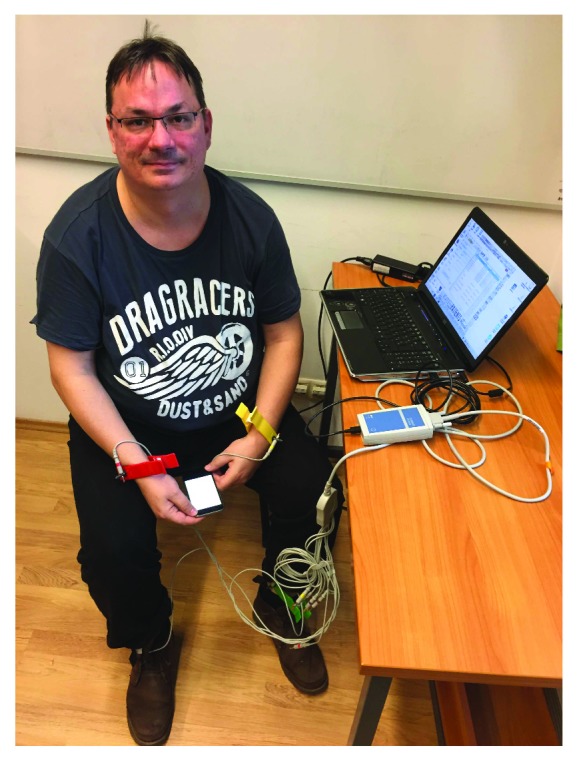
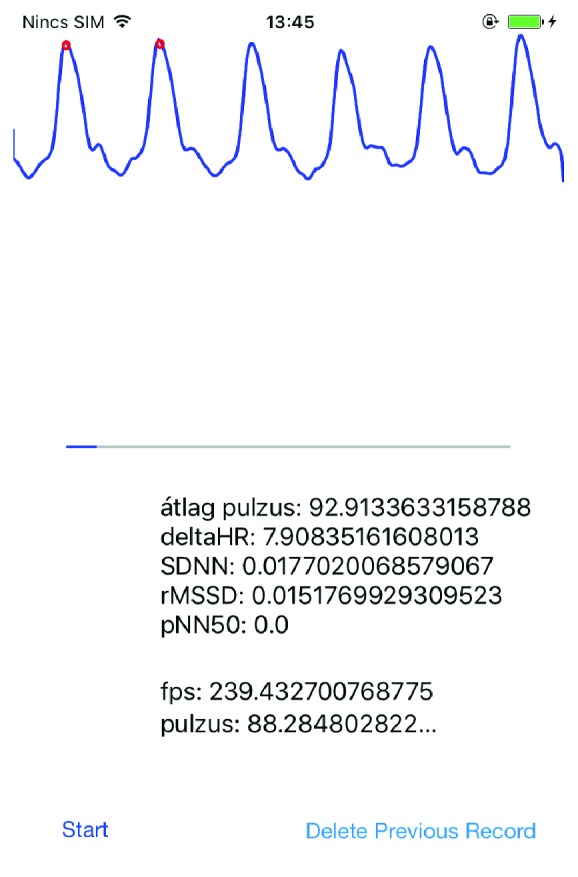
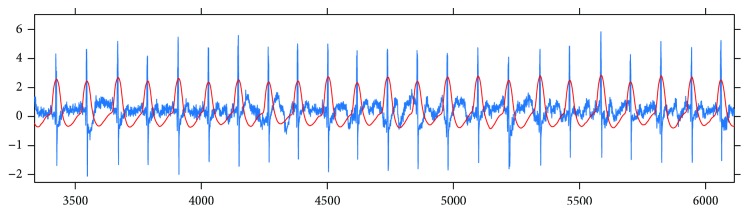
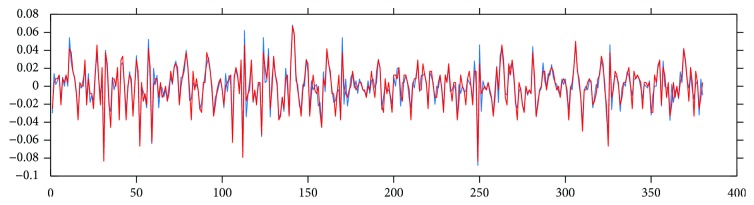
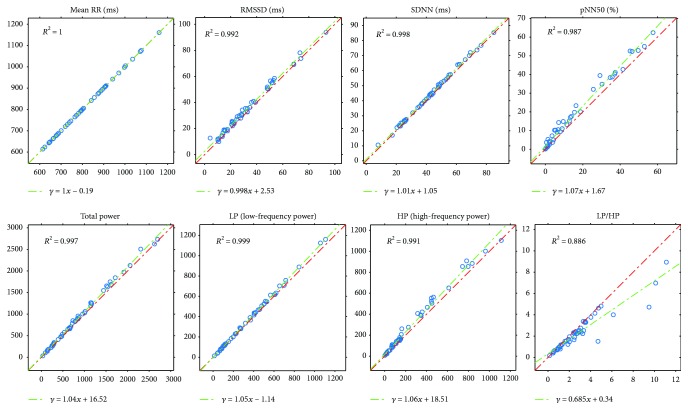
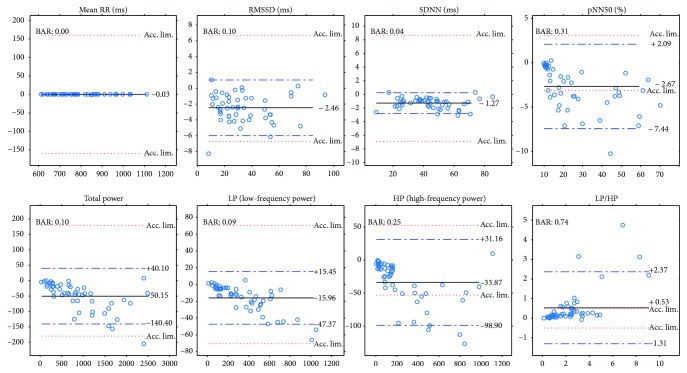
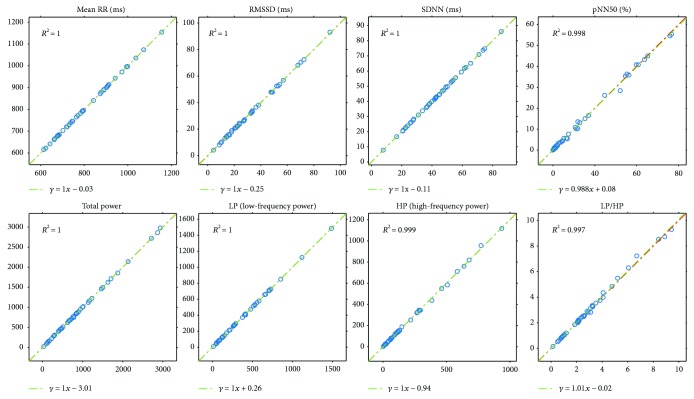
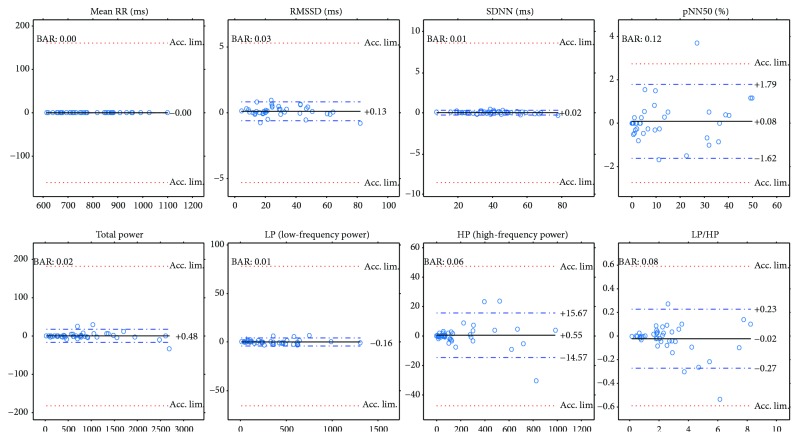
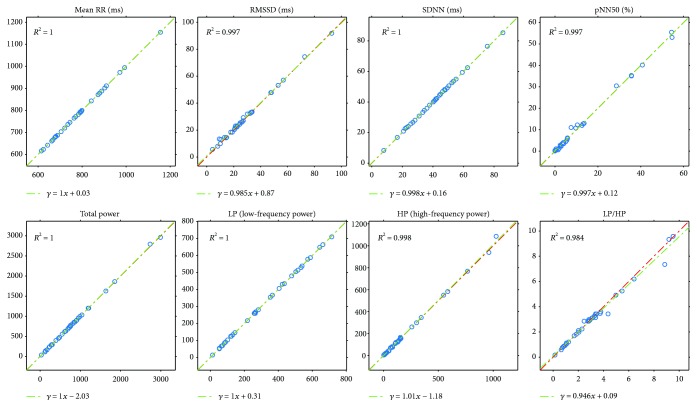
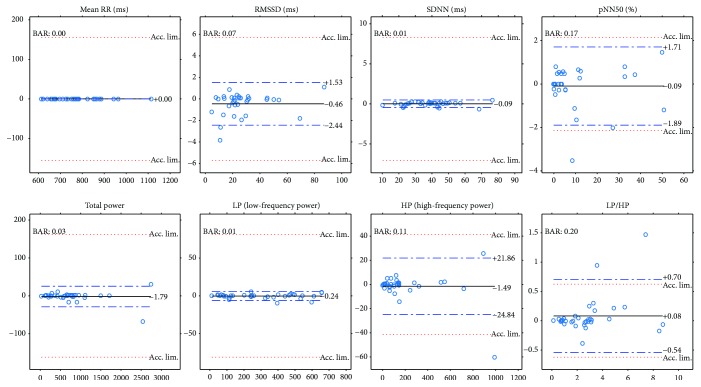
Method: We took fifty parallel measurements using iPhone 6 at a 240 Hz sampling frequency and Cardiax PC-ECG devices. The correspondence between the PRV and HRV indices was investigated using correlation, linear regression, and Bland-Altman analysis.

Results: High PPG accuracy: the deviation of PPG-ECG is comparable to that of ECG channels. Mean deviation between PPG-ECG and two ECG channels: RR: 0.01 ms-0.06 ms, SDNN: 0.78 ms-0.46 ms, RMSSD: 1.79 ms-1.21 ms, and pNN50: 2.43%-1.63%.

Conclusions: Our iPhone application yielded good results on PPG-based PRV indices compared to ECG-based HRV indices and to differences among ECG channels. We plan to extend our results on the PPG-ECG correspondence with a deeper analysis of the different ECG channels.


Figures

Figure 1
Figure 1
Connection between HRV and PRV analysis. From the ECG signal, the NN intervals (time durations) are determined, with the corresponding timestamps. The timestamps are needed when spectral analysis is applied to the NN time serial. The data for PRV is similarly obtained from the PP durations between the consecutive maximum values in the PPG signal.
Figure 2
Figure 2
Results got from applying our peak detection method to an ECG signal.
Figure 3
Figure 3
Experimental arrangement. The subject is sitting in a resting position, the electrodes of the ECG device are connected to the limbs, and the smartphone is held in the subject's palm.
Figure 4
Figure 4
A screenshot of the PPG measurement application during a recording.
Figure 5
Figure 5
Illustration of the results of the synchronization process, with the ECG signal shown in blue and the PPG signal shown in red.
Figure 6
Figure 6
Delta RR duration series computed on ECG (blue) and PPG (red) signals.
Figure 7
Figure 7
Plots of PRV indices related to HRV indices (horizontal axis) with R2 and linear regression.
Figure 8
Figure 8
Bland-Altman plots for PRV and HRV indices with limits of agreement (blue dashed lines), bias (black lines), and acceptance limits (red dotted lines).
Figure 9
Figure 9
Plots of HRV indices calculated for ECG channel 1 and ECG channel 2 with R2 and linear regression.
Figure 10
Figure 10
Bland-Altman plots of HRV indices calculated for ECG channel 1 and ECG channel 2 with limits of agreement (blue dashed lines), bias (black lines), and acceptance limits (red dotted lines).
Figure 11
Figure 11
Plots of HRV indices calculated for ECG channel 1 and ECG channel 3 with R2 and linear regression.
Figure 12
Figure 12
Bland-Altman plots of HRV indices calculated for ECG channel 1 and ECG channel 3 with limits of agreement (blue dashed lines), bias (black lines), and acceptance limits (red dotted lines).
Figure 13
Figure 13
Plots of HRV indices calculated for ECG channel 2 and ECG channel 3 with R2 and linear regression.
Figure 14
Figure 14
Bland-Altman plots of HRV indices calculated for ECG channel 2 and ECG channel 3 with limits of agreement (blue dashed lines), bias (black lines), and acceptance limits (red dotted lines).

References

    1. Task Force of The European Society of Cardiology and The North American Society of Pacing and Electrophysiology. Heart rate variability: standards of measurement, physiological interpretation, and clinical use. European Heart Journal. 1996;17(3):354–381. doi: 10.1093/oxfordjournals.eurheartj.a014868. - DOI - PubMed
    1. Sassi R., Cerutti S., Lombardi F., et al. Advances in heart rate variability signal analysis: joint position statement by the e-Cardiology ESC Working Group and the European Heart Rhythm Association co-endorsed by the Asia Pacific Heart Rhythm Society. EP Europace. 2015;17(9):1341–1353. doi: 10.1093/europace/euv015. - DOI - PubMed
    1. W. H. Organization. World Health Statistics 2016: Monitoring Health for the SDGs Sustainable Development Goals. Geneva, Switzerland: World Health Organization; 2016.
    1. Bilchick K. C., Berger R. D. Heart rate variability. Journal of Cardiovascular Electrophysiology. 2006;17(6):691–694. doi: 10.1111/j.1540-8167.2006.00501.x. - DOI - PubMed
    1. Sosnowski M., Clark E., Latif S., Macfarlane P. W., Tendera M. Heart rate variability fraction—a new reportable measure of 24-hour R-R interval variation. Annals of Noninvasive Electrocardiology. 2005;10(1):7–15. doi: 10.1111/j.1542-474X.2005.00579.x. - DOI - PMC - PubMed

Publication types

LinkOut - more resources