. 2018 Aug 15;526(12):1896-1909.
doi: 10.1002/cne.24456. Epub 2018 May 6.

Cone synapses in mammalian retinal rod bipolar cells

Affiliations

Cone synapses in mammalian retinal rod bipolar cells

Ji-Jie Pang et al. J Comp Neurol. .

Abstract

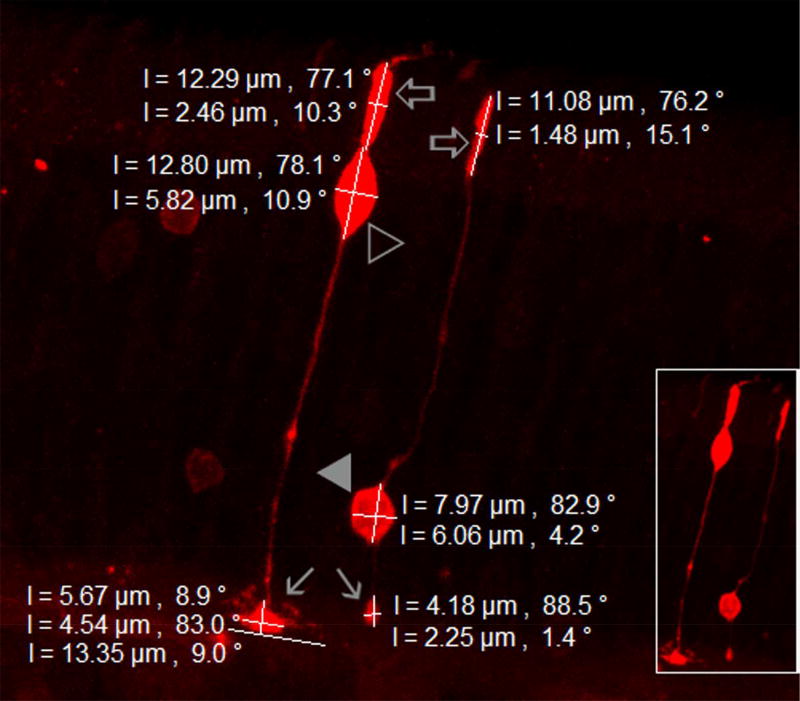
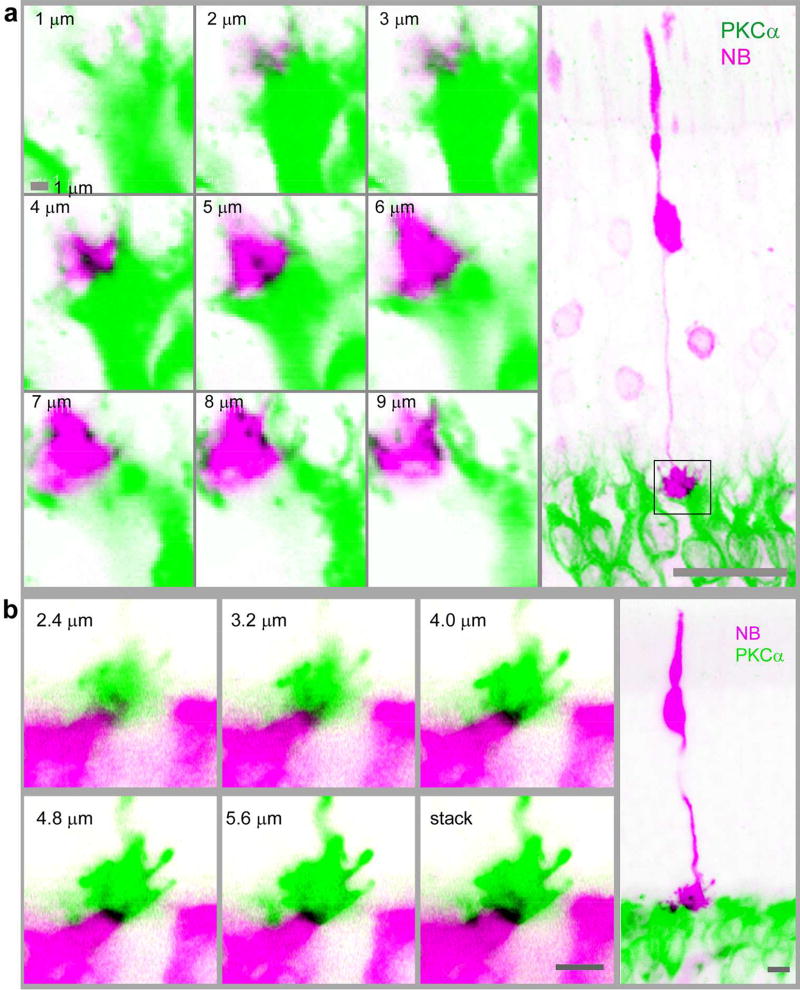
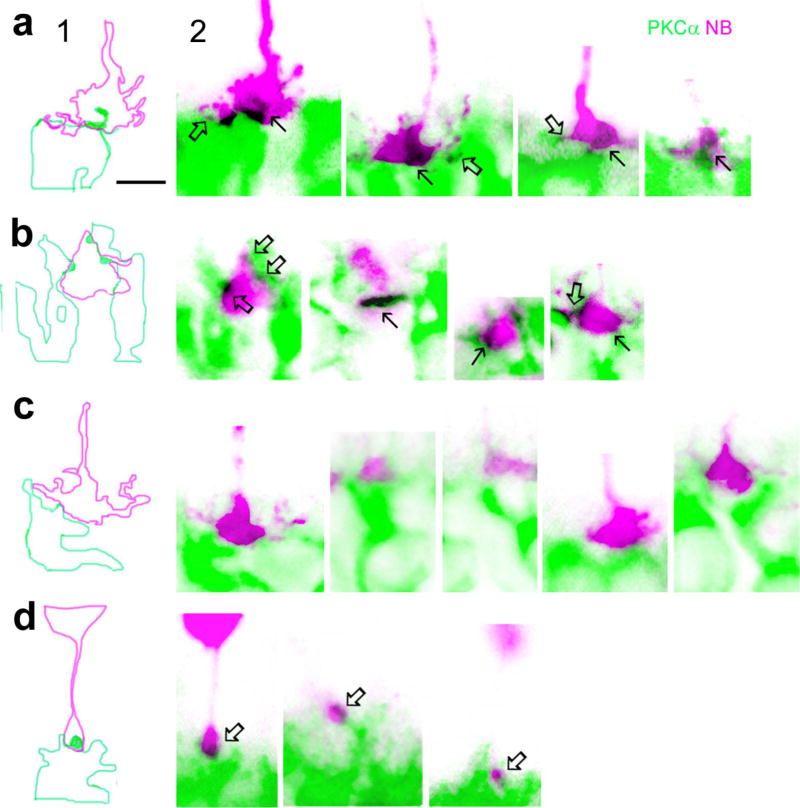
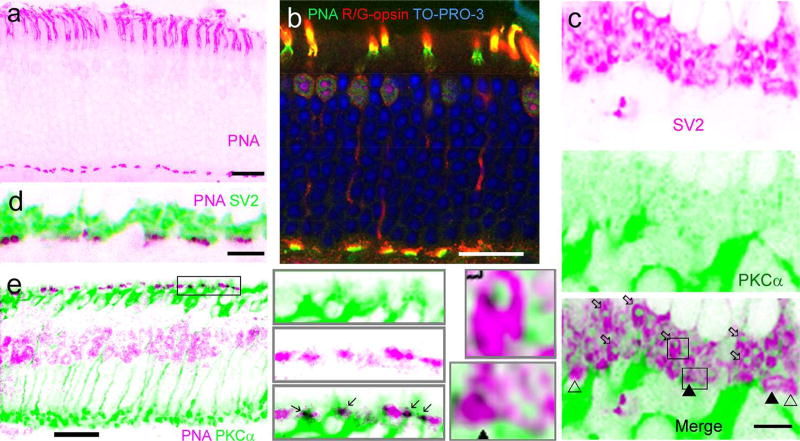
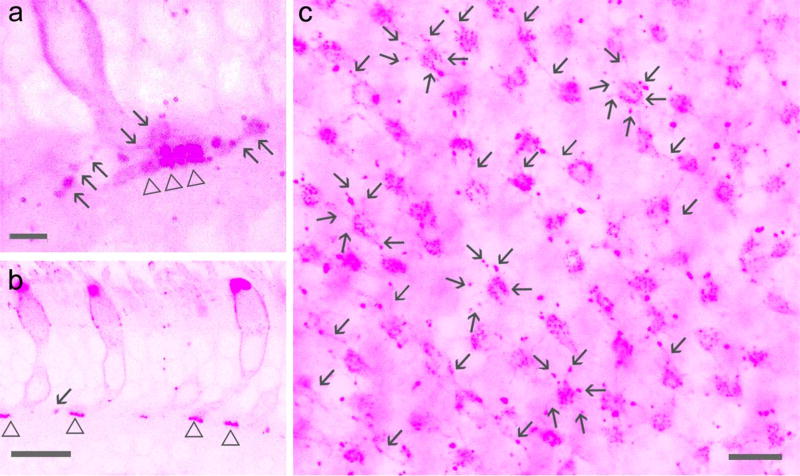
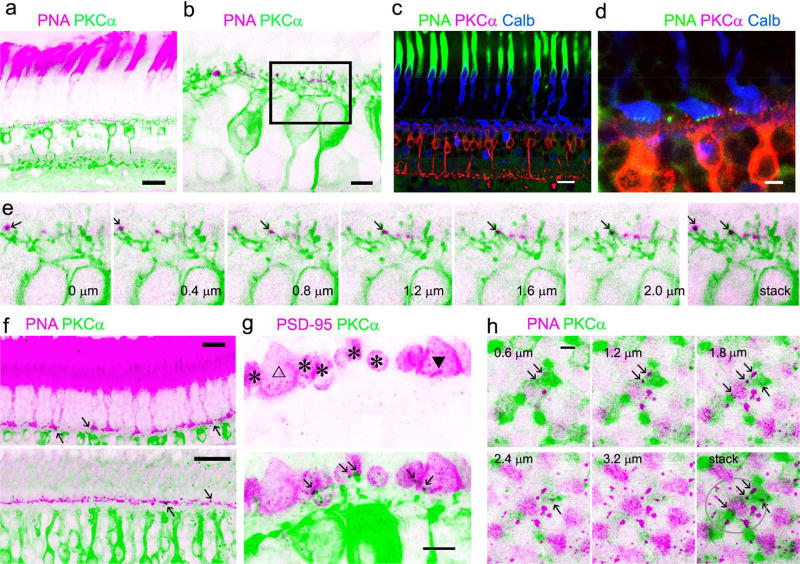
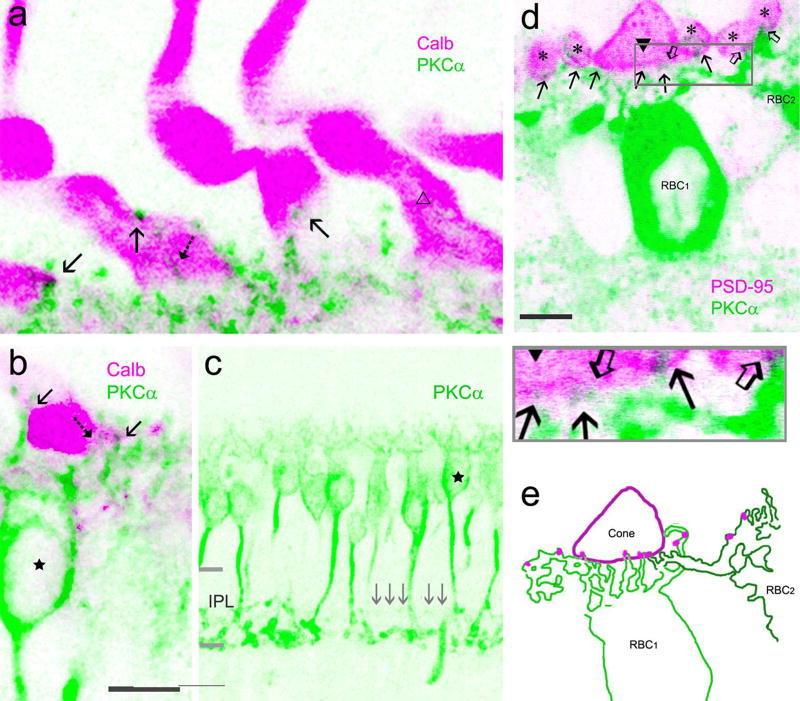
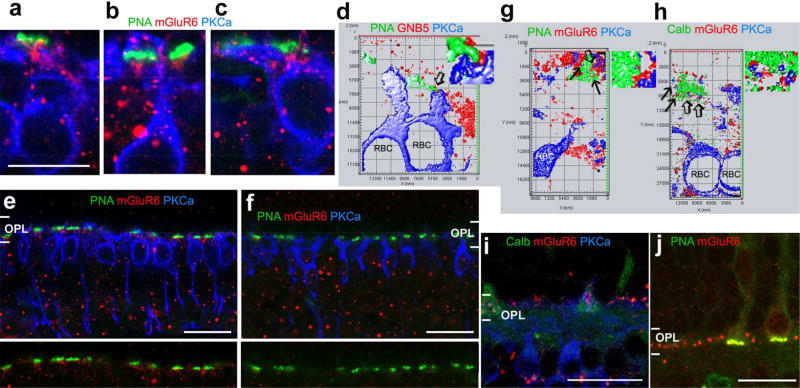
Some mammalian rod bipolar cells (RBCs) can receive excitatory chemical synaptic inputs from both rods and cones (DBCR2 ), but anatomical evidence for mammalian cone-RBC contacts has been sparse. We examined anatomical cone-RBC contacts using neurobiotin (NB) to visualize individual mouse cones and standard immuno-markers to identify RBCs, cone pedicles and synapses in mouse and baboon retinas. Peanut agglutinin (PNA) stained the basal membrane of all cone pedicles, and mouse cones were positive for red/green (R/G)-opsin, whereas baboon cones were positive for calbindin D-28k. All synapses in the outer plexiform layer were labeled for synaptic vesicle protein 2 (SV2) and PSD (postsynaptic density)-95, and those that coincided with PNA resided closest to bipolar cell somas. Cone-RBC synaptic contacts were identified by: (a) RBC dendrites deeply invaginating into the center of cone pedicles (invaginating synapses), (b) RBC dendritic spines intruding into the surface of cone pedicles (superficial synapses), and (c) PKCα immunoreactivity coinciding with synaptic marker SV2, PSD-95, mGluR6, G protein beta 5 or PNA at cone pedicles. One RBC could form 0-1 invaginating and 1-3 superficial contacts with cones. 20.7% and 38.9% of mouse RBCs contacted cones in the peripheral and central retina (p < .05, n = 14 samples), respectively, while 34.4% (peripheral) and 48.5% (central) of cones contacted RBCs (p > .05). In baboon retinas (n = 4 samples), cone-RBC contacts involved 12.2% of RBCs (n = 416 cells) and 22.5% of cones (n = 225 cells). This suggests that rod and cone signals in the ON pathway are integrated in some RBCs before reaching AII amacrine cells.

Keywords: PKCα RRID: AB_477345; Postsynaptic density-95 RRID: AB_10807979; RRID: AB_2313718; RRID: AB_2650488; cone synapse; confocal microscopy; immunohistology; mGluR6 RRID: AB_784501; mouse; primate; rod bipolar cell; synaptic vesicle protein RRID:AB_2315387; tracer injection.


Conflict of interest statement

Conflict of interest statement

All authors do not have any known or potential conflict of interest including financial, personal or other relationships with other people or organizations within three years of beginning the submitted work that could inappropriately influence, or be perceived to influence, their work.

Figures

Fig.1
Fig.1
Distinctive confocal morphology of individual cones and rods in the mouse retina. The stacked confocal image shows a cone and a rod filled with NB, which fully reveals the location, shape and size of the inner segments (open arrows), somas (cone-open triangle, rod-closed triangle), and axonal terminals (arrows). Zeiss imaging software was used to measure the cells. Each measure is given by a white bar with a length and an angle associated to the bar (0°-horizontal, 90°-vertical). The entire cone pedicle shows a triangular shape, which is nearly 2–7 times wider than the oval-shaped rod spherule. Cone inner segment is nearly two times thicker than the rod inner segment. The cone soma is larger than the rod soma and located near its inner segment.
Fig. 2
Fig. 2
Cone-RBC synapses in the mouse retina. Cones were filled with NB (pink) in living retinas and further stained for PKCα (green). Cones possess a triangular shaped pedicle and a large soma close to its thicker inner segment (right panels). Confocal optical sections crossing cone pedicles (square region in right images) are depicted in left panels, which reveal a RBC dendrite invaginating into the center of cone pedicles (in black, in 4–5 µm (a) and 2.4–4.8 µm (b) focal planes). Consecutive confocal optical sections reveal one invaginating (a, b) and a few superficial contacts (a, in 6–8 µm focal planes) (in black) between a cone pedicle and RBCs. Scale bars are 20 µm in a (left) and 5 µm in b.
Fig. 3
Fig. 3
Comparison of mouse rod-RBC and cone-RBC contacts in confocal micrographs. Individual cones and rods were filled with NB and retinas were further labeled for PKCα. Images in panel 1 show outlines of RBC dendrites (green) and cone pedicles (pink) in the first image of panel 2 obtained by tracing the profiles with Photoshop software. a and b show invaginating cone-RBC contacts (in black, see arrows) where a RBC dendrite plugs deeply into the basal membrane of cone pedicles, as well as a few superficial cone-RBC putative synapses where RBC dendrites contact cone telodendrites and RBC dendritic spines bulge into the surface of cone pedicles (open arrows). c displays cone pedicles and adjacent RBC dendrites without forming synapses. d depicts rod-RBC invaginating synapses, where a single RBC dendritic spine inserts into the center of a small rod spherule (arrows). The scale bars are 5 µm.
Fig. 4
Fig. 4
Identification of mouse cone-RBC synapses. PNA brightly labels the inner segment (a, b) and the basal membrane of cone pedicles, and cones are labeled for R/G-opsin (b). Nuclei in the outer nuclear layer (ONL) are labeled by nuclear dye TO-PRO-3 (b). Cone somas are mostly located in the first row of somas in the ONL. Cone synapses at the basal membrane, where PNA (b) and SV2 (c, d) coincide, are closer to RBC layer than all other synapses identified by SV2 in the OPL. Some PKCα-labeled RBC dendrites are colocalized with PNA in cone basal membranes (in black, in e and insets). In retinas labeled for SV2 (c and insets), rod spherules are identifiable by their strong SV2-immunoreactivity, smaller size, oval shape and more distal location (open arrows), while cone pedicles are recognizable by their triangular shape, larger size and more proximal location (triangles). Many Rod-RBC contacts are formed by a solitary RBC dendrite invaginating to the center of each rod spherule, appearing like pomegranate arils (c, bottom). Some cone pedicles receive RBC invaginating contacts (closed triangles) and some don’t (open triangles) (c). Scale bars are 20 µm.
Figure 5
Figure 5
Baboon cone pedicles and telodendrites labeled for PNA. Confocal micrographs show PNA-labeled cones (pink) in retinal slices (a, b) and flat-mounts (c). a and c are overexposed images. PNA signals appear as puncta in cone pedicles (triangle) and endings of cone telodendrites (arrow). Each cone pedicle sends out ~6 telodendrites. Sale bars are 1.5 µm in a and 20 µm in b and c
Fig. 6
Fig. 6
Baboon cone-RBC synapses. Retina preparations are triple- (a to d) or double-labeled. Cone somas and pedicles are brightly labeled for calbindin D-28k (Calb) (c, d). PNA intensively labels cone inner segments (a, c, e) and reveals clusters of puncta in the basal membrane of cone pedicles (d). Each cluster of PNA-positive puncta belongs to a cone pedicle (d). Consecutive confocal optical sections of a rectangular region in b show that some PKCα-labeled RBC dendrites colocalize with PNA (e). Some RBC dendrites coincide with PNA in cone pedicles (see arrows) in retinal slices (f, upper-peripheral retina, lower-para-central retina) and cone telodendrites in the flat-mount retina (h). h displays overexposed images of consecutive horizontal confocal optical sections of a cone pedicle and its telodendrites (in the circle). In retinal slices (g) large triangular cone pedicles are positively labeled for PSD95 (triangle) and distinguishable from small oval-shaped rod spherules (asterisks). RBC dendrites contact rod spherules and one cone pedicle (closed triangle) but do not contact the other cone pedicle (open triangle). Scale bars are 20 µm in a, c and f and 5 µm in the rest images.
Fig. 7
Fig. 7
Confocal microscopy of baboon cone-RBC contacts. In a to b, cones are positively labeled by calbindin D-28k (Calb, pink). Each cone shows a tall fat sock-like pedicle with two vertically arranged segments. PKCα-labeled RBC dendrites (green) contact the lower segment, mostly by superficial contacts (arrow) and sometimes by invaginating contact (dashed arrow). Some cone pedicles do not contact RBCs (open triangle, a). The axon of the RBC (star, b and c), like those of other RBCs, branches at ~50–70% of the IPL depth and terminates near 100% of the IPL depth. The signals (gray arrows) restricted to the center of the IPL, presumably axons of DB4 cone bipolar cells, are almost invisible. In d, PKCα-labeled dendrites (green) contact both a cone pedicle (closed triangle) and rod spherules (asterisks) labeled by PSD-95 (pink), and these contacts (arrows for RBC1, open arrows for RBC2) are manually traced from the image and displayed in e (pink dots). IPL-the inner plexiform layer. The scale bar is 5 µm in a and d and 10 µm in b.
Fig. 8
Fig. 8
GNB5 and mGluR6 expressed in the contacts between cones and RBCs. Mouse (a–f) and baboon (g–j) retinal slices were double- or tripled-labeled. Synaptic contacts were studied in 1–2-µm-thick blocks with a resolution of 30 nm per pixel (d, g and h) and in series of optical sections ≤1 µm-thick (a–c, e and f). d, g and h display the 3D surface profile reconstructed from a series of optical sections with a step of 150–180 nm. GNB5 and mGluR6 (red) are present in contacts (arrow) formed by PKCα-labeled RBC dendrites (blue) and PNA or calbindin (Calb)-labeled cone pedicles (green) (a–d, g and h). Goat anti-mGluR6 (g, h and i) and rabbit anti-mGluR6 (the rest images) label primarily the outer plexiform layer (OPL) in the monkey retina (g to j). In the mouse retina, they label the OPL and inner nuclear layer (e), but the immunoreactivity in the OPL is absent in the mGluR6 knockout mouse (f). The distribution of GNB5 immunoreactivity in the OPL is like mGluR6 immunoreactivity (d). Small regions pointed by open arrows in d, g and h are amplified and depicted to the right. GNB5-G protein beta 5. The scale bar is 10 µm for a–c and 20 µm for e, f, i and j.

Similar articles

Cited by

References

    1. Aartsen WM, Kantardzhieva A, Klooster J, van Rossum AG, van de Pavert SA, Versteeg I, et al. Mpp4 recruits Psd95 and Veli3 towards the photoreceptor synapse. Hum. Mol. Genet. 2006;15:1291–1302. - PubMed
    1. Applebury ML, Antoch MP, Baxter LC, Chun LL, Falk JD, Farhangfar F, et al. The murine cone photoreceptor: a single cone type expresses both S and M opsins with retinal spatial patterning. Neuron. 2000;27:513–523. - PubMed
    1. Arman AC, Sampath AP. Dark-adapted response threshold of OFF ganglion cells is not set by OFF bipolar cells in the mouse retina. J. Neurophysiol. 2012;107:2649–2659. - PMC - PubMed
    1. Bajjalieh SM, Peterson K, Shinghal R, Scheller RH. SV2, a brain synaptic vesicle protein homologous to bacterial transporters. Science. 1992;257:1271–1273. - PubMed
    1. Behrens C, Schubert T, Haverkamp S, Euler T, Berens P. Connectivity map of bipolar cells and photoreceptors in the mouse retina. Elife. 2016;5 - PMC - PubMed

Publication types