. 2018 Sep 15;143(6):1335-1347.
doi: 10.1002/ijc.31536. Epub 2018 Apr 26.

Pre-diagnostic blood immune markers, incidence and progression of B-cell lymphoma and multiple myeloma: Univariate and functionally informed multivariate analyses

Affiliations

Pre-diagnostic blood immune markers, incidence and progression of B-cell lymphoma and multiple myeloma: Univariate and functionally informed multivariate analyses

Roel Vermeulen et al. Int J Cancer. .

Abstract

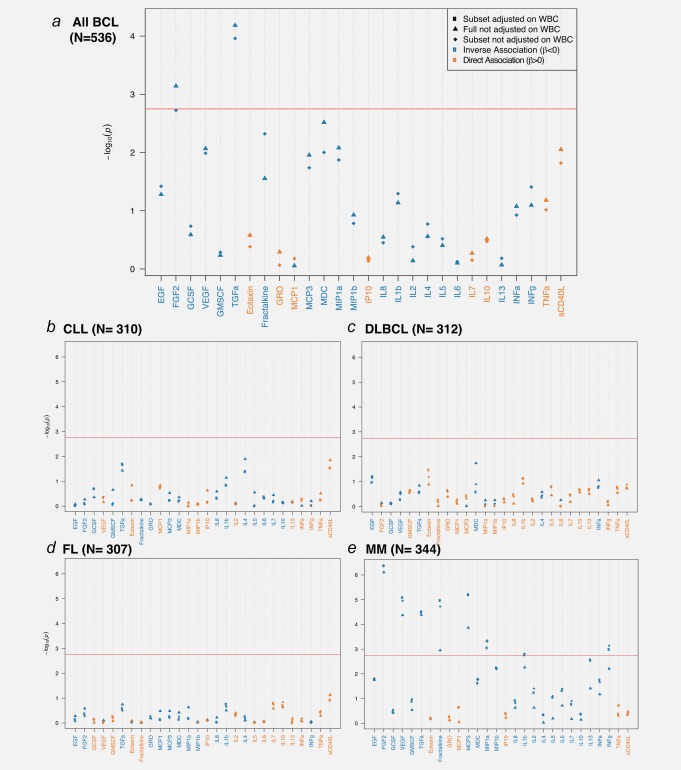
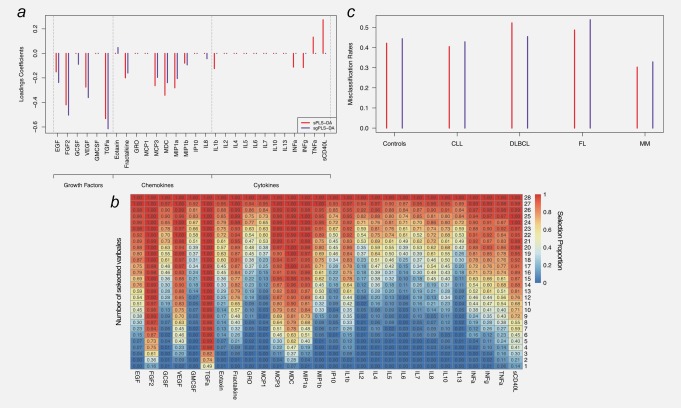
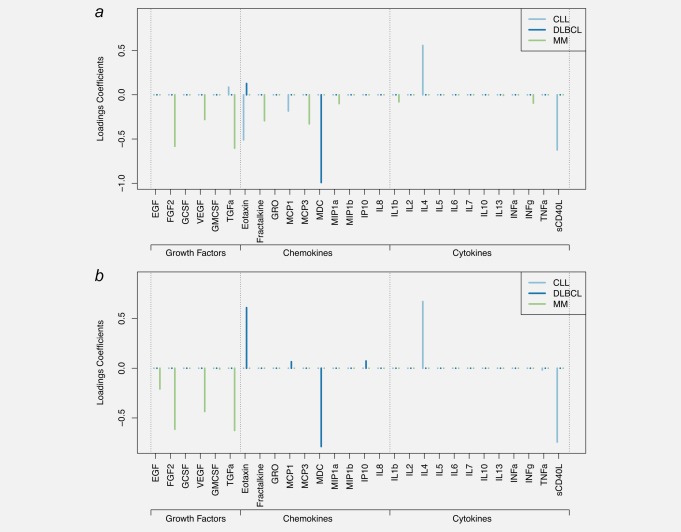
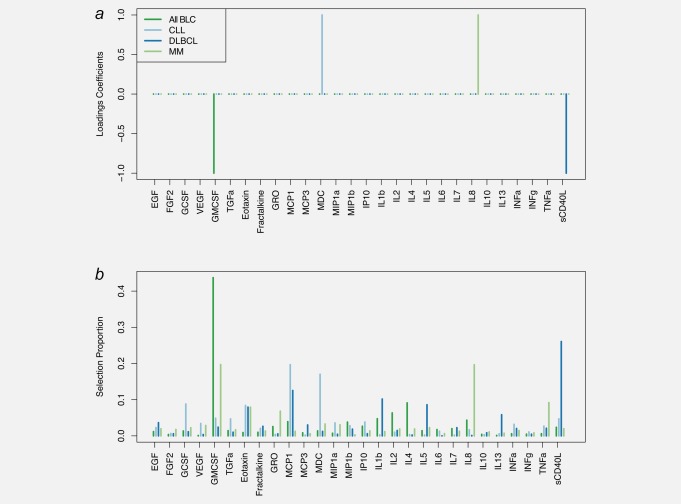
Recent prospective studies have shown that dysregulation of the immune system may precede the development of B-cell lymphomas (BCL) in immunocompetent individuals. However, to date, the studies were restricted to a few immune markers, which were considered separately. Using a nested case-control study within two European prospective cohorts, we measured plasma levels of 28 immune markers in samples collected a median of 6 years before diagnosis (range 2.01-15.97) in 268 incident cases of BCL (including multiple myeloma [MM]) and matched controls. Linear mixed models and partial least square analyses were used to analyze the association between levels of immune marker and the incidence of BCL and its main histological subtypes and to investigate potential biomarkers predictive of the time to diagnosis. Linear mixed model analyses identified associations linking lower levels of fibroblast growth factor-2 (FGF-2 p = 7.2 × 10⁻⁴ ) and transforming growth factor alpha (TGF-α, p = 6.5 × 10⁻⁵ ) and BCL incidence. Analyses stratified by histological subtypes identified inverse associations for MM subtype including FGF-2 (p = 7.8 × 10⁻⁷ ), TGF-α (p = 4.08 × 10⁻⁵ ), fractalkine (p = 1.12 × 10⁻³ ), monocyte chemotactic protein-3 (p = 1.36 × 10⁻⁴ ), macrophage inflammatory protein 1-alpha (p = 4.6 × 10⁻⁴ ) and vascular endothelial growth factor (p = 4.23 × 10⁻⁵ ). Our results also provided marginal support for already reported associations between chemokines and diffuse large BCL (DLBCL) and cytokines and chronic lymphocytic leukemia (CLL). Case-only analyses showed that Granulocyte-macrophage colony stimulating factor levels were consistently higher closer to diagnosis, which provides further evidence of its role in tumor progression. In conclusion, our study suggests a role of growth-factors in the incidence of MM and of chemokine and cytokine regulation in DLBCL and CLL.

Keywords: cytokine; lymphoma; mixed-effect modeling; multiple myeloma; multivariate models; prospective cohort; time to diagnosis.


Figures

Figure 1
Figure 1
Results of the mixed model analyses between log‐transformed values of immune markers and all BCL case–control status (a, N = 268 pairs). Results are also presented for main histological subtypes: CLL (b, N = 42 cases and 268 controls), DLBCL (c, N = 44 cases and 268 controls), FL (d, N = 39 cases and 268 controls) and MM (e, N = 76 cases and 268 controls). Strength of association (Y‐axis) is measured by p values and the black horizontal line represents the Bonferroni cut‐off value ensuring a control of the FWER below 0.05. Inverse associations are represented in blue and positive associations in orange, and the names of the proteins are colored accordingly. Results are presented for the full study population, and for the (N = 224) pairs in which WBC composition estimates were available (N = 224 case/control pairs), models are either adjusted (squares) or unadjusted (diamonds) of WBC proportions. Abbreviations: IL, interleukin; INF‐α, interferon alpha; INF‐γ, interferon gamma; GMCSF, granulocyte–macrophage colony stimulating factor; TNF‐α, tumor necrosis factor alpha; EGF, epidermal growth factor; FGF‐2, fibroblast growth factor 2; GCSF, granulocyte colony‐stimulating factor; GRO, melanoma growth stimulatory activity/growth‐related oncogene; IP10, INF‐γ‐induced protein 10; MCP‐1, monocyte chemotactic protein‐1; MCP‐3, monocyte chemotactic protein‐3; MDC, macrophage derived chemokine; MIP‐1α, macrophage inflammatory protein 1 alpha; MIP‐1ß, macrophage inflammatory protein 1 beta; sCD40L, soluble CD40 ligand; VEGF, vascular endothelial growth factor; TGF‐α, transforming growth factor alpha. [Color figure can be viewed at http://wileyonlinelibrary.com]
Figure 2
Figure 2
Results of the sparse and sparse group PLS‐DA (sPLS‐DA and sgPLS‐DA, respectively) analyses for all BCL cases. Loadings coefficients are presented for sPLS‐DA and sgPLS‐DA (a). Results from the stability analyses of sPLS‐DA analyses subsampling (N = 10,000 times) 80% of the study population are summarized in (b) and represents for each protein (X‐axis) and each possible number of selected variables (Y‐axis), the selection proportion (across the 10,000 repeats). Misclassification rates for each variant of the PLS algorithm used are presented in (c), for controls and each BCL subtype separately. Abbreviations: IL, interleukin; INF‐α, interferon alpha; INF‐γ, interferon gamma; GMCSF, granulocyte–macrophage colony stimulating factor; TNF‐α, tumor necrosis factor alpha; EGF, epidermal growth factor; FGF‐2, fibroblast growth factor 2; GCSF, granulocyte colony‐stimulating factor; GRO, melanoma growth stimulatory activity/growth‐related oncogene; IP10, INF‐γ‐induced protein 10; MCP‐1, monocyte chemotactic protein‐1; MCP‐3, monocyte chemotactic protein‐3; MDC, macrophage derived chemokine; MIP‐1α, macrophage inflammatory protein 1 alpha; MIP‐1ß, macrophage inflammatory protein 1 beta; sCD40L, soluble CD40 ligand; VEGF, vascular endothelial growth factor; TGF‐α, transforming growth factor alpha. [Color figure can be viewed at http://wileyonlinelibrary.com]
Figure 3
Figure 3
Results of the sparse PLS‐DA (sPLS‐DA) and sparse group PLS‐DA (sgPLS‐DA). Models were fitted on subtype‐specific sets of cases and controls. Loadings coefficients are presented for DLBCL, CLL and MM separately for the sPLS‐DA model (a), and the sgPLS‐DA (b) models. Models for FL are not reported as they yielded poor predictive performances. Abbreviations: IL, interleukin; INF‐α, interferon alpha; INF‐γ, interferon gamma; GMCSF, granulocyte–macrophage colony stimulating factor; TNF‐α, tumor necrosis factor alpha; EGF, epidermal growth factor; FGF‐2, fibroblast growth factor 2; GCSF, granulocyte colony‐stimulating factor; GRO, melanoma growth stimulatory activity/growth‐related oncogene; IP10, INF‐γ‐induced protein 10; MCP‐1, monocyte chemotactic protein‐1; MCP‐3, monocyte chemotactic protein‐3; MDC, macrophage derived chemokine; MIP‐1α, macrophage inflammatory protein 1 alpha; MIP‐1ß, macrophage Inflammatory Protein 1 beta; sCD40L, soluble CD40 ligand; VEGF, vascular endothelial growth factor; TGF‐α, transforming growth factor alpha. [Color figure can be viewed at http://wileyonlinelibrary.com]
Figure 4
Figure 4
Results of the sparse PLS analyses of time to diagnosis in cases only. Results are presented for all BCL cases and for cases of DLBCL, CLL and MM separately. Loadings coefficients obtained for the calibrated models are presented for each set of cases considered (a). Results from stability analyses using 10,000 subsamples of the full set of cases are represented in B by the per‐variable proportion of selection across all independent subsamples. Abbreviations: IL, interleukin; INF‐α, interferon alpha; INF‐γ, interferon gamma; GMCSF, granulocyte–macrophage colony stimulating factor; TNF‐α, tumor necrosis factor alpha; EGF, epidermal growth factor; FGF‐2, fibroblast growth factor 2; GCSF, granulocyte colony‐stimulating factor; GRO, melanoma growth stimulatory activity/growth‐related oncogene; IP10, INF‐γ‐induced protein 10; MCP‐1, monocyte chemotactic protein‐1; MCP‐3, monocyte chemotactic protein‐3; MDC, macrophage derived chemokine; MIP‐1α, macrophage inflammatory protein 1 alpha; MIP‐1ß, macrophage inflammatory protein 1 beta; sCD40L, soluble CD40 ligand; VEGF, vascular endothelial growth factor; TGF‐α, transforming growth factor alpha. [Color figure can be viewed at http://wileyonlinelibrary.com]

References

    1. Müller AM, Ihorst G, Mertelsmann R, et al. Epidemiology of non‐Hodgkin's lymphoma (NHL): trends, geographic distribution, and etiology. Ann Hematol 2005;84:1–12. - PubMed
    1. Jaffe ES, Harris NL, Stein H, et al. World health organization classification of tumours: pathology and genetics of tumours of hematopoietic and lymphoid tissues. International Agency for Research on Cancer, 2001.
    1. Purdue MP, Lan Q, Kemp TJ, et al. Elevated serum sCD23 and sCD30 up to two decades prior to diagnosis associated with increased risk of non‐Hodgkin lymphoma. Leukemia 2015;29:1429–31. - PMC - PubMed
    1. Bassig BA, Shu XO, Koh WP, et al. Soluble levels of CD27 and CD30 are associated with risk of non‐Hodgkin lymphoma in three Chinese prospective cohorts. Int J Cancer 2015;137:2688–95. - PMC - PubMed
    1. De Roos AJ, Mirick DK, Edlefsen KL, et al. Markers of B‐cell activation in relation to risk of non‐Hodgkin lymphoma. Cancer Res 2012;72:4733–43. - PMC - PubMed

Publication types

MeSH terms