. 2018 Jul 1;120(1):274-280.
doi: 10.1152/jn.00150.2018. Epub 2018 Apr 18.

Local tuning biases in mouse primary visual cortex

Affiliations

Local tuning biases in mouse primary visual cortex

Luis O Jimenez et al. J Neurophysiol. .

Abstract

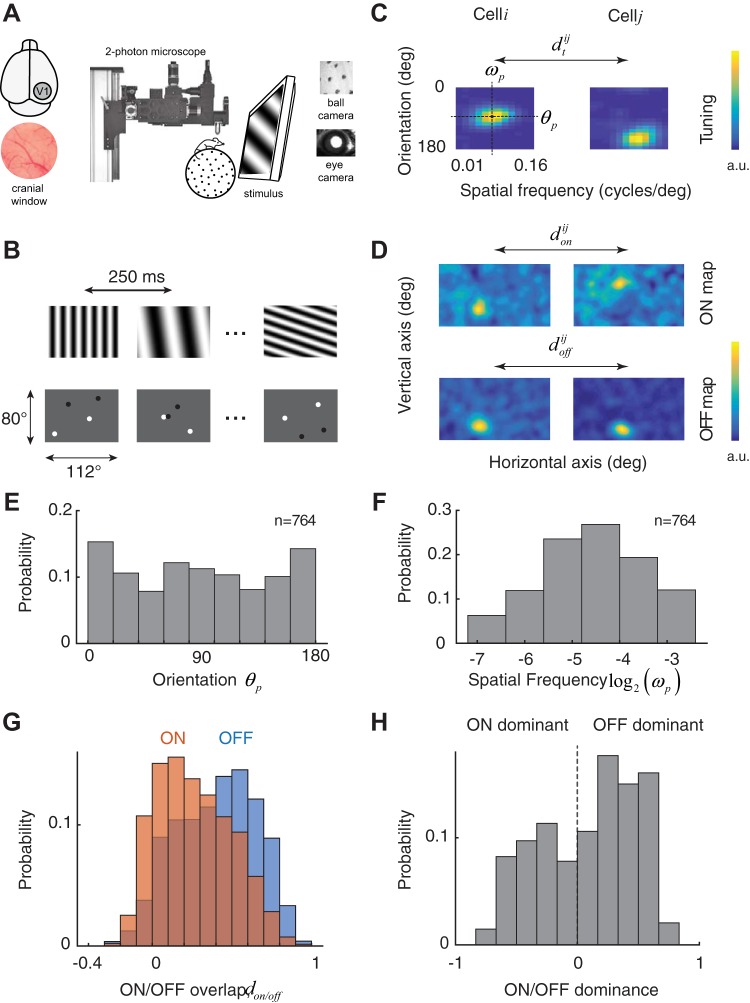
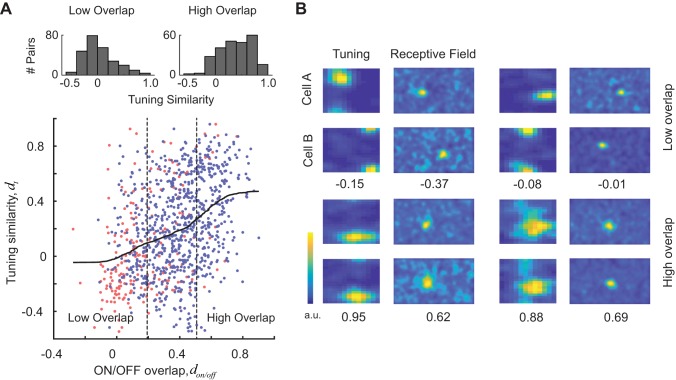
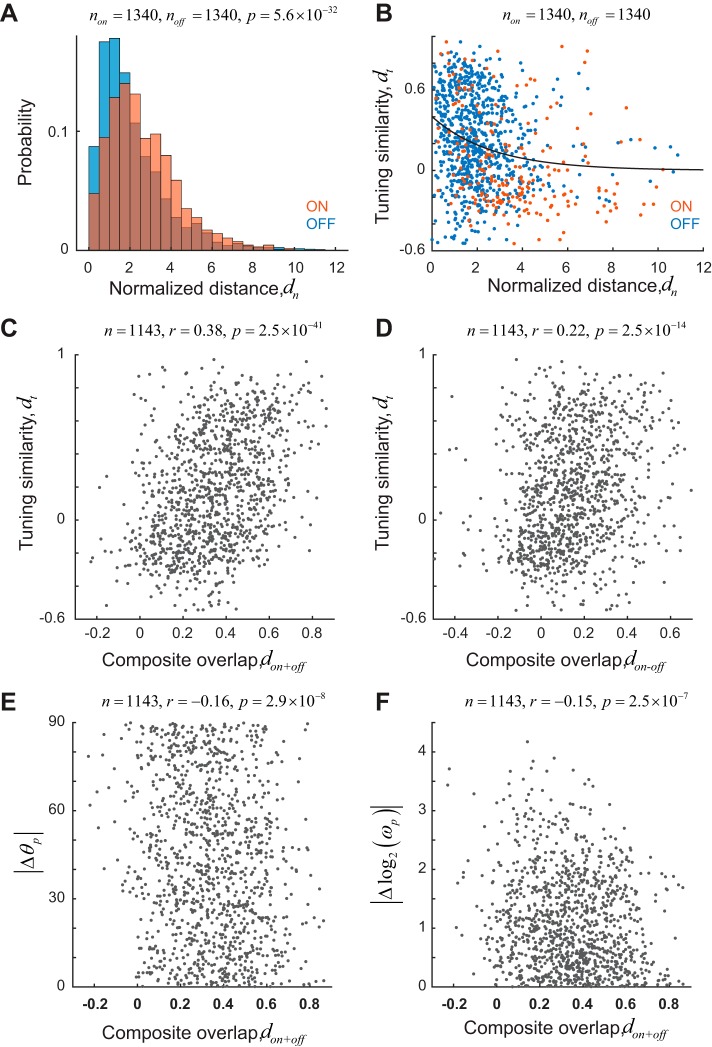
Neurons in primary visual cortex are selective to the orientation and spatial frequency of sinusoidal gratings. In the classic model of cortical organization, a population of neurons responding to the same region of the visual field but tuned to all possible feature combinations provides a detailed representation of the local image. Such a functional module is assumed to be replicated across primary visual cortex to provide a uniform representation of the image across the entire visual field. In contrast, it has been hypothesized that the tiling properties of ON- and OFF-center receptive fields in the retina, largely mirrored in the geniculate, may constrain cortical tuning at each location in the visual field. This model predicts the existence of local biases in tuning that vary across the visual field and would prevent the cortex from developing a uniform, modular representation as postulated by the classic model. Here, we confirm the existence of local tuning biases in the primary visual cortex of the mouse, lending support to the notion that cortical tuning may be constrained by signals from the periphery. NEW & NOTEWORTHY Populations of cortical neurons responding to the same part of the visual field are shown to have similar tuning. Such local biases are consistent with the hypothesis that cortical tuning, in mouse primary visual cortex, is constrained by signals from the periphery.

Keywords: population coding; primary visual cortex; receptive fields.


Figures

Fig. 1.
Fig. 1.
Experimental setup and basic measures of receptive fields and tuning selectivity. A: experimental setup: 2-photon imaging in awake behaving mouse. A cranial window is implanted over the primary visual cortex (area V1). Mice are head-restrained but otherwise free to walk, rest, or groom on a spherical treadmill. Eye movements and locomotion are monitored by cameras synchronized to the microscope. B: pseudorandom sequences of full-field, sinusoidal gratings were used to map the tuning for orientation and spatial frequency. Sparse noise stimuli consisting of randomly flashed dark and bright disks were used to map the ON and OFF subregions of each cell. C: 2 examples of tuning kernels in the orientation and spatial frequency domain. Kernels are normalized and presented in arbitrary units (a.u.). Spatial frequency was sampled in equal steps in a logarithmic scale. From the kernels, we estimate the preferred orientation of the cell, θp, as well as its preferred spatial frequency, ωp. Similarity between the tuning kernels of 2 cells, i and j, is denoted by dtij. deg, Degrees. D: 2 examples of ON and OFF maps. Kernels are normalized and presented in arbitrary units. Dimensions of the image in visual space correspond to the ones displayed in B. Similarities between ON and OFF maps of 2 cells, i and j, are denoted by donij and doffij, respectively. E: distribution of preferred orientation in the population. There is a slight overrepresentation of the cardinal orientations. F: distribution of preferred spatial frequency. G: distribution of ON and OFF subregion overlap in cells ≤100 μm apart from each other. There is a higher scatter for ON than OFF subregions. H: histogram of the relative amplitudes of ON and OFF kernels shows a slight dominance of OFF responses.
Fig. 2.
Fig. 2.
Evidence of local tuning bias in mouse primary visual cortex. A, bottom: tuning similarity (dt) is positively correlated with receptive field overlap of both ON and OFF subregions (don and doff). Scatterplot shows tuning similarity against the overlap of ON or OFF subregions. Pairs of cells may be plotted twice, once showing the overlap of ON subregions (red points) and once showing the overlap with OFF subregions (blue points). Solid curve represents a smoothed version of the scatterplot obtained via local regression. Top: histograms of tuning similarity values for pairs with low and high overlap (defined by the vertical, dashed lines). Pairs with high degree of receptive field overlap have a significantly higher similarity of tuning than pairs with low degree of receptive field overlap. #, Number of. B: examples of 4 cell pairs with different degrees of receptive field overlap and tuning similarity. For each pair, the tuning similarity and receptive field overlap values are shown at the bottom. Top row shows examples of cell pairs with low degree of receptive field overlap and tuning similarity. Bottom row shows examples of cell pairs with high degree of receptive field overlap and tuning similarity. a.u., Arbitrary units.
Fig. 3.
Fig. 3.
Robustness of correlation between tuning similarity and receptive field overlap. A: distribution of normalized distance (dn), a measure of receptive field overlap, for ON (red) and OFF (blue) subregions for pairs ≤100 μm apart on the cortex. ON subregions show larger positional scatter. B: tuning similarity is inversely correlated with normalized distance. Solid line represents an exponential fit to the data. Receptive fields with overlapping receptive fields tend to have higher tuning similarity than receptive fields that are far apart in the visual field. Blue dots represent OFF subregions. Red dots represent ON subregions. C and D: tuning similarity is correlated with receptive field overlap measures based on the sum (don+off) or difference (don−off) of ON and OFF maps. E and F: absolute differences of preferred orientation (|Δθp|) and spatial frequency [|Δlog2p)|] are correlated with receptive field overlap based on the sum of ON and OFF maps.

Comment in

  • Seeing with a biased visual cortical map.
    Mazade R, Niell CM, Alonso JM. Mazade R, et al. J Neurophysiol. 2018 Jul 1;120(1):272-273. doi: 10.1152/jn.00305.2018. Epub 2018 May 9. J Neurophysiol. 2018. PMID: 29742024 Free PMC article. No abstract available.

References

    1. Berens P, Freeman J, Deneux T, Chenkov N, McColgan T, Speiser A, Macke JH, Turaga SC, Mineault P, Rupprecht P, Gerhard S, Friedrich RW, Friedrich J, Paninski L, Pachitariu M, Harris KD, Bolte B, Machado TA, Ringach D, Stone J, Rogerson LE, Sofroniew NJ, Reimer J, Froudarakis E, Euler T, Román Rosón M, Theis L, Tolias AS, Bethge M. Community-based benchmarking improves spike rate inference from two-photon calcium imaging data. PLoS Comput Biol 14: e1006157, 2018. doi:10.1371/journal.pcbi.1006157. - DOI - PMC - PubMed
    1. Bonin V, Histed MH, Yurgenson S, Reid RC. Local diversity and fine-scale organization of receptive fields in mouse visual cortex. J Neurosci 31: 18506–18521, 2011. doi:10.1523/JNEUROSCI.2974-11.2011. - DOI - PMC - PubMed
    1. Bosking WH, Crowley JC, Fitzpatrick D. Spatial coding of position and orientation in primary visual cortex. Nat Neurosci 5: 874–882, 2002. doi:10.1038/nn908. - DOI - PubMed
    1. Brainard DH. Color and the cone mosaic. Annu Rev Vis Sci 1: 519–546, 2015. doi:10.1146/annurev-vision-082114-035341. - DOI - PubMed
    1. Cruz-Martín A, El-Danaf RN, Osakada F, Sriram B, Dhande OS, Nguyen PL, Callaway EM, Ghosh A, Huberman AD. A dedicated circuit links direction-selective retinal ganglion cells to the primary visual cortex. Nature 507: 358–361, 2014. doi:10.1038/nature12989. - DOI - PMC - PubMed

Publication types

LinkOut - more resources