. 2018 Apr 17;48(4):730-744.e5.
doi: 10.1016/j.immuni.2018.03.020.

Self-Renewal and Toll-like Receptor Signaling Sustain Exhausted Plasmacytoid Dendritic Cells during Chronic Viral Infection

Affiliations

Self-Renewal and Toll-like Receptor Signaling Sustain Exhausted Plasmacytoid Dendritic Cells during Chronic Viral Infection

Monica Macal et al. Immunity. .

Abstract

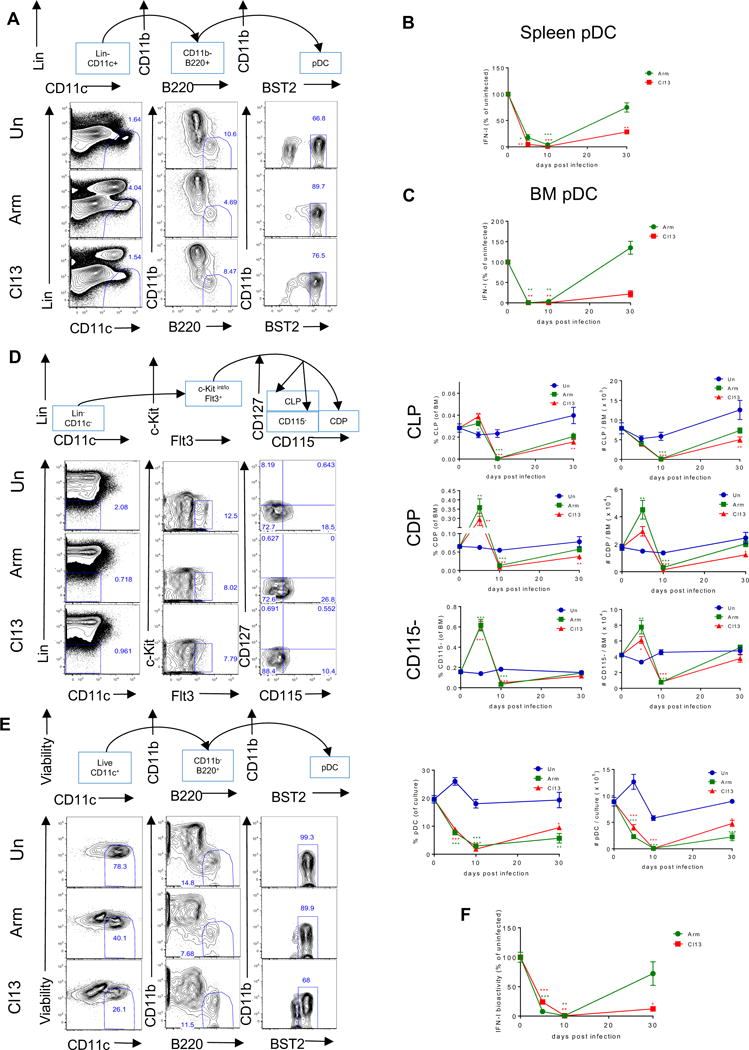
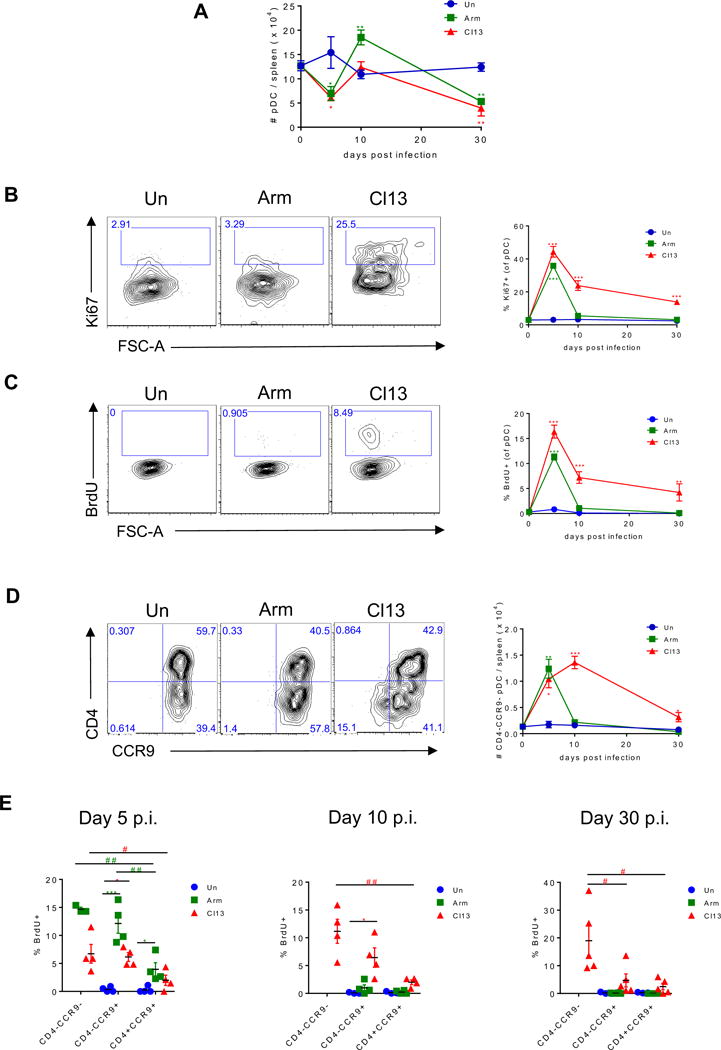
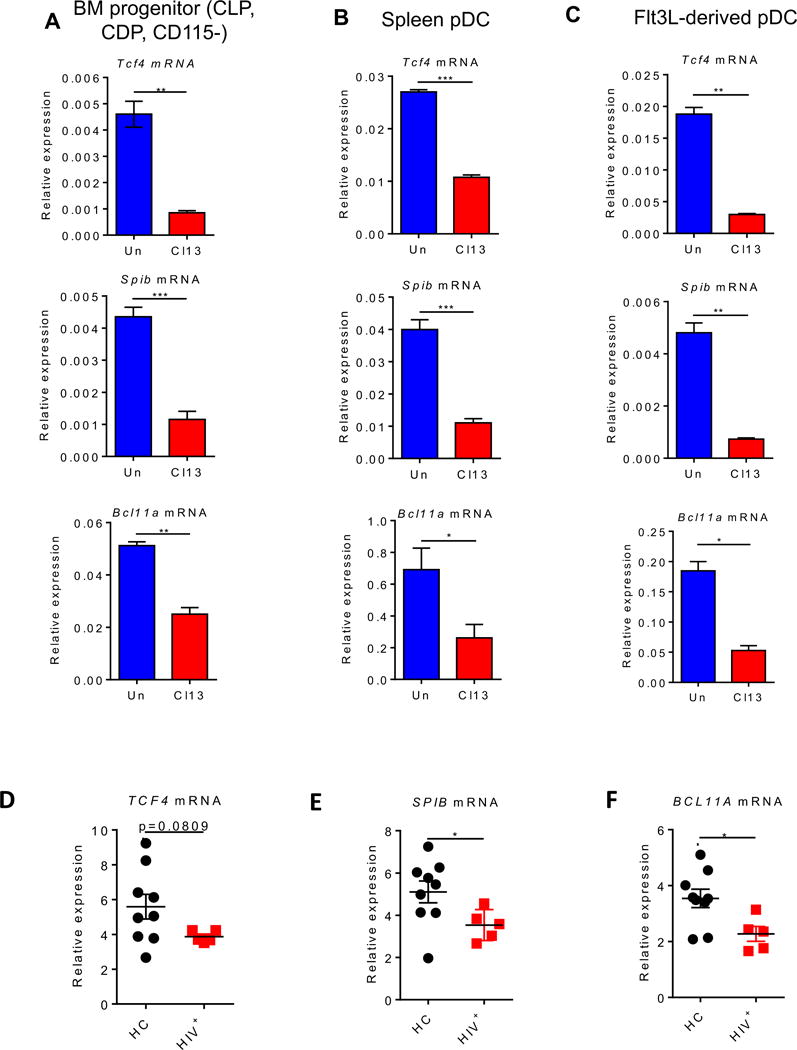
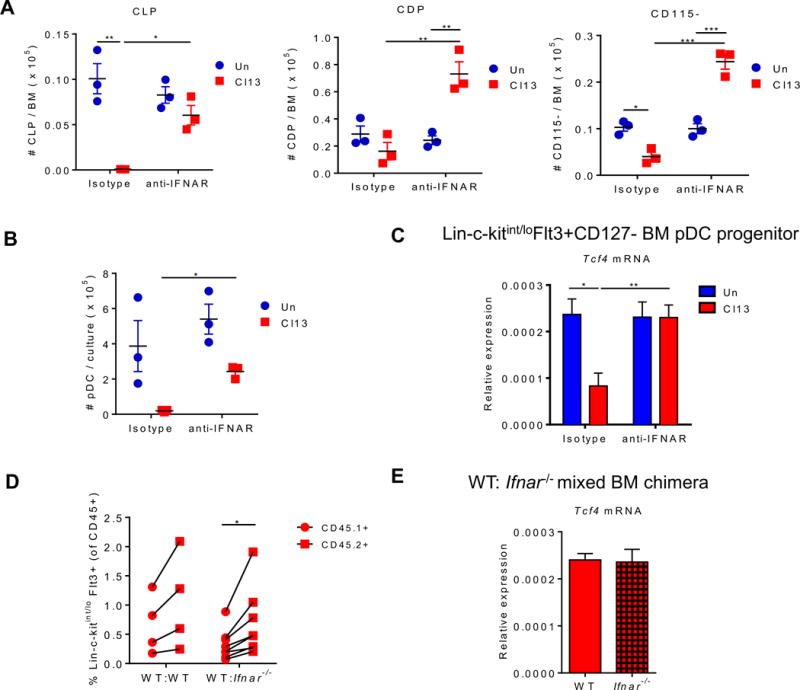
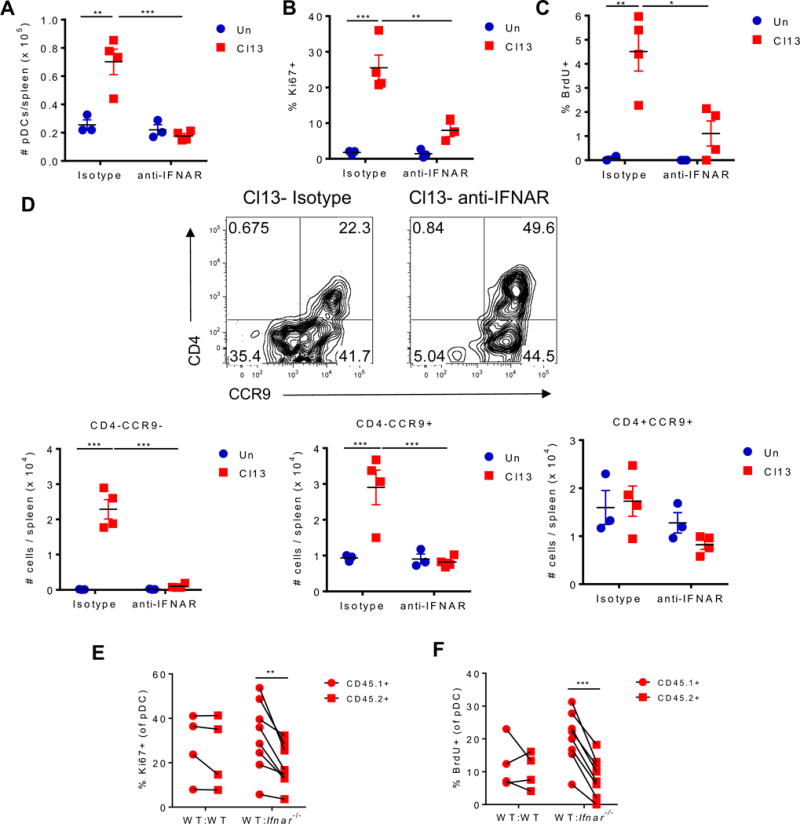
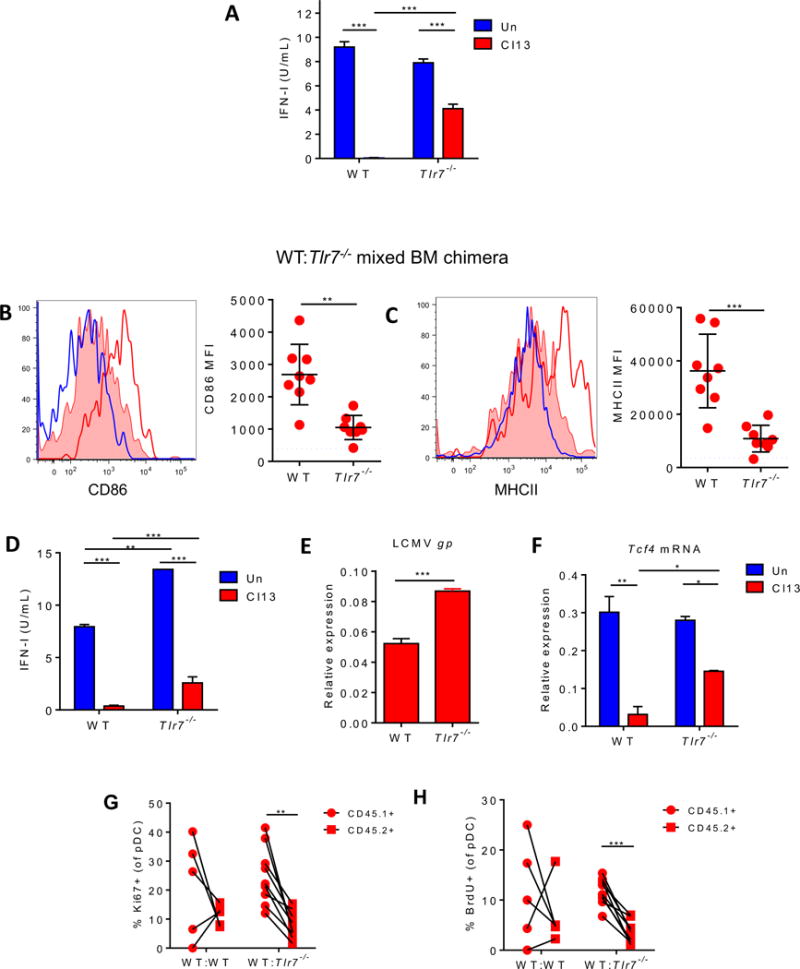
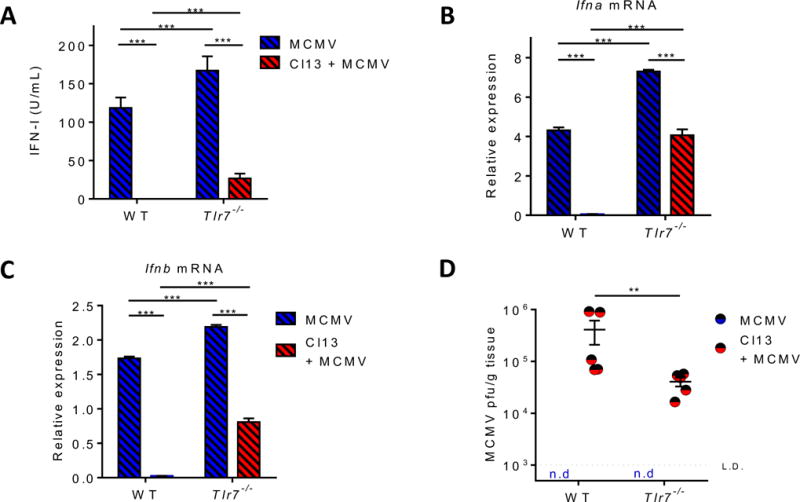
Although characterization of T cell exhaustion has unlocked powerful immunotherapies, the mechanisms sustaining adaptations of short-lived innate cells to chronic inflammatory settings remain unknown. During murine chronic viral infection, we found that concerted events in bone marrow and spleen mediated by type I interferon (IFN-I) and Toll-like receptor 7 (TLR7) maintained a pool of functionally exhausted plasmacytoid dendritic cells (pDCs). In the bone marrow, IFN-I compromised the number and the developmental capacity of pDC progenitors, which generated dysfunctional pDCs. Concurrently, exhausted pDCs in the periphery were maintained by self-renewal via IFN-I- and TLR7-induced proliferation of CD4- subsets. On the other hand, pDC functional loss was mediated by TLR7, leading to compromised IFN-I production and resistance to secondary infection. These findings unveil the mechanisms sustaining a self-perpetuating pool of functionally exhausted pDCs and provide a framework for deciphering long-term exhaustion of other short-lived innate cells during chronic inflammation.

Keywords: HIV; LCMV; TLR; cancer; chronic viral infection; exhaustion; plasmacytoid dendritic cells; type I interferon.


Conflict of interest statement

Declaration of Interests

The authors declare no competing interests.

Figures

Figure 1
Figure 1. BM pDC progenitors are reduced in number and have compromised capacity to generate functional pDCs long-term after chronic LCMV infection. See also Figures S1 and S2
Wild-type (WT) mice were infected with LCMV ARM (green) or Cl13 (red) or left uninfected (blue) and sacrificed at days 5, 10, and 30 p.i. (A) Representative flow cytometric analysis of pDCs as LinCD11c+CD11bB220+BST2+ in spleen at day 10 p.i. Lineage-negative gating (Lin) includes markers for Thy1.2, CD19, and NK1.1. (B-C) FACS-purified splenic pDCs (B) or BM pDCs (C) were stimulated with CpG-B for 15 hours and IFN-I activity in the supernatant was quantified. Graphs depict the percentage change in IFN-I activity normalized to the uninfected mice processed in parallel at each time point. (D) Representative flow cytometric analysis of BM pDC progenitors at day 10 p.i. where CLPs were identified as Linc-kitint/loFlt3+CD115CD127+, CDPs as Linc-kitint/loFlt3+CD115+CD127, and CD115 as Linc-kitint/loFlt3+CD115CD127. Lin includes markers for Thy1.2, CD19, NK1.1, CD3, CD4, CD8, B220, CD11b, Gr-1, and Ter119. Graphs depict the percentage (left) and the absolute number (right) of indicated progenitors in BM at each time point. (E) BM cells were cultured with Flt3L and pDCs were identified as CD11c+CD11bB220+BST2high at day 8 post-culture. Representative FACS plots for BM-Flt3L-derived pDCs and graphs depicting their percentage (left) and absolute number (right) in the culture are shown. (F) FACS-purified BM-Flt3L-derived pDCs were stimulated with CpG-A for 15 hours and IFN-I activity in the supernatant was quantified. Graph depicts the percentage change in IFN-I activity normalized to the culture from uninfected mice processed in parallel at each time point. Graphs depict mean ± SEM. Data are representative of 2-3 independent experiments with 3-10 mice/group. *p<0.05, **p<0.01, ***p<0.001 (one-way Anova to compare ARM-infected (green asterisks) and Cl13-infected (red asterisks) groups to uninfected group processed in parallel at each time point).
Figure 2
Figure 2. Splenic pDCs proliferate and CD4- subsets expand throughout chronic LCMV infection. See also Figure S3
WT mice were infected with LCMV ARM (green) or Cl13 (red) or left uninfected (blue) and sacrificed at day 5, 10, and 30 p.i. Splenic pDCs were analyzed to determine their absolute number (A), Ki67 expression (B), BrdU incorporation in vivo (C), absolute number of CD4CCR9 pDC subset (D) and BrdU incorporation by CD4+CCR9+, CD4CCR9+, and CD4CCR9- subsets (E). (B-D) Representative FACS plots indicate spleen pDCs from day 10 p.i. (A-E) Graphs depict mean ± SEM. Data are representative of 2-3 independent experiments with 3-5 mice/group. (A) Data obtained at day 10 after Cl13 infection are representative of 11 independent repeats with 7 and 4 experiments showing enhanced or unchanged pDC numbers vs. uninfected controls, respectively. (E) Symbols represent individual mice. *, # p<0.05, **, ## p<0.01, *** p<0.001 (one-way Anova to compare ARM-infected (green asterisks) and Cl13-infected group (red asterisks) to uninfected group processed in parallel at each time point (A-E) or to compare CD4+CCR9+, CD4CCR9+, and CD4CCR9 subsets in ARM-infected (green pounds) or Cl13-infected group (red pounds) (E)).
Figure 3
Figure 3. E2-2, SPIB and BCL11A are down-regulated in pDCs and their progenitors from LCMV Cl13-infected mice as well as in pDCs from HIV infected patients. See also Figure S4 and Table S1
(A-C) WT mice were infected with LCMV Cl13 (red) or left uninfected (blue) and sacrificed at day 9 p.i. FACS-purified BM progenitors (Linc-kitint/loFlt3+) (A) and splenic pDCs (B) were evaluated for Tcf4 (top), Spib (middle), and Bcl11a (bottom) transcripts relative to Gapdh. Lin includes markers for Thy1.2, CD19, NK1.1, CD3, CD4, CD8, B220, CD11b, Gr-1, and Ter119. (C) BM cells were cultured with Flt3L for 8 days and FACS-purified BM-Flt3L-derived pDCs were evaluated for Tcf4 (top), Spib (middle), and Bcl11a (bottom) transcripts relative to Gapdh. (D-F) Enriched pDCs from peripheral blood of HIV-negative healthy controls (HC; black) and chronically HIV-infected patients (HIV+; red) were evaluated for TCF4 (D), SPIB (E), and BCL11A (F) transcripts relative to GAPDH. (A-C) Data are representative of 2-3 independent experiments with 3-4 mice/group. (D-F) Symbols represent individual blood donors. Bars depict mean ± SEM. *p<0.05, **p<0.01, ***p<0.001 (unpaired, two-tailed t-test (A-C) or Mann-Whitney test (D-F)).
Figure 4
Figure 4. IFN-I signaling suppresses BM pDC progenitors during chronic LCMV infection
(A-C) WT mice were treated with isotype or anti-IFNAR nAb beginning 1 day before and throughout LCMV Cl13 infection and sacrificed at day 9 p.i. Absolute number of CLPs, CDPs, and CD115 (A) and pDCs derived from BM-Flt3L-cultures (continuing treatment with isotype or anti-IFNAR nAb in vitro) at day 8 post-culture (B) were quantified. (C) FACS-purified BM pDC progenitors (Lin-c-kitint/loFlt3+CD127) were evaluated for Tcf4 expression relative to Gapdh. Lin includes markers for Thy1.2, CD19, NK1.1, CD3, CD4, CD8, B220, CD11b, Gr-1, and Ter119. (D-E) Mixed BM chimeras were generated using BM from WT (CD45.1+) and WT or Ifnar−/− (CD45.2+) mice and infected with LCMV Cl13 for 9 days. (D) Percentages of Linc-kitint/loFlt3+ pDC progenitors within CD45.1+ or CD45.2+ cells in BM of mixed chimeras. Connected symbols indicate values from the same mouse. (E) FACS-purified Linc-kitint/loFlt3+ BM pDC progenitors from WT and Ifnar−/− compartment were evaluated for Tcf4 transcripts relative to Gapdh. Bars depict mean ± SEM and symbols represent individual mice. Data are representative of 2-3 independent experiments with 3-4 mice/group (A-C and E) or pooled from 2 independent experiments with 2-4 mice/group (D). *p<0.05, **p<0.01 (two-way Anova (A-C), paired t-test (D), or unpaired, two-tailed t-test (E)).
Figure 5
Figure 5. IFN-I signaling promotes splenic pDC proliferation and increase in CD4- pDC subsets during chronic LCMV infection
(A-D) WT mice were treated with isotype or anti-IFNAR nAb beginning 1 day before and throughout LCMV Cl13 infection and sacrificed at day 9 p.i. Splenic pDCs were evaluated for their absolute numbers (A), Ki67 expression (B), BrdU incorporation (C), and numbers of CD4+CCR9+, CD4CCR9+, and CD4CCR9 subsets (D). (D) Representative FACS plots indicate frequency of CD4+CCR9+, CD4CCR9+, and CD4CCR9 subsets in spleen pDCs. (E-F) Mixed BM chimeras were generated using BM from WT (CD45.1+) and WT or Ifnar−/− (CD45.2+) mice and infected with LCMV Cl13 for 9 days. Splenic pDCs from the CD45.1+ or CD45.2+ compartment were analyzed to determine their Ki67 expression (E) and BrdU incorporation in vivo (F). Data are representative of 1 (C) or 2 (A, B, and D) independent experiments with 3-4 mice/group or pooled from 2 independent experiments with 2-4 mice/group (E-F). Bars depict mean ± SEM. Symbols represent individual mice. *p<0.05, **p<0.01, ***p<0.001 (two-way Anova (A-D) or paired t-test (E-F)).
Figure 6
Figure 6. TLR7 suppresses pDC IFN-I production and promotes their proliferation during chronic LCMV infection. See also Figures S5 and S6
(A) WT and Tlr7−/− mice were left uninfected (blue) or infected with LCMV Cl13 for 9 days (red). FACS-purified splenic pDCs were stimulated with CpG-B and IFN-I activity in the supernatant was quantified. (B-H) Mixed BM chimeras were generated using BM from WT (CD45.1+) and Tlr7−/− (CD45.2+) mice and infected with LCMV Cl13 for 9 days. Representative histograms of CD86 (B) and MHCII (C) expression on splenic pDCs from WT uninfected mice (blue open) and WT (red open) and Tlr7−/− compartments (red filled) of Cl13-infected chimeric mice are shown. Graphs depict CD86 (B) and MHCII (C) MFI in pDCs from infected chimeric mice. Dotted line indicates the average MFI in WT uninfected mice. FACS-purified splenic pDCs were stimulated with CpG-B and IFN-I activity in the supernatant was quantified (D). Splenic pDCs were evaluated for LCMV gp (E) and Tcf4 (F) transcripts relative to Gapdh, Ki67 expression (G) and BrdU incorporation in vivo (H). Bars depict mean ± SEM. Symbols represent individual mice. Data are representative of 2-3 independent experiments with 3-5 mice/group (A-F) or are pooled from 2 independent experiments with 2-5 mice/group (G-H). *p<0.05, **p<0.01, ***p<0.001 (two-way Anova (A, D, and F), unpaired, two-tailed t-test (B, C, and E) or paired t-test (G-H)).
Figure 7
Figure 7. TLR7 enhances susceptibility to secondary infection during chronic LCMV infection. See also Figure S7
Uninfected and LCMV Cl13-infected WT and Tlr7−/− mice were infected with MCMV at day 20 p.i. 36 hours after MCMV infection, serum IFN-I activity was quantified (A) and FACS-purified splenic pDCs were evaluated for Ifnα (B) and Ifnβ (C) transcripts relative to Gapdh. MCMV titers in the liver were determined 3.5 days after MCMV infection (D). Dotted line represents the limit of detection. Bars depict mean ± SEM. Symbols represent individual mice. Data are representative of 2-3 independent experiments with 3-5 mice/group. **p<0.01, ***p<0.001 (two-way Anova).

Similar articles

Cited by

References

    1. Ahmed R, Salmi A, Butler LD, Chiller JM, Oldstone MB. Selection of genetic variants of lymphocytic choriomeningitis virus in spleens of persistently infected mice. Role in suppression of cytotoxic T lymphocyte response and viral persistence. J Exp Med. 1984;160:521–540. - PMC - PubMed
    1. Asselin-Paturel C, Brizard G, Pin JJ, Briere F, Trinchieri G. Mouse strain differences in plasmacytoid dendritic cell frequency and function revealed by a novel monoclonal antibody. J Immunol. 2003;171:6466–6477. - PubMed
    1. Attanasio J, Wherry EJ. Costimulatory and Coinhibitory Receptor Pathways in Infectious Disease. Immunity. 2016;44:1052–1068. - PMC - PubMed
    1. Biancotto A, Grivel JC, Iglehart SJ, Vanpouille C, Lisco A, Sieg SF, Debernardo R, Garate K, Rodriguez B, Margolis LB, Lederman MM. Abnormal activation and cytokine spectra in lymph nodes of people chronically infected with HIV-1. Blood. 2007;109:4272–4279. - PMC - PubMed
    1. Blasius AL, Giurisato E, Cella M, Schreiber RD, Shaw AS, Colonna M. Bone marrow stromal cell antigen 2 is a specific marker of type I IFN-producing cells in the naive mouse, but a promiscuous cell surface antigen following IFN stimulation. J Immunol. 2006;177:3260–3265. - PubMed

Publication types

MeSH terms