. 2018 Apr 18;10(437):eaar6759.
doi: 10.1126/scitranslmed.aar6759.

CD32 is expressed on cells with transcriptionally active HIV but does not enrich for HIV DNA in resting T cells

Affiliations

CD32 is expressed on cells with transcriptionally active HIV but does not enrich for HIV DNA in resting T cells

Mohamed Abdel-Mohsen et al. Sci Transl Med. .

Abstract

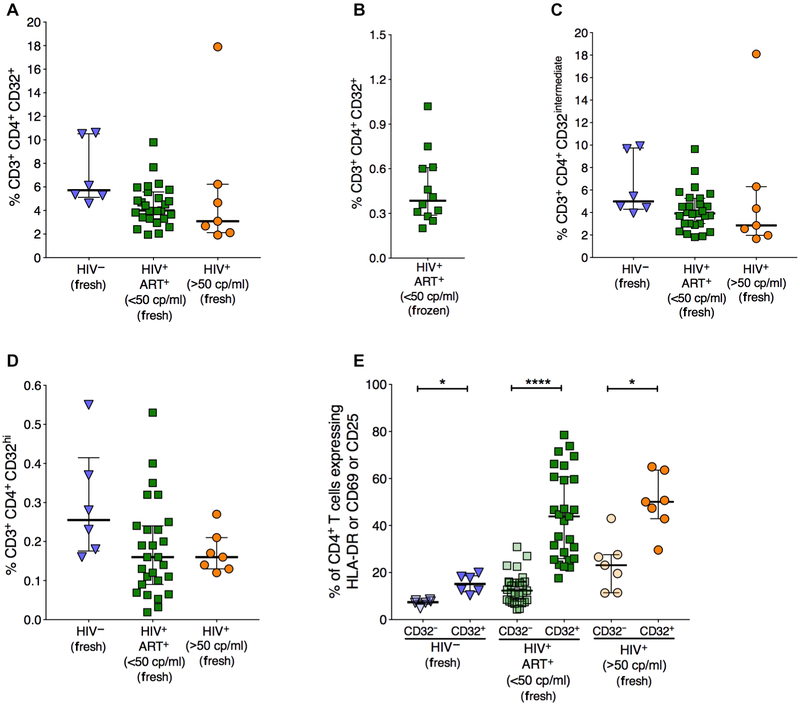
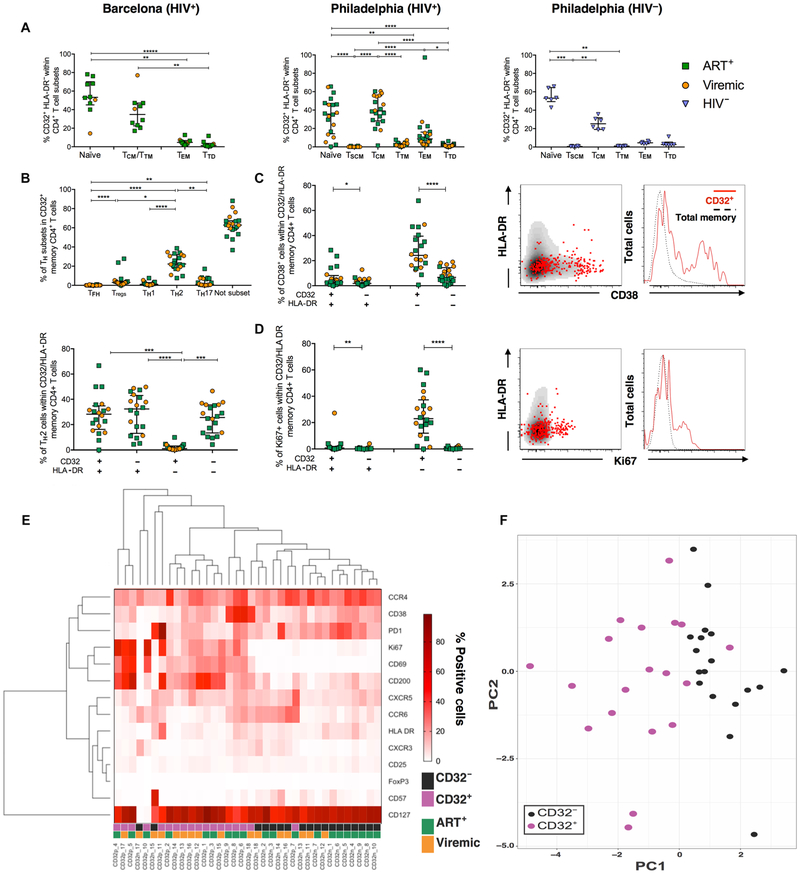
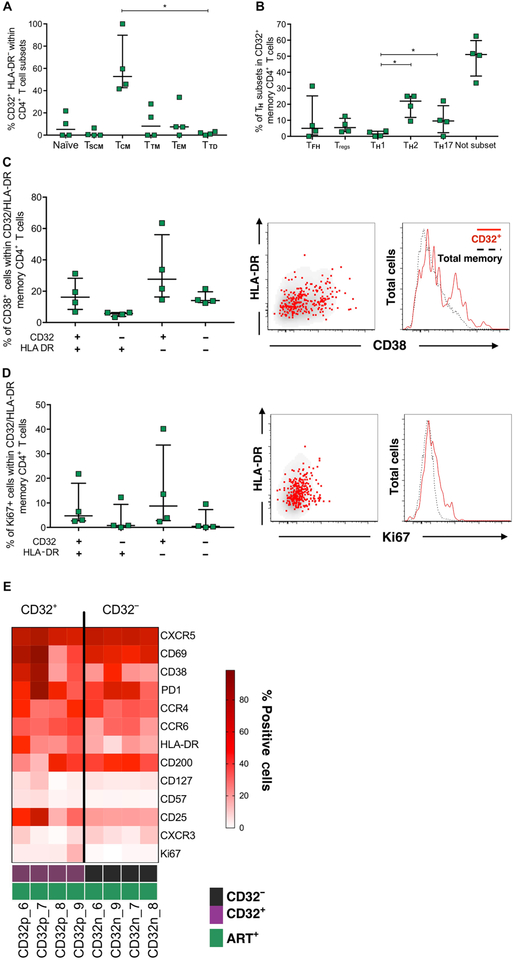
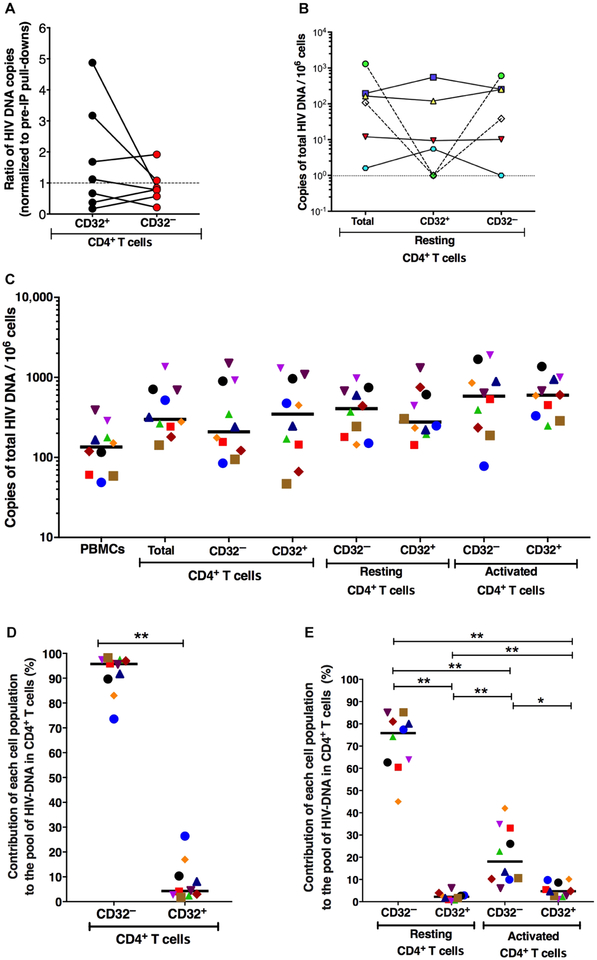
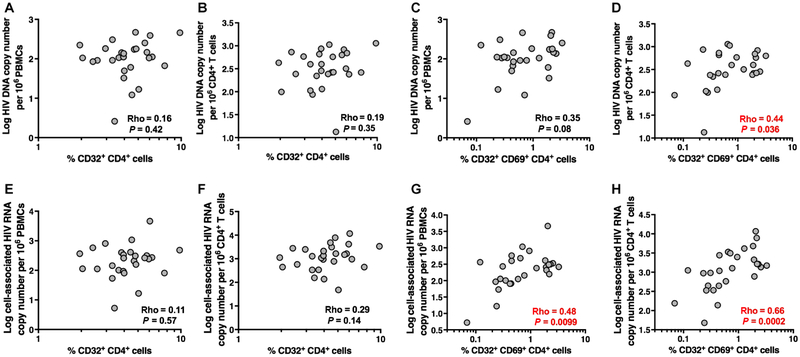
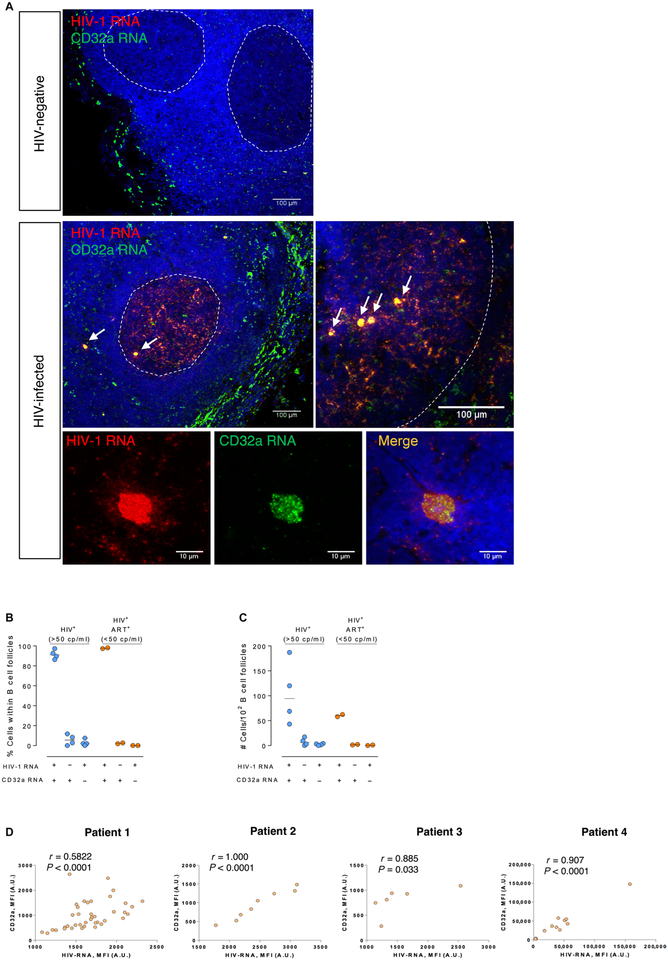
The persistence of HIV reservoirs, including latently infected, resting CD4+ T cells, is the major obstacle to cure HIV infection. CD32a expression was recently reported to mark CD4+ T cells harboring a replication-competent HIV reservoir during antiretroviral therapy (ART) suppression. We aimed to determine whether CD32 expression marks HIV latently or transcriptionally active infected CD4+ T cells. Using peripheral blood and lymphoid tissue of ART-treated HIV+ or SIV+ subjects, we found that most of the circulating memory CD32+ CD4+ T cells expressed markers of activation, including CD69, HLA-DR, CD25, CD38, and Ki67, and bore a TH2 phenotype as defined by CXCR3, CCR4, and CCR6. CD32 expression did not selectively enrich for HIV- or SIV-infected CD4+ T cells in peripheral blood or lymphoid tissue; isolated CD32+ resting CD4+ T cells accounted for less than 3% of the total HIV DNA in CD4+ T cells. Cell-associated HIV DNA and RNA loads in CD4+ T cells positively correlated with the frequency of CD32+ CD69+ CD4+ T cells but not with CD32 expression on resting CD4+ T cells. Using RNA fluorescence in situ hybridization, CD32 coexpression with HIV RNA or p24 was detected after in vitro HIV infection (peripheral blood mononuclear cell and tissue) and in vivo within lymph node tissue from HIV-infected individuals. Together, these results indicate that CD32 is not a marker of resting CD4+ T cells or of enriched HIV DNA-positive cells after ART; rather, CD32 is predominately expressed on a subset of activated CD4+ T cells enriched for transcriptionally active HIV after long-term ART.


Conflict of interest statement

Competing interests: D.H. is a Merck employee and stockholder; I.F. served on the advisory board for Gilead Sciences and ViiV Healthcare; D.R. has consulted for Gilead, Antiva, and Monogram; and J.K. is a consultant at Gilead Sciences. All other authors declare that they have no competing interests.

Figures

Fig. 1.
Fig. 1.. CD32+ CD4+ T cells are enriched with activated cells.
Freshly isolated peripheral blood mononuclear cells (PBMCs) from HIV-controls, HIV+ individuals with VL <50 copies (cp)/ml, and HIV+ individuals with VL >50 copies/ml were stained for CD32, CD69, HLA-DR, and CD25 on CD4+ T cells. (A) Percentage of total CD32+ within CD4+ T cells. (B) Percentage of total CD32+ CD4+ T cells in cryopreserved PBMCs from HIV+ individuals with VL <50 copies/ml. (C) Percentage of CD32intermediate within CD4+ T cells. (D) Percentage of total CD32hi within CD4+ T cells. (E) Percentage of cells expressing at least one of the activation markers human leukocyte antigen-DR (HLA-DR), CD69, and CD25 on CD32+ CD4+ T cells and CD32 CD4+ T cells. Lines and error bars represent median and IQR, respectively. All statistical comparisons were performed using two-tailed Wilcoxon rank tests. n = 6 for HIV controls, n = 27 for HIV+ ART+ (<50 copies/ml) individuals, and n = 7 for HIV+ (>50 copies/ml) individuals. *P < 0.05 and ****P < 0.0001.
Fig. 2.
Fig. 2.. CD32+ cells have a distinctively different phenotype compared to CD32 cells.
(A) Distribution of CD32+ HLA-DR-within cell subsets in viremic, ART-treated HIV+ and HIV donors. In the Barcelona cohort, subsets were defined as naïve (CD45RO CD27+), Ttd (CD45RO CD27), effector memory T cells (TEM) (CD45RO+ CD27), and central memory T cells (TCM)/transitional memory T cells (TTM) (CD45RO+ CD27+). In the Philadelphia cohort, subsets were defined as naïve (CD45RA+ CD27+ CCR7+ CD95), stem memory T cells (TSCM) (CD45RA+ CD27+ CCR7+ CD95+), TTD (CD45RA+ CD27), TEM (CD45RA CD27), TCM (CD45RA CD27+ CCR7+), and TTM (CD45RA CD27+ CCR7). (B) Frequencies of TH subsets within memory CD32+ CD4+ T cells (top) and their distribution within HLA-DR+/− TH2 CD32+ CD4+ T cells (bottom). Not subset refers to those cells that did not fall into the defined TH subsets. (C and D) Frequency of CD38+ (C) and Ki67+ (D) cells in CD32/HLA-DR-expressing memory CD4+ T cells. Representative examples are shown for each marker with overlaid plots showing CD32+ cells (red dots in plots and solid red lines in histograms) over total memory cells (black dots in plots and dotted lines in histograms). (E) Heat map showing the frequency of all measured phenotypic markers in CD32+ and CD32 cells. CD32p, memory CD32+ CD4+ T cells; CD32n, memory CD32 CD4+ T cells. (F) PCA showing the distribution of CD32+ and CD32 cell subsets. In all graphs, a line indicates the median of the group. All data were analyzed using a Friedman test (paired, nonparametric) and corrected for multiple comparisons with Dunnett’s posttest. n = 6 for HIV controls, n = 12 for HIV+ ART+ individuals, and n = 8 for HIV+ viremic individuals. *P < 0.05, **P < 0.01, ***P < 0.001, and ****P < 0.0001.
Fig. 3.
Fig. 3.. Frequency and distribution of CD32+ cells are similar between blood and tonsils of ART-treated HIV+ donors.
(A) Distribution of CD32+ HLA-DR-within cell subsets in tonsil samples from ART-treated HIV+ donors. (B) Frequencies of TH subsets within memory CD32+ CD4+ T cells. Not subset refers to those cells that did not fall into the defined Th subsets. (C and D) Frequency of CD38+ (C) and Ki67+ (D) cells in CD32/HLA DR-expressing memory CD4+ T cells. Representative examples are shown for each marker with overlaid plots showing CD32+ cells (red dots in plots and solid red lines in histograms) over total memory cells (black dots in plots and dotted lines in histograms). (E) Heat map showing the frequency of all measured phenotypic markers in CD32+ and CD32 cells. In all graphs, a line indicates the median of the group. All data were analyzed using a Friedman test (paired, nonparametric) and corrected for multiple comparisons with Dunnett’s posttest. *P < 0.05; n = 4.
Fig. 4.
Fig. 4.. CD32 expression associates with productive HIV infection in vitro in PBMCs and tissues.
Unfractionated and unstimulated PBMCs from three healthy donors were infected ex vivo with the HIV strain NL4–3. Cells were subjected to the RNA FISH-flow protocol on days 3, 4, 5, and 6 after infection to determine the expression of CD32 in the productively infected cell population (HIV-RNA+ p24+). (A) Left: A representative flow cytometry plot of dually stained T cells for HIV RNA and the p24 protein. Upper right panels show representative flow cytometry plots of CD32, HLA-DR, and PD-1 frequency and expression in uninfected cells. The plots in the middle and bottom right show the frequency and expression of CD32 in infected cells and the frequency of HLA-DR and PD-1 within infected CD32+ cells at days 3 and 6 after infection. (B) Percentages of productively HIV-infected cells (first graph) and percentages of infected cells expressing CD32 (second graph). MFI of p24 and CD32 expression productively infected (orange) and uninfected cells (blue) (third and fourth graphs). Correlation between the percentage of HIV-infected cells and CD32 expression (last graph). (C) Differential HLA-DR and PD-1 expression pattern of infected cells (green), cells coexpressing the CD32 marker (maroon), or uninfected cells (blue). Left graph shows the expression of the activation marker HLA-DR, and right graph shows the expression of PD-1. (D) Left graph: Percentages of CD32 expression in uninfected cells after exogenous stimulation with anti-CD3/CD28 microbeads. Middle graph: Percentages of HIV-infected cells after ex vivo infection of stimulated CD4+ T cells. Right graph: Percentages of CD32 expression after ex vivo infection of stimulated CD4+ T cells. (E) Cervical tissue ex vivo infection. Left graph: Representative flow cytometry plot of p24 protein detection in two of CD32 in HIV-infected cells and in uninfected CD4+ T cells. (F) Percentages of HLA-DR expression in infected cells expressing the CD32 marker (maroon), infected cells that do not express CD32 (green), and uninfected CD4+ T cells expressing CD32 (blue). Statistical comparisons were performed using paired t tests. n = 2.
Fig. 5.
Fig. 5.. No enrichment of HIV DNA in sorted CD32+ CD4+ T cells compared to CD32 CD4+ T cells and CD32+ resting CD4+ T cells contribute minimally to the total pool of HIV DNA in CD4+ T cells.
(A) Measurements of HIV DNA were performed on CD32 pull-downs with antibody-conjugated magnetic beads and compared to cell number normalized pre-immunoprecipitation (pre-IP) pull-downs (n = 7) on fresh cells. (B) HIV DNA load was measured from CD32+ resting CD4+ T cells and CD32 resting CD4+ T cells isolated using magnetic beads (n = 6). (C) FACS was performed to isolate total CD4+ T cells, CD32+ CD4+ T cells, CD32 CD4+ T cells, CD32 resting CD4+ T cells (HLA-DR CD69 CD25), CD32+ resting CD4+ T cells, CD32 activated CD4+ T cells (HLA-DR+ or CD69+ or CD25+), and CD32+ activated CD4+ T cells from freshly isolated PBMCs from HIV+ ART-suppressed individuals, and HIV DNA load was measured in all sorted populations (n = 10). Each patient is represented by a different symbol. Lines represent median. (D and E) Contribution of each cell population to the total pool of HIV DNA in CD4+ T cells calculated in 10 HIV+ ART-suppressed individuals. HIV total DNA copy number was determined in sorted subsets by qPCR. Each symbol represents a different individual. The contribution of each subset to the total pool of HIV DNA in CD4+ T cells was calculated by accounting for the frequency of these subsets within the CD4+ compartment and abundance of HIV DNA determined in each subset. Horizontal lines indicate median values. All statistical comparisons were performed using two-tailed Wilcoxon rank tests. *P < 0.05 and **P < 0.01.
Fig. 6.
Fig. 6.. Frequency of CD32+ on CD69+ cells correlates with HIV DNA and RNA loads during suppressive ART.
(A to D) Frequency of CD32+ CD4+ T cells and frequency of CD32+ on CD69+ CD4+ T cells were examined in relation to total HIV DNA load measured in unfractionated PBMCs and isolated CD4+ T cells. (E to H) Frequency of CD32+ CD4+ T cells and frequency of CD32+ on CD69+ CD4+ T cells were examined in relation to cell-associated HIV RNA load measured in unfractionated PBMCs and isolated CD4+ T cells. Correlations were evaluated using two-tailed Spearman’s rank correlation coefficient tests. n = 27 HIV+ ART+ individuals.
Fig. 7.
Fig. 7.. CD32 expression associates with HIV-RNA.
(A) Paraffin-embedded sections from HIV-infected patients and a healthy donor LN biopsy were stained for HIV-1 RNA (red), CD32a RNA (green), and nuclei (blue). Upper panel shows a representative section of an HIV donor, and a viremic HIV-infected patient is shown in lower panels. White arrows indicate cells coexpressing HIV and CD32a. Lower panels show high magnification of one cell coexpressing HIV and CD32a from a viremic HIV-infected patient. (B and C) Quantification of single HIV-1 RNA-, single CD32a RNA-, and double HIV-1 RNA- and CD32a RNA-positive cells in B cell follicles of LNs from four HIV-infected viremic patients, and two HIV-infected patients with undetectable viral load. Results are represented (B) as a percentage of the total HIV RNA-positive cells and/or CD32a RNA-positive cells within B cell follicles or (C) as the total number of cells per 102 inspected B cells follicles. (D) Spearman correlation between the MFI of CD32 RNA expression and the MFI of HIV-1 RNA expression. The same four viremic HIV-positive patients used in (B) and (C) are shown. n = 6. A.U., arbitrary units.

References

    1. Wong JK, Hezareh M, Günthard HF, Havlir DV, Ignacio CC, Spina CA,Richman DD, Recovery of replication-competent HIV despite prolonged suppression of plasma viremia. Science 278, 1291–1295 (1997). - PubMed
    1. Deeks SG, HIV infection, inflammation, immunosenescence, and aging. Annu. Rev. Med 62, 141–155 (2011). - PMC - PubMed
    1. Estes JD, Kityo C, Ssali F, Swainson L, Makamdop KN, Del Prete GQ, Deeks SG,Luciw PA, Chipman JG, Beilman GJ, Hoskuldsson T, Khoruts A, Anderson J,Deleage C, Jasurda J, Schmidt TE, Hafertepe M, Callisto SP, Pearson H, Reimann T, Schuster J, Schoephoerster J, Southern P, Perkey K, Shang L, Wietgrefe SW,Fletcher CV, Lifson JD, Douek DC, McCune JM, Haase AT, Schacker TW, Defining total-body AIDS-virus burden with implications for curative strategies. Nat. Med 23, 1271–1276 (2017). - PMC - PubMed
    1. Fukazawa Y, Lum R, Okoye AA, Park H, Matsuda K, Bae JY, Hagen SI, Shoemaker R,Deleage C, Lucero C, Morcock D, Swanson T, Legasse AW, Axthelm MK,Hesselgesser J, Geleziunas R, Hirsch VM, Edlefsen PT, Piatak M Jr., Estes JD, Lifson JD, Picker LJ, B cell follicle sanctuary permits persistent productive simian immunodeficiency virus infection in elite controllers. Nat. Med 21, 132–139 (2015). - PMC - PubMed
    1. McGary CS, Deleage C, Harper J, Micci L, Ribeiro SP, Paganini S, Kuri-Cervantes L,Benne C, Ryan ES, Balderas R, Jean S, Easley K, Marconi V, Silvestri G, Estes JD,Sekaly RP, Paiardini M, CTLA-4+PD-1− memory CD4+ T cells critically contribute to viral persistence in antiretroviral therapy-suppressed, SIV-infected rhesus macaques. Immunity 47, 776–788.e5 (2017). - PMC - PubMed

Publication types

MeSH terms