Clinical Trial
. 2018 Apr 19;3(8):e98259.
doi: 10.1172/jci.insight.98259.

Antigen-mediated regulation in monoclonal gammopathies and myeloma

Affiliations
Clinical Trial

Antigen-mediated regulation in monoclonal gammopathies and myeloma

Shiny Nair et al. JCI Insight. .

Abstract

A role for antigen-driven stimulation has been proposed in the pathogenesis of monoclonal gammopathy of undetermined significance (MGUS) and multiple myeloma (MM) based largely on the binding properties of monoclonal Ig. However, insights into antigen binding to clonal B cell receptors and in vivo responsiveness of the malignant clone to antigen-mediated stimulation are needed to understand the role of antigenic stimulation in tumor growth. Lysolipid-reactive clonal Ig were detected in Gaucher disease (GD) and some sporadic gammopathies. Here, we show that recombinant Ig (rIg) cloned from sort-purified single tumor cells from lipid-reactive sporadic and GD-associated gammopathy specifically bound lysolipids. Liposome sedimentation and binding assays confirmed specific interaction of lipid-reactive monoclonal Ig with lysolipids. The clonal nature of lysolipid-binding Ig was validated by protein sequencing. Gene expression profiling and cytogenetic analyses from 2 patient cohorts showed enrichment of nonhyperdiploid tumors in lipid-reactive patients. In vivo antigen-mediated stimulation led to an increase in clonal Ig and plasma cells (PCs) in GD gammopathy and also reactivated previously suppressed antigenically related nonclonal PCs. These data support a model wherein antigenic stimulation mediates an initial polyclonal phase, followed by evolution of monoclonal tumors enriched in nonhyperdiploid genomes, responsive to underlying antigen. Targeting underlying antigens may therefore prevent clinical MM.

Keywords: Antigen; Cancer; Oncology.


Conflict of interest statement

Conflict of interest: The authors have declared that no conflict of interest exists.

Figures

Figure 1
Figure 1. Reactivity and specificity of recombinant monoclonal Ig binding to GlcSph.
(A) Recombinant Ig (rIg) cloned from single-cell sorted tumors (CD38+CD138+) from lipid-reactive patients (n = 2) R1 and R2 showed GlcSph reactivity, while rIg cloned from lipid nonreactive patients (n = 2) N1 and N2 showed no reactivity in GlcSph-specific ELISA. (B) rIg cloned from single sorted plasma cells from lipid reactive Gaucher disease patient with monoclonal gammopathy (GD-MG; G1) show similar GlcSph reactivity as monoclonal Ig (mIg) purified from the patient’s sera. (C) Specificity of cloned rIg–derived F(ab)2 to bind GlcSph was assessed by competition ELISA with corresponding serum-purified mIg. GlcSph-coated well were incubated with increasing concentration of purified recombinant F(ab)2 from lipid reactive (R1) and non–lipid reactive (N1) patients. GlcSph binding of purified Ig (25 μg/ml) from sera of patient R1 was inhibited in the presence of corresponding F(ab)2 from R1 but not N1. (D) GlcSph reactivity of monoclonal Ig (25 μg/ml) purified from the GD-MG patient’s (G1) sera was competitively inhibited by increasing concentration of corresponding rIg-derived F(ab)2. Data represent mean ± SEM.
Figure 2
Figure 2. Binding of purified monoclonal Ig from lipid-reactive patients to GlcSph containing liposomes and C18 silica beads.
(A) In the liposome sedimentation assay, purified monoclonal Ig (mIgs) from lipid-reactive sporadic MM patient were incubated with either control or GlcSph containing liposomes and, after centrifugation, separated into liposome-bound fraction (B; 100%) and liposome unbound fraction (S; 7.5%) and visualized using mIg-specific anti–human heavy chain antibody in immunoblots. (B) Binding of mIgs from lipid-reactive GD patient to GlcSph containing liposomes as determined by liposome sedimentation assay. (C) Lipid binding specificity of mIg was assessed in a liposome-binding assay using flow cytometry. Representative FACS profile shows the dose-dependent binding of FITC-labeled affinity purified mIg to GlcSph containing liposomes. Data from 1 representative patient is shown. (D) Binding of the FITC-labeled mIg from sporadic MM patient to GlcSph-coated C18 silica beads was assessed by flow cytometry (left). Bound clonal Ig was eluted using 1 M glycine (pH 2.0_, the beads were checked after elution by FACS, while the eluted fraction was visualized by immunoblotting (right). (E) Clonal Ig from lipid-reactive GD patient also show binding to GlcSph-coated C18 silica beads. (F) Percent quenching of the relative fluorescence intensity of NBD-GlcSph in NBD-GlcSph/cholesterol liposomes induced by GlcSph binding of mIg from lipid-reactive patient. No fluorescence quenching of NBD-cholesterol control liposome is observed in the presence of mIg. Data represent mean ± SEM. Data is representative of 4 similar experiments.
Figure 3
Figure 3. Protein sequence analysis by mass spectrometry between purified clonal Ig and Ig eluted from GlcSph-containing liposomes.
(A) Protein sequences obtained after LC/MS from purified monoclonal Ig (mIg), liposome-bound protein, and protein eluted from sphingosine beads from 2 different lipid-reactive patients are shown. (B) Protein sequences obtained after LC/MS from purified clonal Ig, liposome-bound protein, and protein eluted from sphingosine beads from R2 match with the heavy and light chain CDR3 region of the cDNA translated sequence obtained from the rIg cloned from single plasma cells of the same patient. LC/MS protein sequencing was performed on 3 patients’ samples.
Figure 4
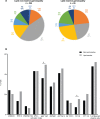
Figure 4. Genetic features of tumor cells in lipid-reactive gammopathy.
(A) Pie charts compare the percentages of different molecular classification (MC) subgroups between lipid-reactive and non–lipid-reactive patients. Data shown are cumulative data from cohort 1 (n = 76) and 2 (n = 274) (***P < 0.001,*P < 0.05, Fisher’s exact test). (B) Bar graph shows comparison of percentage of patients based on the detection of high-risk GEP signatures and cytogenetic abnormalities in tumor cells between non–lipid-reactive and lipid-reactive patients. Data are from patients in cohort 2 (n = 274) with available cytogenetics and GEP signatures (*P < 0.05, Fisher’s exact test). HY, hyperdiploid; LB, low bone; MF, Maf; MS, MMSET; PR, proliferation; CD, cyclin D.
Figure 5
Figure 5. Reactivity of clonal plasma cells and Ig to lipid antigen in vivo.
(A) Serum protein electrophoresis (SPEP) was performed on serum specimens obtained from tumor-engrafted MIS(KI)TRG6 mice injected with either PBS or GlcSph. Fractions shown are α-1 and -2 globulin, β globulin, and γ globulin. The arrow indicates the paraprotein (top panel). The bottom panel shows densitometry quantitation of paraprotein seen in PBS- vs. GlcSph-injected mice performed using ImageJ software (n = 5) (*P < 0.05,Welch’s t test). (B) Representative contour plots show the percentage of human CD38+CD138+ plasma cells and tumor light-chain profile among human cellular compartment (mCD45mTer119) in BM mononuclear cells obtained from tumor-engrafted (IgGκ) mice after 3 weeks of injections with PBS or GlcSph (the gating strategy shown in Supplemental Figure 7). The dot plot shows the fold increase in CD38+CD138+ plasma cells in BM of engrafted mice after injection of GlcSph over those injected with PBS (n = 3). (C)The dot plot shows the levels of human light-chain–restricted antibodies (μg/ml) in mouse sera, detected by ELISA. Data represent mean ± SEM (n = 3). (D) Heatmap for the expression of CD33, CD56, CD38, and CD138 on clonal κ and nonclonal λ plasma cells in GlcSph-injected tumor engrafted mice as in B, as analyzed by mass cytometry (CyTOF). Bars represent expression scales.
Figure 6
Figure 6. Proposed model to show lysolipid-mediated stimulation of clonal and nonclonal plasma cells.
Proposed model depicting progression of GD gammopathy from initial lysolipid-reactive polyclonal response and emergence of monoclonal PCs through suppression of antigenically related nonclonal PCs in vivo. Antigenic restimulation with lysolipids was able to overcome this suppression, leading to activation of both clonal and nonclonal plasma cells in vivo in a humanized mouse model.

References

    1. Dhodapkar MV. MGUS to myeloma: a mysterious gammopathy of underexplored significance. Blood. 2016;128(23):2599–2606. doi: 10.1182/blood-2016-09-692954. - DOI - PMC - PubMed
    1. Palumbo A, Anderson K. Multiple myeloma. N Engl J Med. 2011;364(11):1046–1060. doi: 10.1056/NEJMra1011442. - DOI - PubMed
    1. Walker BA, et al. Intraclonal heterogeneity is a critical early event in the development of myeloma and precedes the development of clinical symptoms. Leukemia. 2014;28(2):384–390. doi: 10.1038/leu.2013.199. - DOI - PMC - PubMed
    1. López-Corral L, et al. The progression from MGUS to smoldering myeloma and eventually to multiple myeloma involves a clonal expansion of genetically abnormal plasma cells. Clin Cancer Res. 2011;17(7):1692–1700. doi: 10.1158/1078-0432.CCR-10-1066. - DOI - PubMed
    1. Dhodapkar MV, et al. Clinical, genomic, and imaging predictors of myeloma progression from asymptomatic monoclonal gammopathies (SWOG S0120) Blood. 2014;123(1):78–85. doi: 10.1182/blood-2013-07-515239. - DOI - PMC - PubMed

Publication types

MeSH terms