. 2018 Apr 19;3(8):e98674.
doi: 10.1172/jci.insight.98674.

TSC2-deficient tumors have evidence of T cell exhaustion and respond to anti-PD-1/anti-CTLA-4 immunotherapy

Affiliations

TSC2-deficient tumors have evidence of T cell exhaustion and respond to anti-PD-1/anti-CTLA-4 immunotherapy

Heng-Jia Liu et al. JCI Insight. .

Abstract

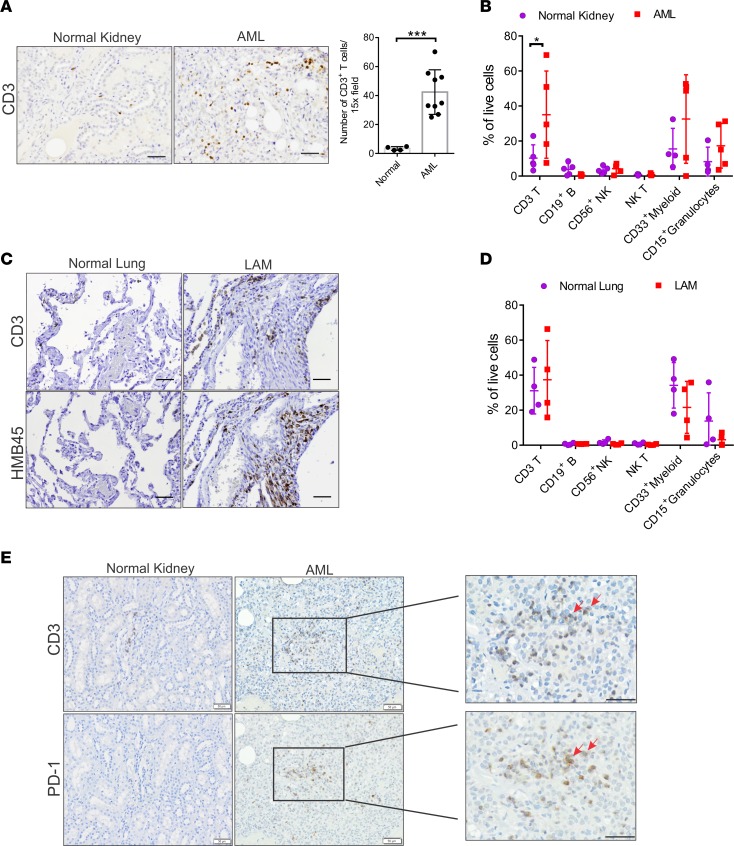
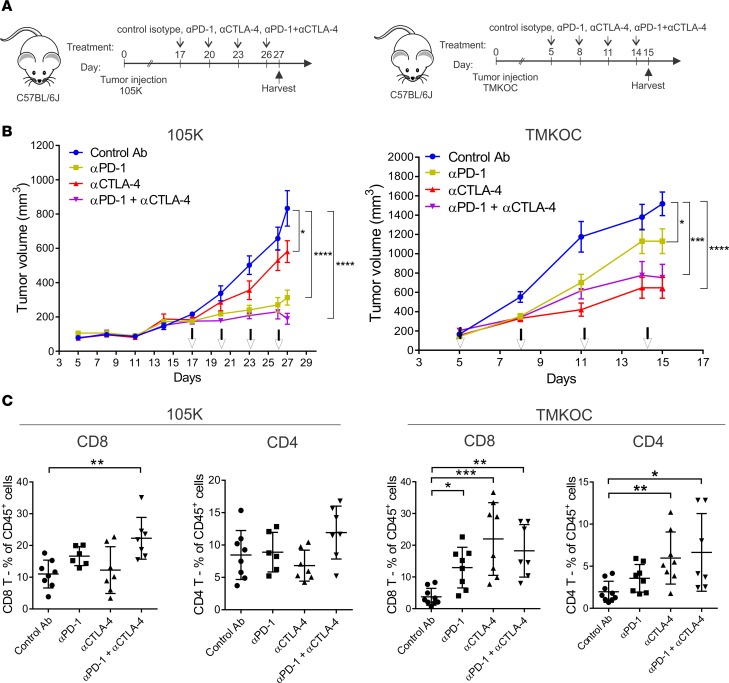
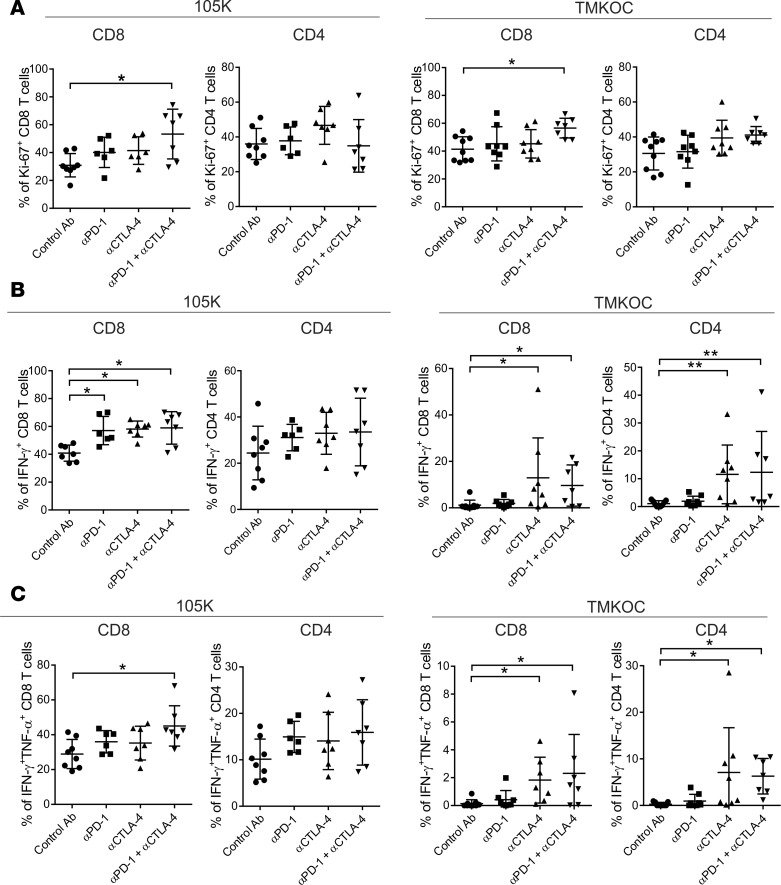
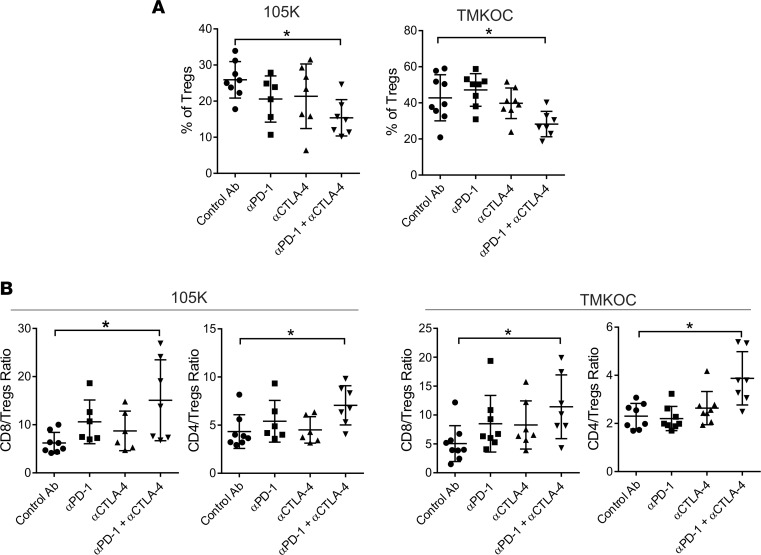
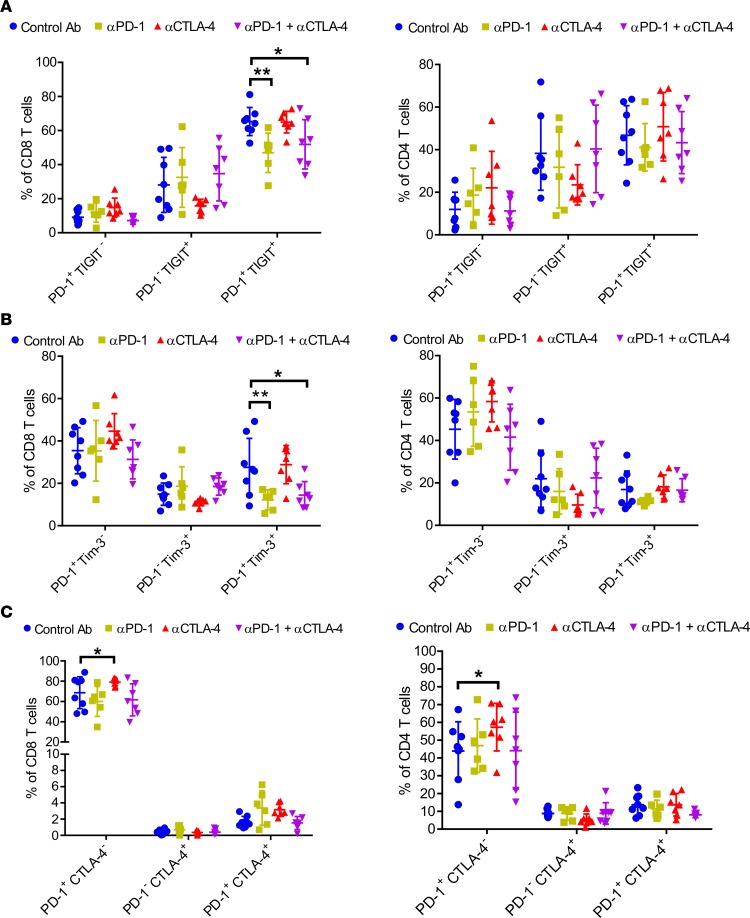
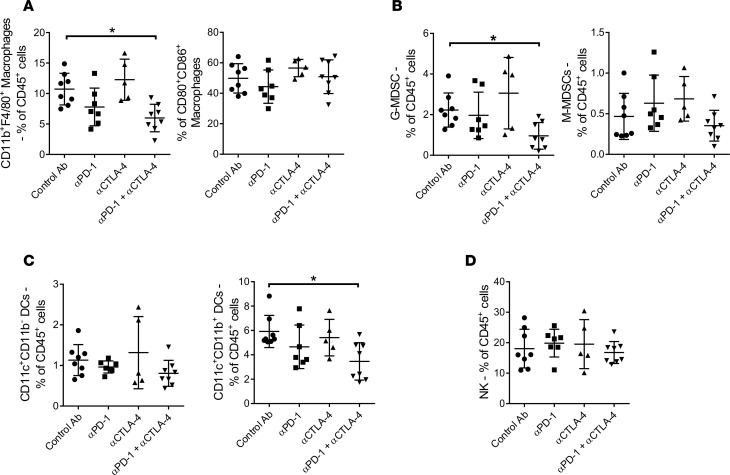
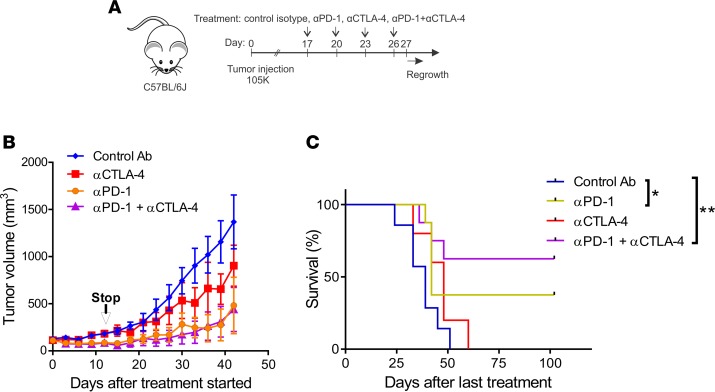
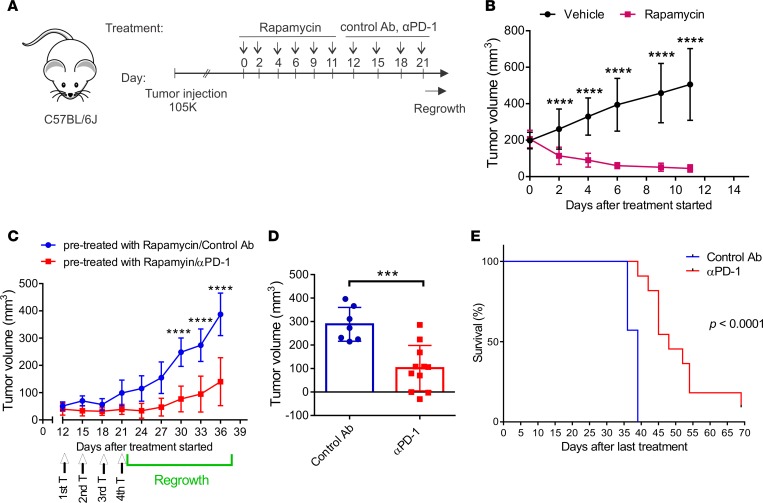
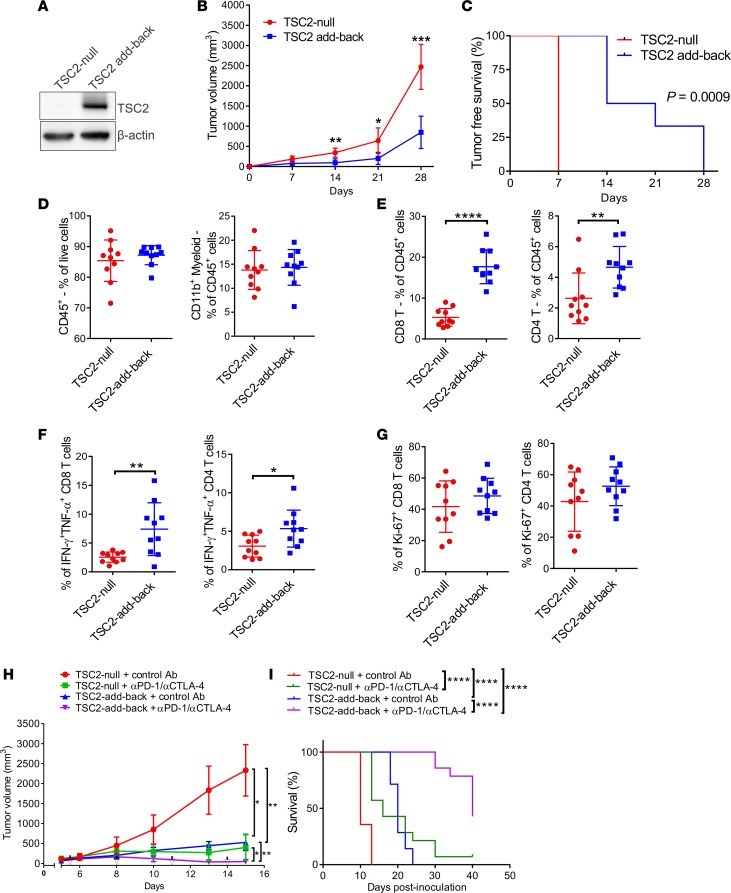
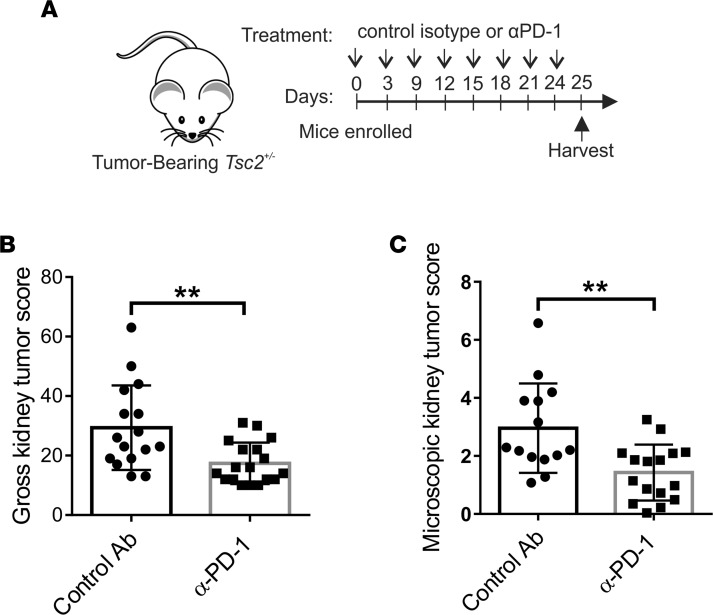
Tuberous sclerosis complex (TSC) is an incurable multisystem disease characterized by mTORC1-hyperactive tumors. TSC1/2 mutations also occur in other neoplastic disorders, including lymphangioleiomyomatosis (LAM) and bladder cancer. Whether TSC-associated tumors will respond to immunotherapy is unknown. We report here that the programmed death 1 coinhibitory receptor (PD-1) is upregulated on T cells in renal angiomyolipomas (AML) and pulmonary lymphangioleiomyomatosis (LAM). In C57BL/6J mice injected with syngeneic TSC2-deficient cells, anti-PD-1 alone decreased 105K tumor growth by 67% (P < 0.0001); the combination of PD-1 and CTLA-4 blockade was even more effective in suppressing tumor growth. Anti-PD-1 induced complete rejection of TSC2-deficient 105K tumors in 37% of mice (P < 0.05). Double blockade of PD-1 and CTLA-4 induced rejection in 62% of mice (P < 0.01). TSC2 reexpression in TSC2-deficient TMKOC cells enhanced antitumor immunity by increasing T cell infiltration and production of IFN-γ/TNF-α by T cells, suggesting that TSC2 and mTORC1 play specific roles in the induction of antitumor immunity. Finally, 1 month of anti-PD-1 blockade reduced renal tumor burden by 53% (P < 0.01) in genetically engineered Tsc2+/- mice. Taken together, these data demonstrate for the first time to our knowledge that checkpoint blockade may have clinical efficacy for TSC and LAM, and possibly other benign tumor syndromes, potentially yielding complete and durable clinical responses.

Keywords: Cancer immunotherapy; Immunotherapy; Oncology; T cells.


Conflict of interest statement

Conflict of interest: GJF has patents/pending royalties on the PD-1 pathway from Roche, Merck, Bristol-Myers-Squibb, EMD-Serono, Boehringer-Ingelheim, AstraZeneca, Dako, and Novartis.

Figures

Figure 1
Figure 1. Increased T cell infiltration and PD-1+ T cells in angiomyolipomas (AML) and lymphangioleiomyomatosis (LAM).
(A) Left, representative CD3 IHC in AML (n = 9) and normal kidney (n = 4). Scale bar: 50 μm. Right, quantification of CD3+ T cells in AML vs. normal kidney. Statistical significance was determined by Mann-Whitney’s U test. ***P < 0.001. (B) Multiparametric flow cytometry data of AML (n = 5) and normal kidney (n = 4) indicating the frequency (%) of CD3 T cells, CD19+ B cells, CD56+ NK cells, NKT cells, CD33+ myeloid cells, and CD15+ granulocytes. Data are presented as mean ± SD. Statistical significance determined by multiple 2-tailed t test followed by Holm-Sidak post-test for multiple comparisons. *P < 0.05. (C) Representative CD3 and HMB45 IHC in LAM (n = 10) and normal lung (n = 3). Scale bar: 50 μm. (D) Multicolor flow cytometry data for LAM (n = 4) and normal lung (n = 4) indicating the frequency (%) of CD3 T cells, CD19+ B cells, CD56+ NK cells, NKT cells, CD33+ myeloid cells, and CD15+ granulocytes. Data for bar graphs were calculated using multiple 2-tailed t test followed by Holm-Sidak post-test for multiple comparisons. (E) Representative IHC for CD3 and PD-1 in serial sections of AML (n = 10) and normal kidney (n = 4). Red arrows indicate PD-1+ T cells. Scale bar: 50 μm and 25 μm (inset).
Figure 2
Figure 2. PD-1 and CTLA-4 combination blockade suppresses TSC2-deficient tumor growth and increases the frequency of infiltrating CD8+ T cells.
(A) Experimental design for s.c. TSC2-deficient 105K tumors (left) and TSC2-deficient TMKOC tumors (right) treated with isotype control, αPD-1, αCTLA-4, or combined αPD-1 plus αCTLA-4 every 3 days for 4 treatments. (B) Growth of 105K tumors (left) and TMKOC tumors (right) treated as indicated (n = 8 per group). Data are presented as mean ± SD. Statistical significance was determined by nonparametric 1-way ANOVA followed by Holm-Sidak post-test between tumor sizes at day 27 for 105K tumors and day 15 for TMKOC tumors. (C) Flow cytometry quantification of tumor-infiltrating CD4+ and CD8+ T cells in TSC2-deficient 105K tumors (left) and TSC2-deficient TMKOC tumors (right) obtained 24 hours following the last treatment (n = 6–8 per group). Data are presented as mean ± SD. Statistical significance was determined by nonparametric 1-way ANOVA followed by Dunn’s multiple comparison test. *P < 0.05; **P < 0.01; ***P < 0.001; ****P < 0.0001.
Figure 3
Figure 3. PD-1 and CTLA-4 combination blockade increases proliferating and IFN-γ/TNF-α double-producing CD8+ T cells in TSC2-deficient tumors.
Tumor-infiltrating lymphocytes (TILs) were purified from s.c. 105K or TMKOC tumors using Ficoll gradient 24 hours following the last treatment, as illustrated in Figure 2A. TILs were stimulated with cell stimulation cocktail containing PMA and ionomycin in the presence of GolgiPlug for 4 hours. CD8+ and CD4+ T cells were analyzed by flow cytometry for lymphocyte markers and Ki-67 expression (A), intracellular IFN-γ production (B), and intracellular IFN-γ and TNF-α production (C) (n = 6–8 per group). Data are presented as mean ± SD. Statistical significance was determined by nonparametric 1-way ANOVA followed by Dunn’s multiple comparison test. *P < 0.05; **P < 0.01.
Figure 4
Figure 4. PD-1 and CTLA-4 combination blockade decreases the percentage of Foxp3+CD4+ Tregs and increases the CD8/Treg and CD4/Treg ratio in TSC2-deficient tumors.
(A) Flow cytometry quantification of tumor-infiltrating Foxp3+CD4+ Tregs in TSC2-deficient 105K tumors (left) and TSC2-deficient TMKOC tumors (right) obtained 24 hours following the last treatment, as illustrated in Figure 2A. (B) Ratios of CD8+ T cells to Tregs and CD4+ T cells to Tregs within 105K tumors (left) and TSC2-deficient TMKOC tumors (right) are shown (n = 6–8 per group). Data are presented as mean ± SD. Statistical significance was determined by nonparametric 1-way ANOVA followed by Dunn’s multiple comparison test. *P < 0.05.
Figure 5
Figure 5. PD-1 blockade alone or in combination with CTLA-4 suppresses PD-1+TIGIT+ and PD-1+Tim-3+ CD8+ T cells in 105K tumors.
Flow cytometry quantification of the tumor-infiltrating PD-1+ and/or TIGIT+ CD8+ or CD4+ T cells (A), PD-1+ and/or Tim-3+ CD8+ or CD4+ T cells (B), and PD-1+ and/or CTLA-4+ CD8+ or CD4+ T cells (C) in TSC2-deficient 105K tumors 24 hours following the last treatment, as illustrated in Figure 2A (n = 6–8 per group). Data are presented as mean ± SD. Statistical significance was determined by 2-way ANOVA followed by Holm-Sidak post-test for multiple comparison. *P < 0.05; **P < 0.01.
Figure 6
Figure 6. PD-1 and CTLA-4 combination blockade decreases CD11b+F4/80+ macrophages, CD11b+Ly6CmedLy6G+ G-MDSCs, and regulatory CD11b+ DCs in TSC2-deficient tumors.
Mice carrying TSC2-deficient 105K tumors were treated as illustrated in Figure 2A. Tumor-infiltrating lymphocytes (TILs) were isolated and stained for myeloid lineage and activation markers. Percentage of CD11b+F4/80+ macrophages and CD80+CD86+ macrophages (A), CD11b+Ly6CmedLy6G+ G-MDSCs and CD11b+Ly6C+Ly6G M-MDSCs (B), CD11c+CD11b DCs and CD11c+CD11b+ DCs (C), and NK cells (D) within CD45+ cells isolated from TSC2-deficient 105K tumors are shown (n = 6–8 per group). Data are presented as mean ± SD. Statistical significance was determined by nonparametric 1-way ANOVA followed by Dunn’s multiple comparison test. *P < 0.05.
Figure 7
Figure 7. PD-1 blockade alone or in combination with CTLA-4 blockade increases complete tumor rejection at 100 days.
(A) Experimental design. Mice were followed up to 100 days. (B) Tumor growth analyses following the first treatment. (C) Tumor-free survival analysis of mice bearing TSC2-deficient 105K tumors treated as indicated (n = 6–8 per group). Statistical significance was determined by Log-rank test. *P < 0.05; **P < 0.01. (D) Percentage of mice bearing s.c. 105K tumors treated with the indicated monoclonal antibody blockade therapy that completely rejected their tumors.
Figure 8
Figure 8. Sequential treatment of rapamycin followed by PD-1 blockade slows tumor regrowth.
(A) Schematic representation of treatment schedule. Mice carrying s.c. TSC2-deficient 105K tumors were treated with rapamycin (3 mg/kg) or vehicle every 2 days for 6 treatments in total. Twenty-four hours following the last rapamycin treatment, rapamycin-treated mice received isotype control or αPD-1 every 3 days for 4 treatments in total and were followed up to 36 days. (B) Tumor growth analysis of 105K tumor-bearing mice receiving vehicle (n = 8) or rapamycin treatment (n = 14). Data are presented as mean ± SD. Statistical significance was determined by Mann-Whitney U test, ****P < 0.0001. (C) Tumor growth analysis of 105K tumor–bearing mice pretreated with rapamycin and then receiving isotype control (n = 7) or αPD-1 antibody (n = 11). (D) The average tumor volume difference of the isotype control or αPD-1 antibody–treated group after the last antibody treatment (day 22) and the final measurement (day 36) is shown. Data are presented as mean ± SD. Statistical significance was determined by Mann-Whitney U test. (E) Tumor-free survival analysis of mice bearing TSC2-deficient 105K tumors treated as indicated (n = 7–11 per group). Statistical significance was determined by Log-rank test. ***P < 0.001; ****P < 0.0001.
Figure 9
Figure 9. Reexpression of TSC2 in TSC2-deficient tumors enhances T cell–mediated antitumor immunity and promotes dual PD-1 and CTLA-4 blockade.
(A) Whole cell lysates from TSC2-null TMKOC cells and TSC2 add-back TMKOC cells were analyzed by immunoblotting with antibodies against TSC2 and β-actin. (B) Tumor growth curve of mice bearing TSC2-null TMKOC tumors or TSC2 add-back TMKOC tumors (n = 6 per group). Data are presented as mean ± SD. Statistical significance was determined by Mann-Whitney U test. (C) Tumor-free survival analysis of mice bearing TSC2-null TMKOC or TSC2 add-back TMKOC tumors. (D–F) Tumors from mice injected with TSC2-null TMKOC or TSC2 add-back TMKOC cells were harvested and analyzed for CD45+ hematopoietic lineage cells with lymphocytes and myeloid markers by flow cytometry: (D) CD45+ cells and CD11b+ myeloid cells, (E) CD8+ and CD4+ T cells, and (F) CD8+ and CD4+ T cell intracellular IFN-γ and TNF-α production. (G) Ki-67 expression in CD8+ and CD4+ T cells. Data are presented as mean ± SD. Statistical significance was determined by Mann-Whitney U test. (H) Tumor growth curve of mice bearing TSC2-null TMKOC tumors or TSC2 add-back TMKOC tumors treated with isotype control or combined anti–PD-1 and anti–CTLA-4 antibodies (n = 10 per group). Data are presented as mean ± SD. Statistical significance was determined by nonparametric 1-way ANOVA followed by Dunn’s multiple comparison test. (I) Overall survival analysis of mice bearing TSC2-null TMKOC or TSC2 add-back TMKOC tumors treated as described in H (n = 14 per group). Statistical significance was determined by Log-rank test. *P < 0.05; **P < 0.01; ***P < 0.001; ****P < 0.0001. (J) Percentage of mice bearing s.c. TSC2-null or TSC2 add-back TMKOC tumors treated as described in H that completely rejected their tumors.
Figure 10
Figure 10. PD-1 blockade suppresses kidney tumor burden in Tsc2+/– mice.
(A) Experimental design. (B) Gross kidney tumor score was determined for each kidney using an established method based on number and size. Data are presented as mean ± SD. Statistical significance was determined by Mann-Whitney U test. (C) Microscopic kidney tumor score was assessed for each kidney by an established method of determining tumor size and filling from H&E sections (n = 14–16 per group). Data are presented as mean ± SD. Statistical significance was determined by Mann-Whitney U test. **P < 0.01

References

    1. Henske EP, Jóźwiak S, Kingswood JC, Sampson JR, Thiele EA. Tuberous sclerosis complex. Nat Rev Dis Primers. 2016;2:16035. - PubMed
    1. Crino PB, Nathanson KL, Henske EP. The tuberous sclerosis complex. N Engl J Med. 2006;355(13):1345–1356. doi: 10.1056/NEJMra055323. - DOI - PubMed
    1. Bissler JJ, Kingswood JC. Renal angiomyolipomata. Kidney Int. 2004;66(3):924–934. doi: 10.1111/j.1523-1755.2004.00838.x. - DOI - PubMed
    1. Byard RW, Blumbergs PC, James RA. Mechanisms of unexpected death in tuberous sclerosis. J Forensic Sci. 2003;48(1):172–176. - PubMed
    1. Cudzilo CJ, et al. Lymphangioleiomyomatosis screening in women with tuberous sclerosis. Chest. 2013;144(2):578–585. doi: 10.1378/chest.12-2813. - DOI - PubMed

Publication types

MeSH terms

Substances