An official website of the United States government
The .gov means it’s official.
Federal government websites often end in .gov or .mil. Before
sharing sensitive information, make sure you’re on a federal
government site.
The site is secure.
The https:// ensures that you are connecting to the
official website and that any information you provide is encrypted
and transmitted securely.
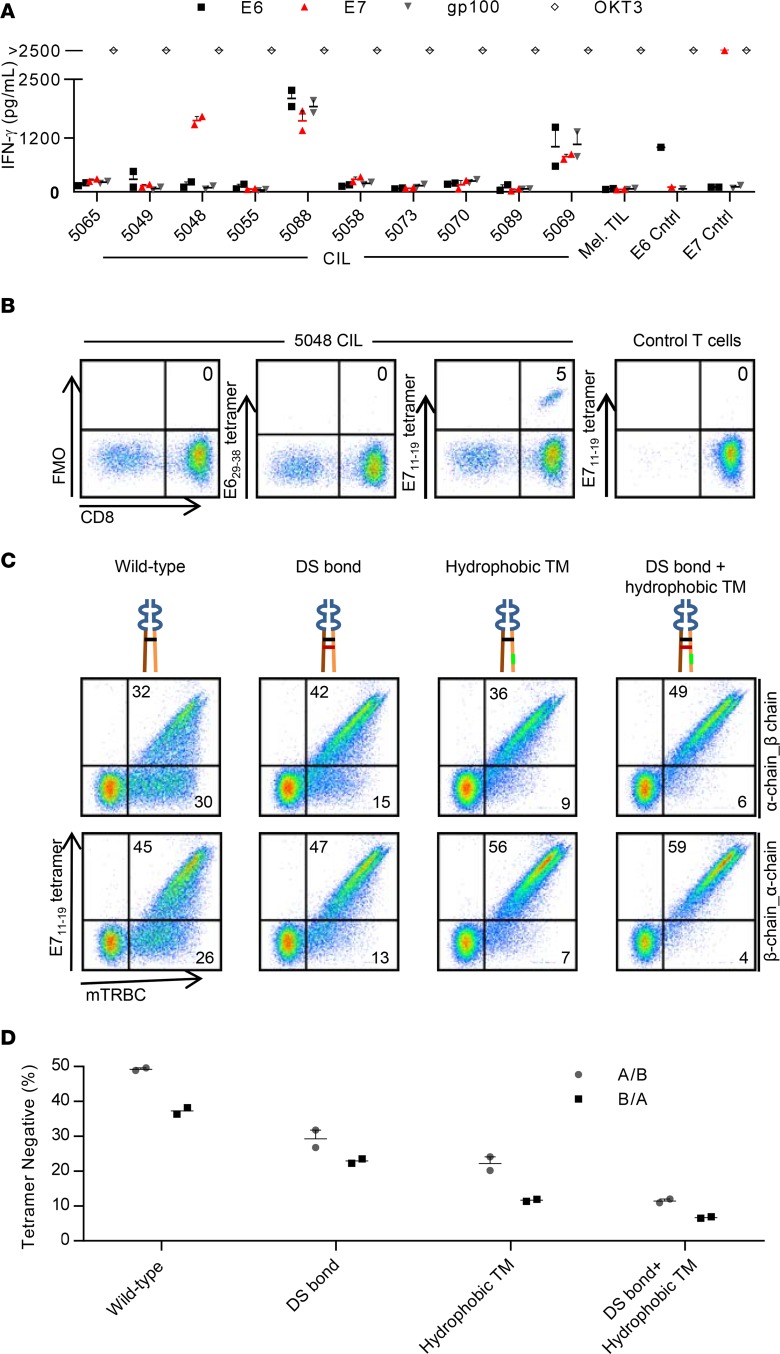
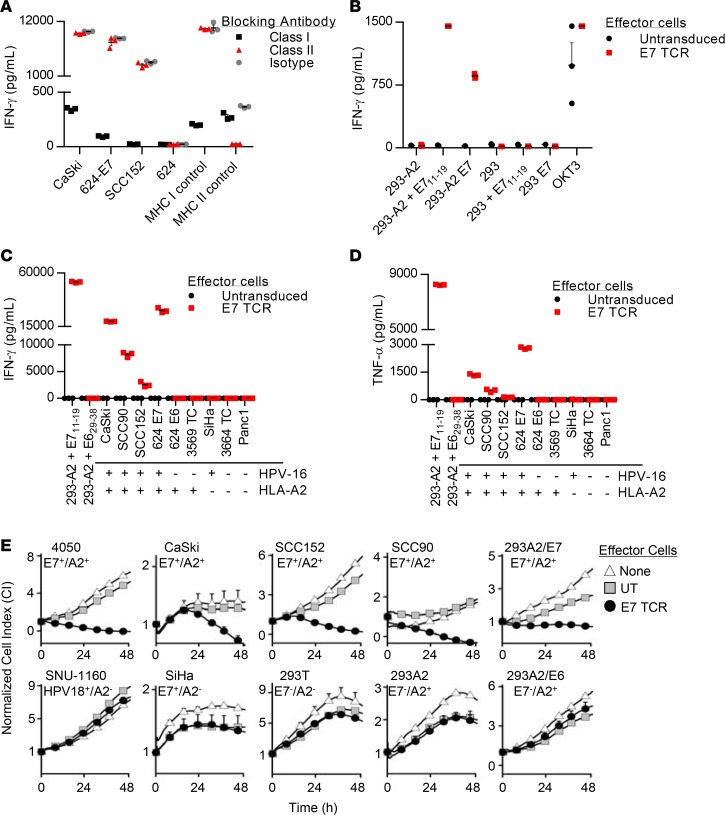
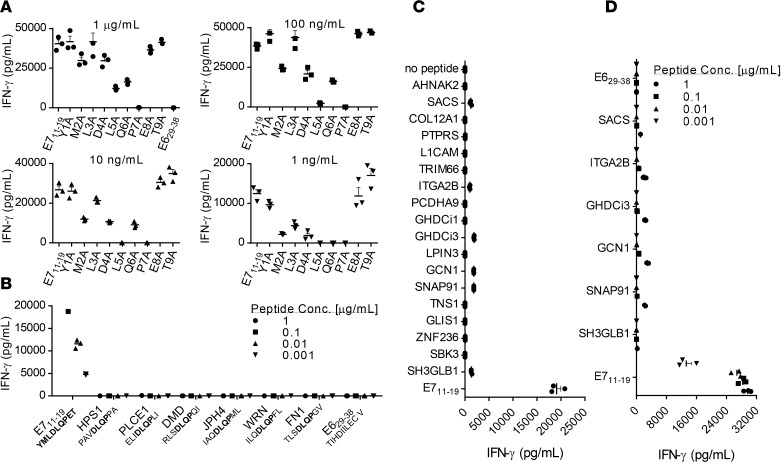
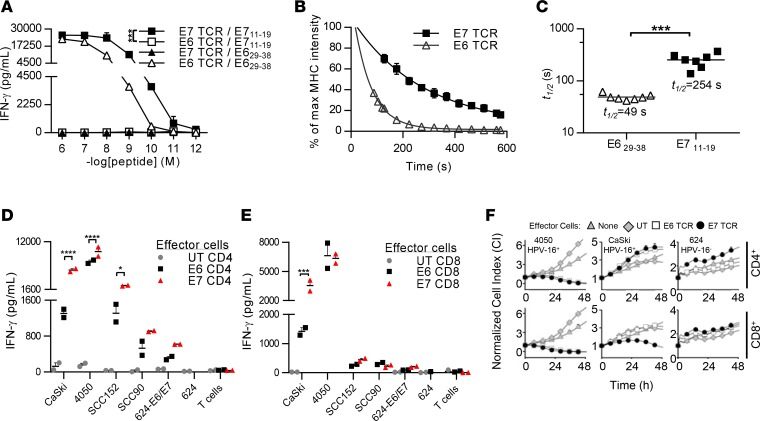
T cell receptor (TCR) T cell therapy is a promising cancer treatment modality. However, its successful development for epithelial cancers may depend on the identification of high-avidity TCRs directed against tumor-restricted target antigens. The human papillomavirus (HPV) E7 antigen is an attractive therapeutic target that is constitutively expressed by HPV+ cancers but not by healthy tissues. It is unknown if genetically engineered TCR T cells that target E7 can mediate regression of HPV+ cancers. We identified an HPV-16 E7-specific, HLA-A*02:01-restricted TCR from a uterine cervix biopsy from a woman with cervical intraepithelial neoplasia. This TCR demonstrated high functional avidity, with CD8 coreceptor-independent tumor targeting. Human T cells transduced to express the TCR specifically recognized and killed HPV-16+ cervical and oropharyngeal cancer cell lines and mediated regression of established HPV-16+ human cervical cancer tumors in a mouse model. These findings support the therapeutic potential of this approach and established the basis for an E7 TCR gene therapy clinical trial in patients with metastatic HPV+ cancers (NCT02858310).
Keywords:
Immunology; Immunotherapy; T cells; T-cell receptor.
Conflict of interest: CSH and SAR are inventors on NIH patents related to the E6 TCR, the E7 TCR, and TIL therapy for HPV-associated cancers (patent application no. 62/004,335, 61/846,167, 61/846,161). Both of their NIH laboratories receive research funding through cooperative research and development agreements with Kite Pharma.
Figures
Figure 1. Identification and optimized expression of…
Figure 1. Identification and optimized expression of a TCR that targets HPV-16 E7.
( A …
Figure 1. Identification and optimized expression of a TCR that targets HPV-16 E7.
(A) IFN-γ production assay testing CILs from 10 patients for recognition of HPV-16 E6 or E7. CILs from each patient were cocultured with autologous dendritic cells loaded with peptide pools spanning the indicated antigen. gp100, also known as melanocyte protein PMEL, is the negative control protein. OKT3 is a positive control of T cells stimulated with plate-bound anti-CD3 antibody. Mel TILs are a negative control of TILs from a melanoma patient. E6 Cntrl and E7 Cntrl are positive controls of T cells genetically engineered to express an E6- or E7-targeting TCR, respectively. The concentration of IFN-γ in supernatants after overnight coculture is displayed. (B) Flow cytometry analysis of 5048 CILs binding to E711–19-HLA-A*02:01 tetramers. E629–38 tetramer is a negative control tetramer. Control T cells are activated, third-party T cells. Dot plots are gated on live lymphocytes. The tetramers were PE labeled. The anti-CD8 antibody was PE-Cy7 labeled. FMO, fluorescence minus one. (C) Flow cytometry analysis of T cells transduced to express the E7 TCR. The schematic for each construct is shown above each dot plot. Orange and brown indicate α and β chain constant regions, respectively. The wild-type interchain disulfide bond is black. The introduced disulfide bond is red. Hydrophobic substitutions to the α chain transmembrane region are green. Variable regions are blue. The α and β chain gene order in the vector insert is indicated to the right of each row. Dot plots are gated on live lymphocytes. Quadrant frequencies are indicated. DS, disulfide; TM, transmembrane; mTRBC, mouse TCR β constant region. The tetramer is APC labeled. The anti-mTRBC antibody is PE labeled. (D) Data from the experiment in C are graphed to display the frequency of transduced T cells (mouse TCR β chain–positive) that did not bind E711–19-HLA-A*02:01 tetramers. Error bars represent the SEM for technical replicates. For C and D, the results are representative of 2 independent experiments.
Figure 2. Characterization of the in vitro…
Figure 2. Characterization of the in vitro function of E7 TCR T cells.
( A …
Figure 2. Characterization of the in vitro function of E7 TCR T cells.
(A) MHC blocking assay in which the effector cells are E7 TCR T cells and the target cells are as indicated on the x axis. Blocking antibodies against MHC class I or II were added. In the class I control, DMF5 TCR T cells (57) were cocultured with 624 melanoma cells. In the class II control, MAGE A3 TCR T cells (58) were cocultured with 526-CIITA cells. (B) Coculture assay to test for confirmation of the target antigen and restriction element for the E7 TCR. Target cells are 293 cells with or without stable expression of HLA-A*02:01 (293 or 293-A2). They were pulsed with E711–19 peptide (E711–19) or transfected with a plasmid encoding full-length E7 (E7) as indicated on the x axis. OKT3 is a positive control with T cell stimulation by plate-bound anti-CD3 antibody. (C and D) Tumor cell line recognition assays showing the concentration of (C) IFN-γ and (D) TNF-α in supernatants following overnight coculture. 293-A2 cells were pulsed with E711–19 or E629–38 peptide as indicated by x axis labels. The other cell lines did not have peptide added. The HPV-16 and HLA-A*02:01 expression of the target cell lines is indicated below each x axis label. (E) E7 TCR T cell–mediated cytolysis of tumor cell lines, as determined by an ACEA xCELLigence Real Time Cell Analyzer. The target cell line name and the expression of HPV-16 E7 and HLA-A*02:01 are indicated above each graph. The effector-to-target (E/T) ratio is 1:5. The values plotted are the means of 2 technical replicates, and error bars represent the SEM. The data displayed are representative of 2 independent experiments. UT, untransduced T cells; E7 TCR, E7 TCR–transduced T cells.
Figure 3. Testing of E7 TCR T…
Figure 3. Testing of E7 TCR T cells for cross-reactivity against human peptides.
The assays…
Figure 3. Testing of E7 TCR T cells for cross-reactivity against human peptides.
The assays shown were performed by coculture of E7 TCR T cells with T2 cells pulsed with the peptide indicated on the x axis. Coculture supernatants were harvested after 18–24 hours, and the IFN-γ concentration was measured by ELISA. Error bars represent the SEM of 3 technical replicates. (A) To guide cross-reactivity testing, alanine scanning of the E711–19 epitope was performed. An alanine residue was substituted for the native residue at each position of the E711–19 (YMLDLQPET) peptide. The residue substitutions are shown on the x axis. The peptide concentration is indicated above each bar graph. (B) Based on the findings in A, the amino acids at positions 4–7 (DLQP) were determined to primarily mediate E7 TCR recognition of E711–19. Position 2 also affected recognition, presumably due to its role as an HLA-A*02:01 anchor. A BLAST search was conducted to identify human peptides that share these 4 amino acids at the same positions and an HLA-A*02:01 anchor residue at positions 2 (L, M, T, or A) and 9 (V, I, L, T, or A) (48). E7 TCR T cells were tested for reactivity against T2 cells loaded with each of these peptides at the concentration indicated. (C) E7 TCR T cells were tested for recognition of a panel of human peptides that share either 6 residues or 5 residues plus a conservative substitution with E711–19. Target cells were loaded with 1 μg/ml peptide. (D) E7 TCR T cells were retested for reactivity against peptides identified as possibly reactive in C. The peptide concentrations are indicated.
Figure 4. The avidity of E7 TCR…
Figure 4. The avidity of E7 TCR T cells for cognate antigen and tumor cell…
Figure 4. The avidity of E7 TCR T cells for cognate antigen and tumor cell lines.
(A) A functional avidity assay is shown with the quantity of IFN-γ produced in an overnight coculture graphed. The target cells are T2 cells pulsed with E629–38 or E711–19 peptide at the concentrations indicated on the x axis. The TCR/target antigen combinations are shown in the key. Error bars represent the SEM of 3 technical replicates. ***P < 0.001. (B) Koff rate assay evaluating the E6 and E7 TCRs. E7 TCR– or E6 TCR–transduced T cells were labeled with reversible, fluorescence-labeled MHC streptamers. The MHC fluorescence intensity of the transduced T cells after the addition of biotin was monitored by flow cytometry. Mean MHC fluorescence intensities of E6 TCR (triangles) and E7 TCR (squares) were extracted for every 8 seconds, normalized, and plotted to calculate the t1/2 time after fitting an exponential decay curve (7 independent dissociations per TCR, mean with SEM). (C) t1/2 time from 7 independent peptide-MHC dissociation experiments of the E6 TCR (triangles) and the E7 TCR (squares) are plotted with the median t1/2 time. ***P < 0.001. (D and E) Cytokine production assay testing the recognition of tumor cell lines by E6 and E7 TCR T cells. (D) CD4 and (E) CD8 T cells were isolated, transduced, and tested separately in functional assays. The quantity of IFN-γ produced in an overnight coculture of TCR-transduced T cells and target cells is shown. The target cells are CaSki, 4050, SCC152, SCC90, 624-E6/E7, and 624 cells. Error bars represent the SEM of 2 technical replicates. *P < 0.05, ***P < 0.001, ****P < 0.0001. The result shown is representative of 2 independent experiments. (F) CD4 or CD8 T cells were transduced to express the E6 or E7 TCR and were cocultured with 4050, CaSki, or 624 tumor cell lines. T cell–mediated cytolysis was monitored using the ACEA xCELLigence Real-Time Cell Analyzer. Cell indices plotted in the graphs represent the mean of duplicate samples, and error bars represent the SEM. The result shown is representative of 2 independent experiments. UT, untransduced T cells; E7 TCR, E7 TCR–transduced T cells; E6 TCR, E6 TCR–transduced T cells.
Figure 5. Antitumor activity of E7 TCR…
Figure 5. Antitumor activity of E7 TCR T cells against cervical cancer in an in…
Figure 5. Antitumor activity of E7 TCR T cells against cervical cancer in an in vivo model.
NSG mice with 12-day subcutaneous tumors were treated with a single intravenous injection of E7 TCR T cells. The number of T cells is indicated in the key. (A and B) 4050 or (C and D) CaSki human cervical cancer tumors were treated. In B and D, 198,000 IU systemic IL-2 was given daily by intraperitoneal injection for 3 days. The tumor area (product of the longest perpendicular diameters) is plotted on the y axis. Time after T cell injection is plotted on the x axis. The mean values from each group are plotted. Error bars represent the SEM (n = 5 mice per group). The results are representative of 2 independent experiments. UT, untransduced T cells; E7 TCR, E7 TCR–transduced T cells.
zur Hausen H. Papillomaviruses and cancer: from basic studies to clinical application. Nat Rev Cancer. 2002;2(5):342–350. doi: 10.1038/nrc798.
-
DOI
-
PubMed
Maxwell JH, Grandis JR, Ferris RL. HPV-associated head and neck cancer: unique features of epidemiology and clinical management. Annu Rev Med. 2016;67:91–101. doi: 10.1146/annurev-med-051914-021907.
-
DOI
-
PMC
-
PubMed
Moody CA, Laimins LA. Human papillomavirus oncoproteins: pathways to transformation. Nat Rev Cancer. 2010;10(8):550–560. doi: 10.1038/nrc2886.
-
DOI
-
PubMed
Ferris RL, et al. Nivolumab for recurrent squamous-cell carcinoma of the head and neck. N Engl J Med. 2016;375(19):1856–1867. doi: 10.1056/NEJMoa1602252.
-
DOI
-
PMC
-
PubMed
Tewari KS. Clinical implications for cediranib in advanced cervical cancer. Lancet Oncol. 2015;16(15):1447–1448. doi: 10.1016/S1470-2045(15)00252-1.
-
DOI
-
PubMed