Comparative Study
. 2018 Apr 19;3(8):e99263.
doi: 10.1172/jci.insight.99263.

Generation and testing of clinical-grade exosomes for pancreatic cancer

Affiliations
Comparative Study

Generation and testing of clinical-grade exosomes for pancreatic cancer

Mayela Mendt et al. JCI Insight. .

Abstract

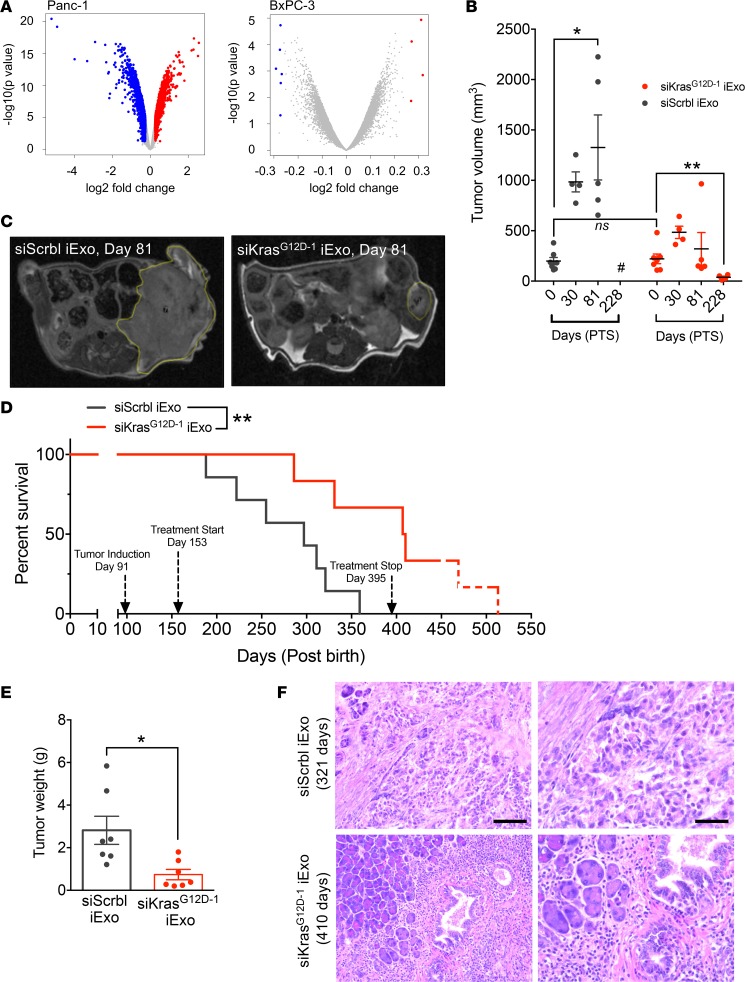
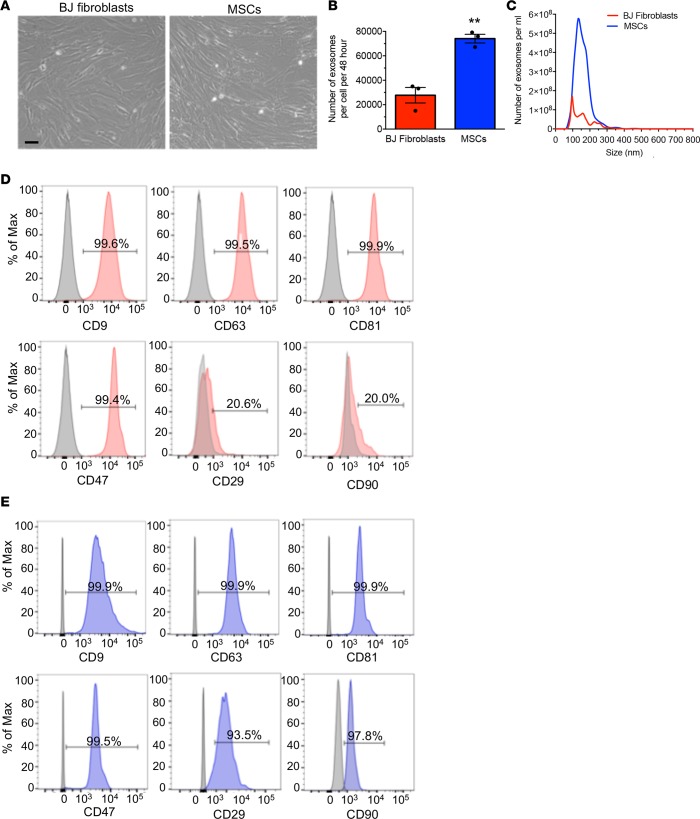
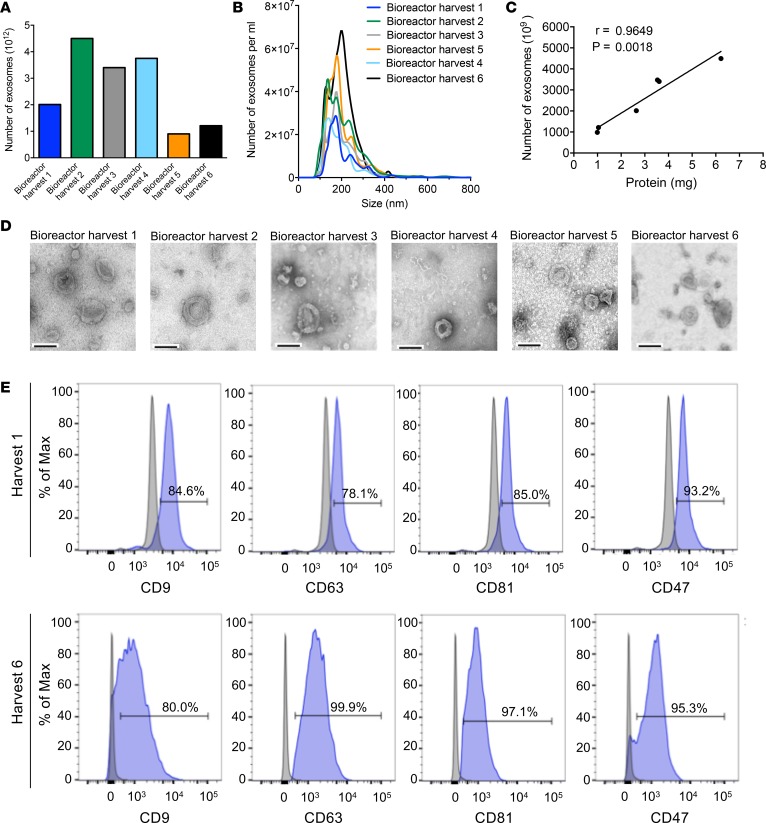
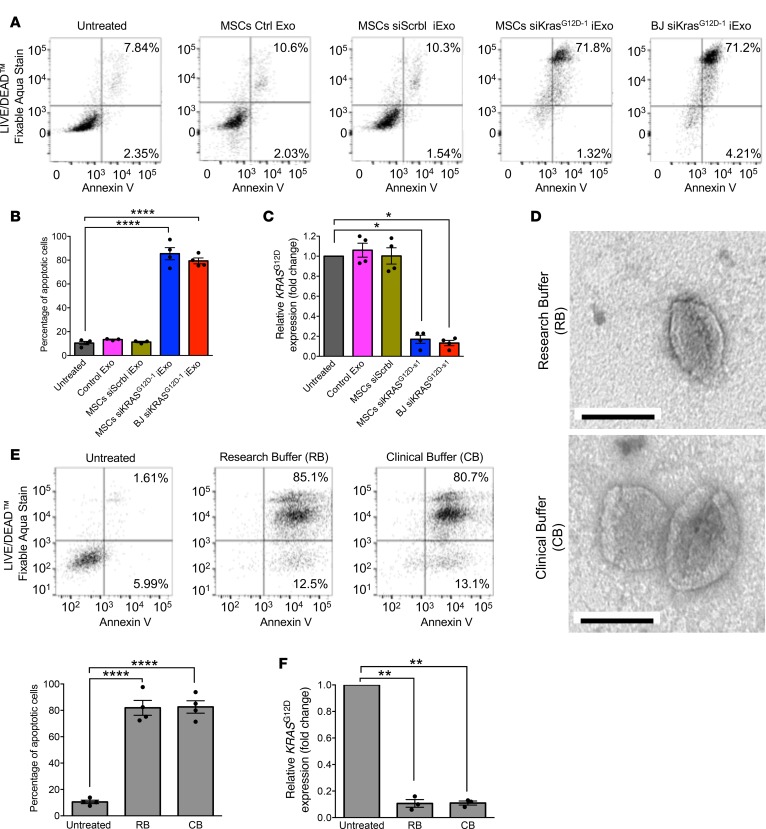
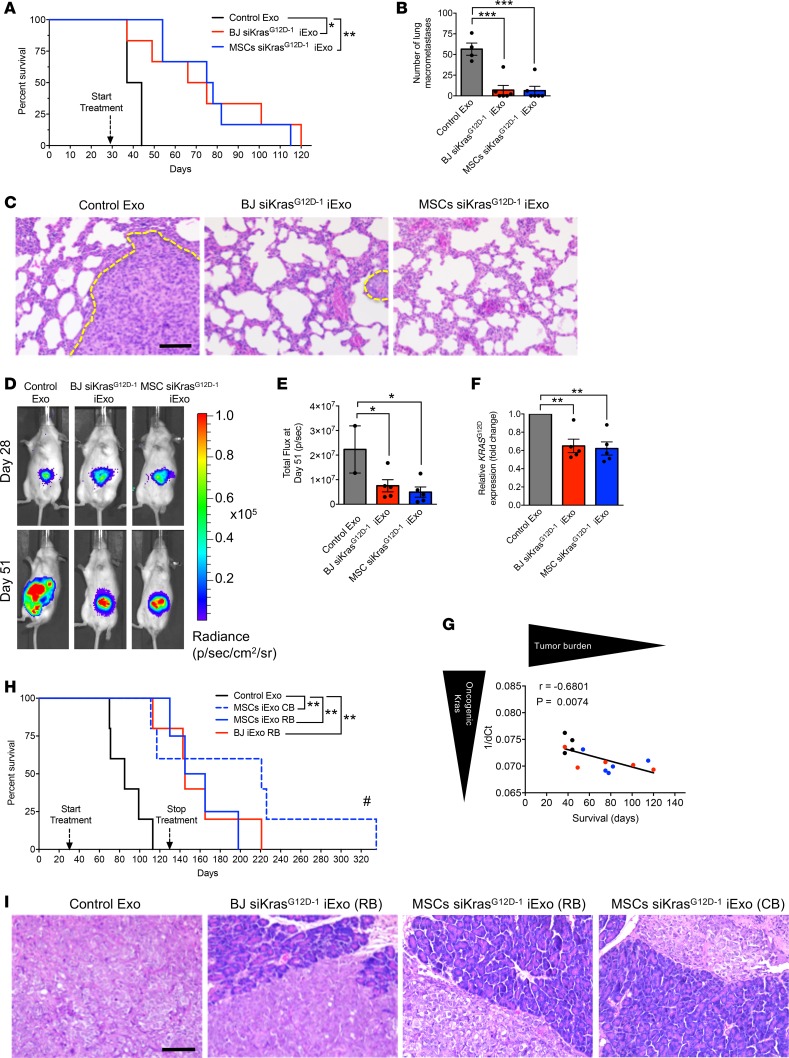
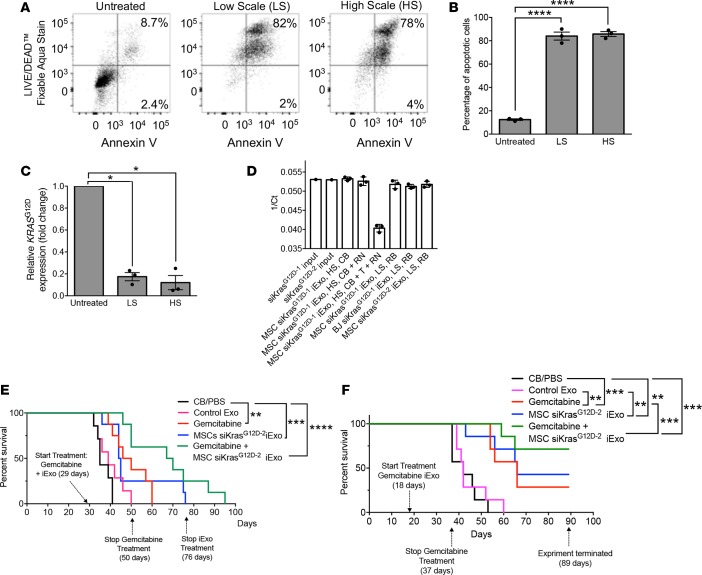
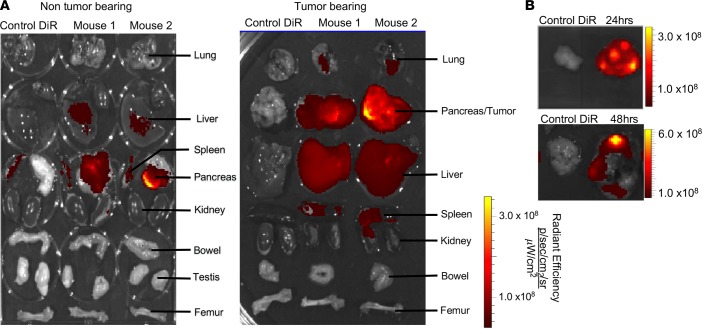
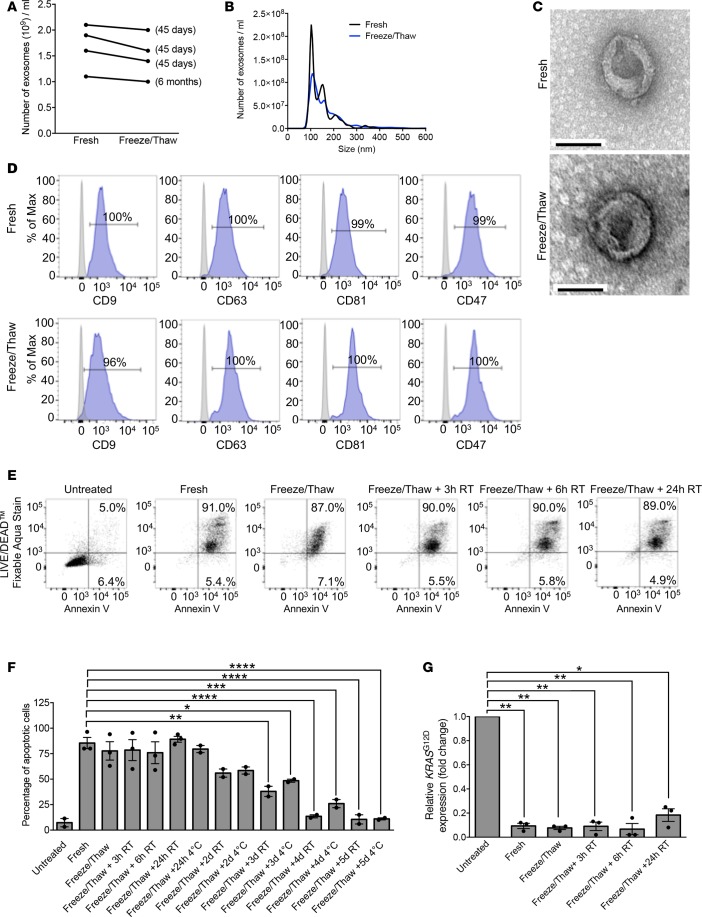
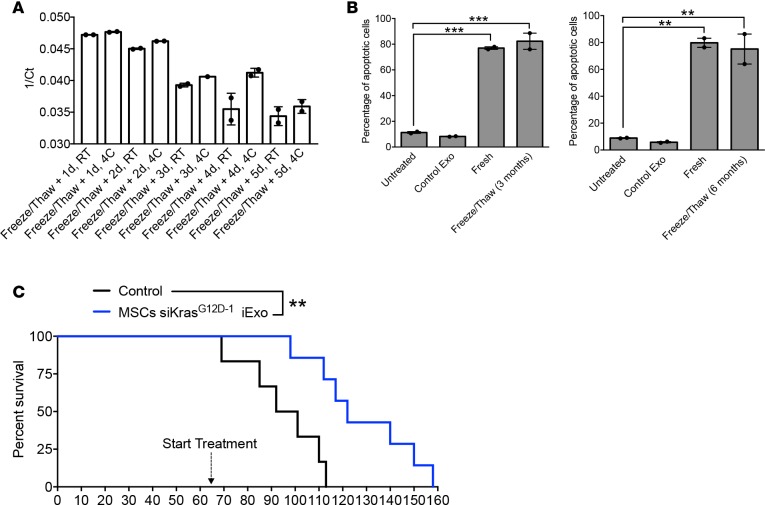
Exosomes are extracellular vesicles produced by all cells with a remarkable ability to efficiently transfer genetic material, including exogenously loaded siRNA, to cancer cells. Here, we report on a bioreactor-based, large-scale production of clinical-grade exosomes employing good manufacturing practice (GMP) standards. A standard operating procedure was established to generate engineered exosomes with the ability to target oncogenic Kras (iExosomes). The clinical-grade GMP iExosomes were tested in multiple in vitro and in vivo studies to confirm suppression of oncogenic Kras and an increase in the survival of several mouse models with pancreatic cancer. We perform studies to determine the shelf life, biodistribution, toxicology profile, and efficacy in combination with chemotherapy to inform future clinical testing of GMP iExosomes. Collectively, this report illustrates the process and feasibility of generating clinical-grade exosomes for various therapies of human diseases.

Keywords: Cancer gene therapy; Oncology.


Conflict of interest statement

Conflict of interest: The University of Texas MD Anderson Cancer Center and RK are stock equity holders in Codiak Biosciences. RK receives research support from Codiak Biosciences and serves as a member of the board of directors. VSL served as a one-time paid consultant for Codiak Biosciences.

Figures

Figure 1
Figure 1. Specific targeting of iExosomes for human PDAC cells with KrasG12D.
(A) Volcano plots depicting log2 fold change (red, upregulated genes; blue, downregulated genes; gray, genes that were not significantly deregulated) and –log10 (P value) of differentially expressed genes between siKrasG12D–1 iExo–treated Panc-1 cells and all controls and BxPC-3 cells. (B) Tumor volume measured by MRI of siKrasG12D–1 iExo (n = 7) or siScrbl iExo (n = 7) at baseline (day 0 = day 62 after tumor induction) and after treatment (day 30, 81, and 228 posttreatment start [PTS]). #, no measurement available; mice died. (C) Representative MRI images of PDX pancreas tumors; a yellow dashed line encircles the tumors. (D) Kaplan-Meier curve indicating the survival of PDX mice in the listed treatment groups after birth (siKrasG12D–1 iExo [n = 7], siScrbl iExo [n = 7]; log-rank (Mantel-Cox) test). The approximated time for the natural life span of nude mice is indicated by the red dotted line. (E) Tumor weight at end point in studies with PDX mice (siKrasG12D iExo [n = 7], siScrbl iExo [n = 7]). (F) Representative H&E image of aggressively invasive pancreatic tumors in siScrbl iExo–treated mice, in comparison with predominant inflammation and markedly reduced tumors in pancreata of siKrasG12D–1 iExo–treated mice. Scale bars: 100 μm (left); 50 μm (right). The data are presented as the mean ± SEM. Unless otherwise stated, unpaired 2-tailed t test was used to determine statistical significance. *P < 0.05, ** P < 0.01. See Supplemental Source Data 1 and 2.
Figure 2
Figure 2. Exosome production by MSCs.
(A) Representative bright-field images of BJ fibroblasts and MSCs. Scale bar: 100 μm. (B) Comparison of the number of exosomes quantified by NanoSight, produced by the same number of BJ fibroblasts and MSCs, and collected from the conditioned media over a period of 48 hours (n = 3 independent collections). (C) Particle size distribution analysis of BJ fibroblast exosomes and MSC exosomes by NanoSight. (D and E) Representative histogram of flow cytometry analysis of exosomal markers (CD9, CD63, CD81), CD47, and mesenchymal markers (CD29, CD90) on BJ fibroblasts (red, D) exosomes and MSC exosomes (blue, E). Numbers represent the percentage of positive beads (gray, isotype control). The data are presented as the mean ± SEM. Unpaired 2-tailed t test was used to determine statistical significance. **P < 0.01. See Supplemental Source Data 1 and 2.
Figure 3
Figure 3. GMP-grade production of MSC-derived exosomes.
(A) The number of exosomes, quantified by NanoSight, produced by 6 consecutive 48-hour isolations (harvests) of MSC-conditioned media from the bioreactor. (B) Particle size distribution analysis using NanoSight. (C) Correlation between the number of exosomes and exosomal protein from the bioreactor harvests (Pearson correlation test). Data shown in AC are representative of the same data, obtained from the same bioreactor experiment (Bioreactor run 1) (see also Supplemental Figure 5A). (D) Representative TEM of exosomes from each of the 6 consecutive bioreactor harvests. Scale bar: 100 nm. (E) Representative histogram of flow cytometry analysis of exosomal markers (CD9, CD63, CD81) and CD47 on exosomes from bioreactor harvests 1 and 6 (see also Supplemental Figure 5D). Numbers represent the percentage of positive beads (gray, isotype control). See Supplemental Source Data 1 and 2.
Figure 4
Figure 4. Validation of GMP-grade iExosome efficacy in vitro.
(A) Representative dot plot and (B) quantification of flow cytometry analysis of apoptosis in Panc-1 cells induced by MSC Ctrl Exo, MSC siScrbl iExo, MSC siKrasG12D–1 iExo, or BJ siKrasG12D–1 iExo after 48 hours, compared with untreated cells. Numbers represent the percentage of positive cells (n = 4 independent experiments, 1-way ANOVA compared with untreated). (C) KRASG12D transcript levels in Panc-1 cells treated with MSC Ctrl Exo, MSC siScrbl iExo, MSC siKrasG12D–1 iExo, or BJ G12D–1 iExo after 3 hours, compared with untreated cells (n = 4 independent experiments, 1-tailed unpaired t test). (D) Representative TEM of MSC exosomes, after electroporation, using either research buffer (RB) or clinical buffer (CB). Scale bar: 100 nm. (E) Representative dot plot of flow cytometry analyses and quantification of apoptosis in Panc-1 cells untreated or treated for 48 hours with MSC siKrasG12D–1 iExo electroporated using either RB or CB. Numbers represent the percentage of positive cells (n = 4 independent experiments, 1-way ANOVA compared with untreated). (F) KRASG12D transcript levels in Panc-1 cells (n = 3 independent experiments, 1-tailed unpaired t test). The mean ± SEM is depicted. *P < 0.05, **P < 0.01, ****P < 0.0001. See Supplemental Source Data 1 and 2.
Figure 5
Figure 5. Validation of GMP-grade iExosome efficacy in vivo.
(A) Kaplan-Meier curve indicating survival after tumor induction of mice with KPC689 orthotopic tumors in the listed treatment groups (Control Exo [n = 4], BJ siKrasG12D–1 iExo [n = 6], MSCs siKrasG12D–1 iExo [n = 6]; log-rank [Mantel-Cox] test). (B) Surface lung nodules of KPC689 mice (Control Exo [n = 4], BJ siKrasG12D–1 iExo [n = 6], MSCs siKrasG12D–1 iExo [n = 6]). (C) Representative H&E-stained lung sections from KPC689 mice. Tumor metastasis is indicated by a dashed yellow line. Scale bar: 100 μm. (D) Representative images of luciferase activity of KPC689 tumors at day 28 and day 51 after tumor induction (Control Exo [n = 4], BJ siKrasG12D–1 iExo [n = 6], MSCs siKrasG12D–1 iExo [n = 6]). (E) KPC689 orthotopic tumor growth (bioluminescence) and total flux at day 51 after tumor induction (Control Exo [n = 4], BJ siKrasG12D–1 iExo [n = 6], MSCs siKrasG12D–1 iExo [n = 6]). (F) KrasG12D transcript levels in KPC689 tumors at endpoint in the listed experimental groups (Control Exo [n = 4], BJ siKrasG12D–1 iExo [n = 5], MSCs siKrasG12D–1 iExo [n = 5]; 1-tailed unpaired t test). (G) Correlation between survival and 1/dCT for KrasG12D transcript levels in KPC689 tumors (Pearson correlation test) (black dots, Control Exo [n = 4]; red dots, BJ siKrasG12D–1 iExo [n = 5]; blue dots, MSCs siKrasG12D–1 iExo [n = 5]). (H) Kaplan-Meier curve indicating the survival of Panc-1 tumor-bearing mice after tumor induction in the listed treatment groups (Control Exo [n = 5], MSCs siKrasG12D–1 iExo, CB [n = 5], MSCs siKrasG12D–1 iExo, RB [n = 4], BJ siKrasG12D–1 iExo, RB [n = 5]; log-rank (Mantel-Cox) test). #, pancreas was normal and mice were not moribund (see Supplemental Figure 7A for details). (I) Representative H&E-stained sections of tumors from Panc-1 tumor-bearing mice (Control Exo [n = 5], MSCs siKrasG12D–1 iExo, CB [n = 5], MSCs siKrasG12D–1 iExo, RB [n = 4], BJ siKrasG12D–1 iExo, RB [n = 5]). Scale bar: 100 μm. Data are also depicted in Supplemental Figure 7B. The mean ± SEM is depicted. Unless stated otherwise, 1-way ANOVA, comparing experimental groups to the control group, was used to determine statistical significance. Unless the P value is specified on the figure, *P < 0.05, **P < 0.01, ***P < 0.001. See Supplemental Source Data 1 and 2.
Figure 6
Figure 6. Efficacy of large-scale produced-GMP iExosomes in combination with gemcitabine.
(A) Representative dot plot and (B) quantification of flow cytometry analyses of apoptosis in Panc-1 cells induced by MSCs siKrasG12D–2 iExo, comparing low scale (LS) or high scale (HS) electroporation of MSC exosomes. Numbers represent the percentage of positive cells (n = 3 independent experiments, 1-way ANOVA compared with untreated). (C) KRASG12D transcript levels in Panc-1 cells incubated 3 hours with MSCs siKrasG12D–2, comparing LS or HS electroporation of MSC exosomes (n = 3 independent experiments, 1-tailed unpaired t test). (D) qPCR of siRNA for KrasG12D (same siRNA sequence from 2 purchasing sources, siKrasG12D–1 and siKrasG12D–2 for source 1 and 2, respectively) in the indicated samples (n = 3 distinct samples treated on the same day; input siRNA: n = 1). The data are presented as 1/Ct and mean ± SD. CB, clinical buffer; RB, research buffer; T, Triton X-100; RN, RNase A. (E) Kaplan-Meier curve indicating the survival of KPC689 mice after tumor induction in the listed treatment groups (CB/PBS [n = 7], Control Exo [n = 7], gemcitabine [n = 8], MSC siKrasG12D–2 iExo [n = 8], gemcitabine + MSCs siKrasG12D–2 iExo [n = 8]; log-rank [Mantel-Cox] test). (F) Kaplan-Meier curve indicating the survival of KPC689 mice after tumor induction in the listed treatment groups (n = 7 mice in each of the listed groups; log-rank [Mantel-Cox] test). Unless otherwise specified, mean ± SEM is depicted. Unless stated otherwise, 1-way ANOVA, comparing experimental groups to control groups, was used to determine statistical significance. *P < 0.05, **P < 0.01, ***P < 0.001, ****P < 0.0001. See Supplemental Source Data 1 and 2.
Figure 7
Figure 7. Exosome biodistribution in mice.
(A) Imaging of the indicated organs for detection of DiR-labeled MSC exosomes, 6 hours after i.p. injection of non-tumor-bearing and tumor-bearing (KPC689) mice (DiR control only [n = 1], DiR-labeled MSC exosomes [n = 2]). (B) Imaging of the KPC689 tumors for detection of DiR-labeled MSC exosomes 24 and 48 hours after i.p. injection. Additional images are shown in Supplemental Figure 12C.
Figure 8
Figure 8. GMP-grade iExosomes stability.
(A) Comparison of the number of MSC exosomes, quantified by NanoSight, prior to freezing and after thawing of frozen exosomes (n = 4 distinct exosomes aliquots). The times listed refer to the times that exosomes were stored for at –80°C. (B) Particle size distribution analysis of fresh and frozen (45 days) and then thawed MSC exosomes by NanoSight. (C) TEM of MSC exosomes, prior to freezing (fresh) and after freezing (45 days) and thawing. Scale bar: 100 nm. (D) Representative histogram of flow cytometry analyses of exosomal markers (CD9, CD63, CD81, CD47) on fresh versus freeze (45 days) and thaw MSC exosomes. Numbers represent the percentage of positive beads (gray, isotype control). (E and F) Representative dot plot of flow cytometry analyses (E) and quantification (F) of apoptosis in Panc-1 cells induced by MSCs siKrasG12D iExo (48 hours following iExo treatment), comparing the efficacy of freeze (3 months) and thaw iExosomes that were allowed to incubate for 3, 6, and 24 hours and 2, 3, 4, and 5 days at room temperature (RT) or 4°C (n = 2–3 independent experiments). Numbers represent the percentage of positive cells. One-way ANOVA compared with fresh exosomes. (G) KRASG12D transcript levels in Panc-1 cells treated with MSCs siKrasG12D iExo after 3 hours, comparing the efficacy of freeze (3 months) and thaw of iExosomes, under the listed conditions (n = 3 independent experiments, 1-tailed unpaired t test). The mean ± SEM is depicted. *P < 0.05, **P < 0.01, ***P < 0.001, ****P < 0.0001. See Supplemental Source Data 1 and 2.
Figure 9
Figure 9. Efficacy of GMP-manufactured iExosomes.
(A) qPCR of siRNA for KrasG12D in the indicated samples (n = 2 independent experiments). MSC siKrasG12D iExo was frozen for 6 months and then thawed and allowed to incubate for 1, 2, 3, 4, and 5 days at room temperature (RT) or 4°C. (B) Quantification of flow cytometry analysis of apoptosis in Panc-1 cells after 48 hours induced by MSC iExo that were frozen for 3 and 6 months. Numbers represent the percentage of positive cells (n = 2 independent experiments). (C) Kaplan-Meier curve indicating the survival of PKS mice (Control Exo [n = 6], MSCs siKrasG12D–2 iExo [n = 7]; log-rank [Mantel-Cox] test). MSC iExo were generated in the GMP facility, and the electroporated iExosomes were frozen for at least 5 months, thawed, and directly injected in mice. The mean ± SEM is depicted. Unless stated otherwise, 1-way ANOVA comparing experimental groups to control groups was used to determine statistical significance. **P < 0.01, ***P < 0.001. See Supplemental Source Data 1 and 2.

References

    1. Kalluri R. The biology and function of exosomes in cancer. J Clin Invest. 2016;126(4):1208–1215. doi: 10.1172/JCI81135. - DOI - PMC - PubMed
    1. Kowal J, Tkach M, Théry C. Biogenesis and secretion of exosomes. Curr Opin Cell Biol. 2014;29:116–125. doi: 10.1016/j.ceb.2014.05.004. - DOI - PubMed
    1. Ha D, Yang N, Nadithe V. Exosomes as therapeutic drug carriers and delivery vehicles across biological membranes: current perspectives and future challenges. Acta Pharm Sin B. 2016;6(4):287–296. doi: 10.1016/j.apsb.2016.02.001. - DOI - PMC - PubMed
    1. Marcus ME, Leonard JN. FedExosomes: Engineering therapeutic biological nanoparticles that truly deliver. Pharmaceuticals (Basel) 2013;6(5):659–680. doi: 10.3390/ph6050659. - DOI - PMC - PubMed
    1. van den Boorn JG, Dassler J, Coch C, Schlee M, Hartmann G. Exosomes as nucleic acid nanocarriers. Adv Drug Deliv Rev. 2013;65(3):331–335. doi: 10.1016/j.addr.2012.06.011. - DOI - PubMed

Publication types

Substances