. 2018 May 1;9(5):449.
doi: 10.1038/s41419-018-0491-3.

Upregulation of neuronal astrocyte elevated gene-1 protects nigral dopaminergic neurons in vivo

Affiliations

Upregulation of neuronal astrocyte elevated gene-1 protects nigral dopaminergic neurons in vivo

Eunju Leem et al. Cell Death Dis. .

Abstract

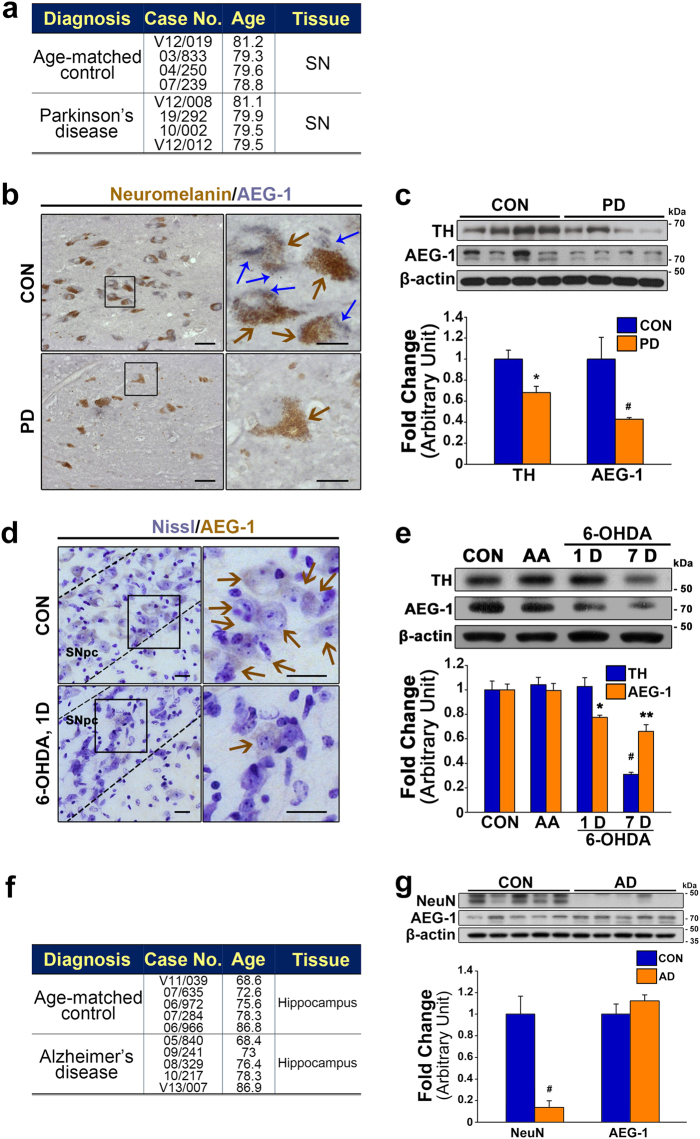
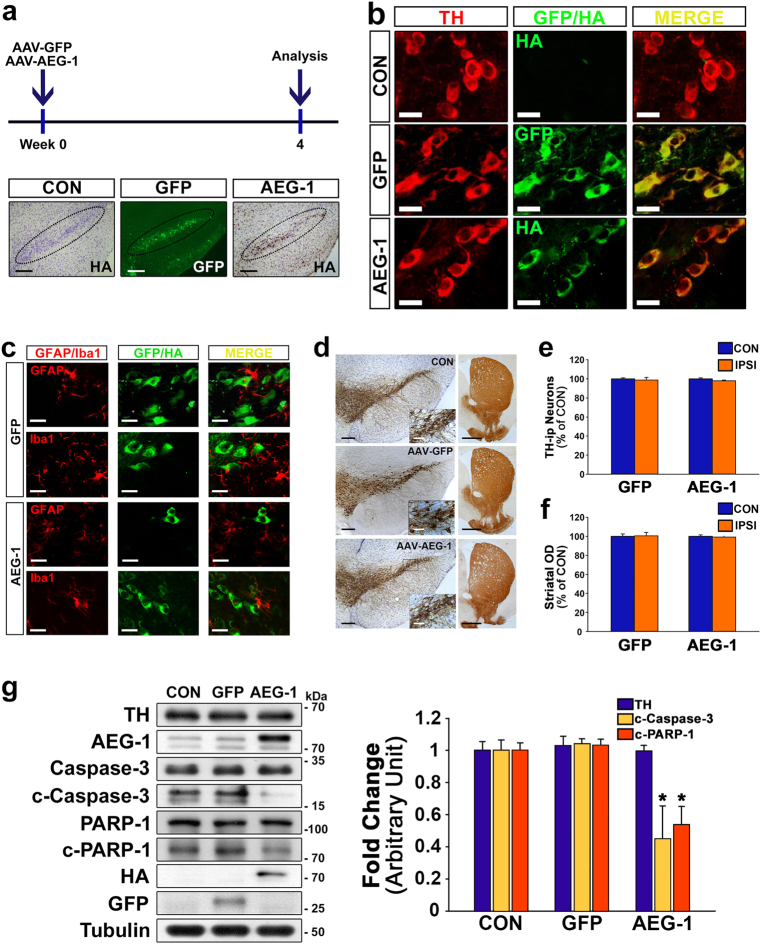
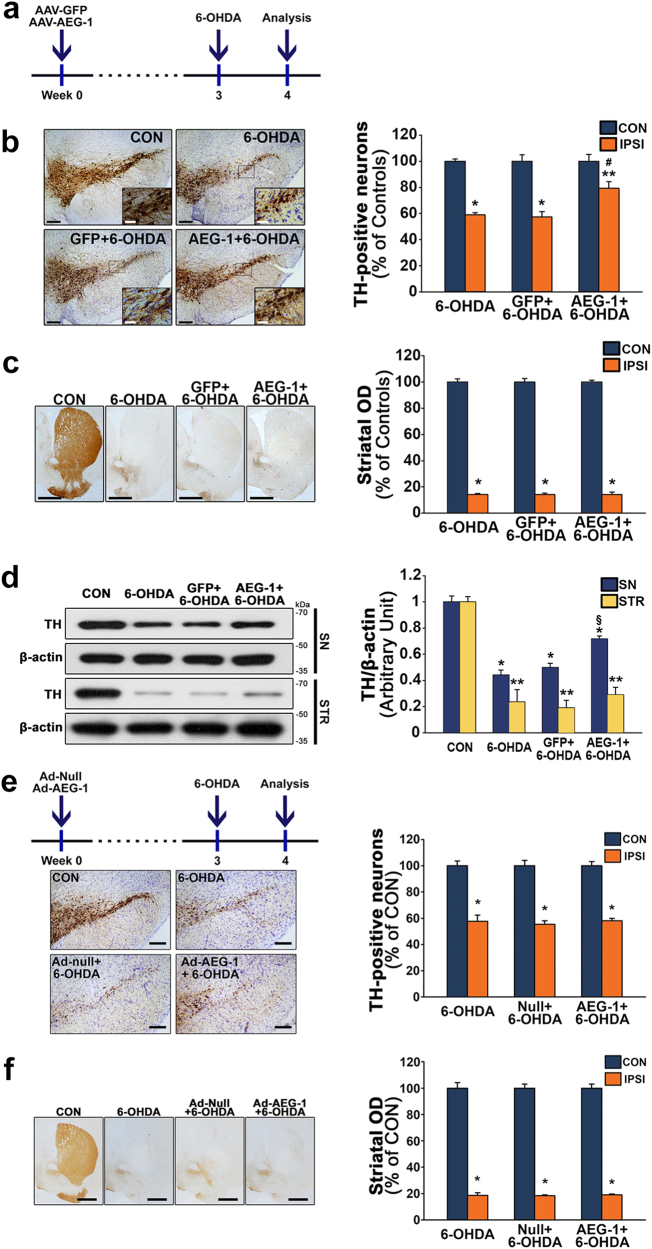
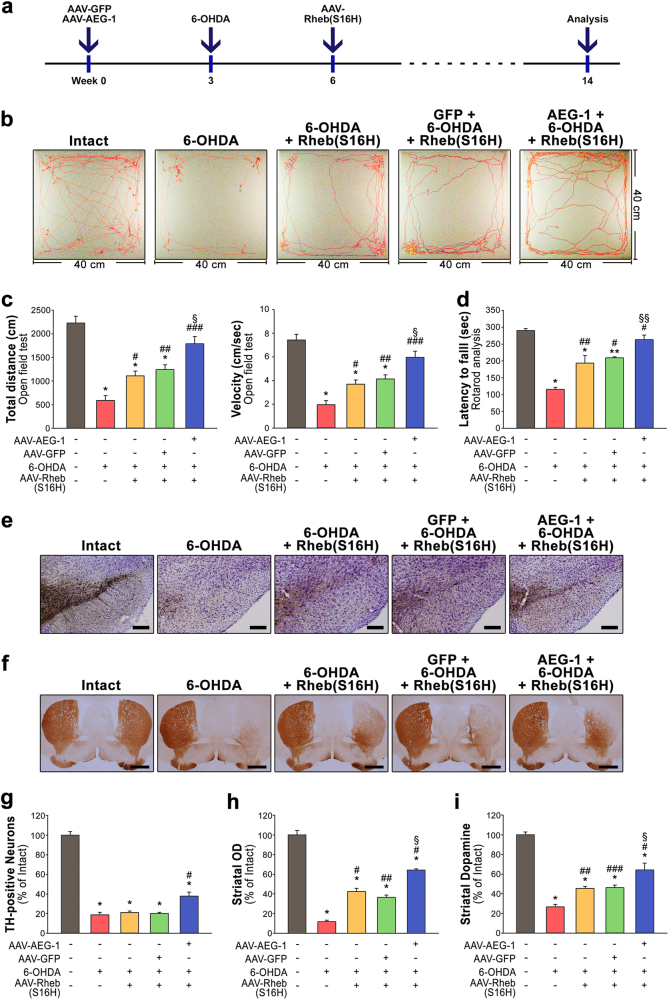
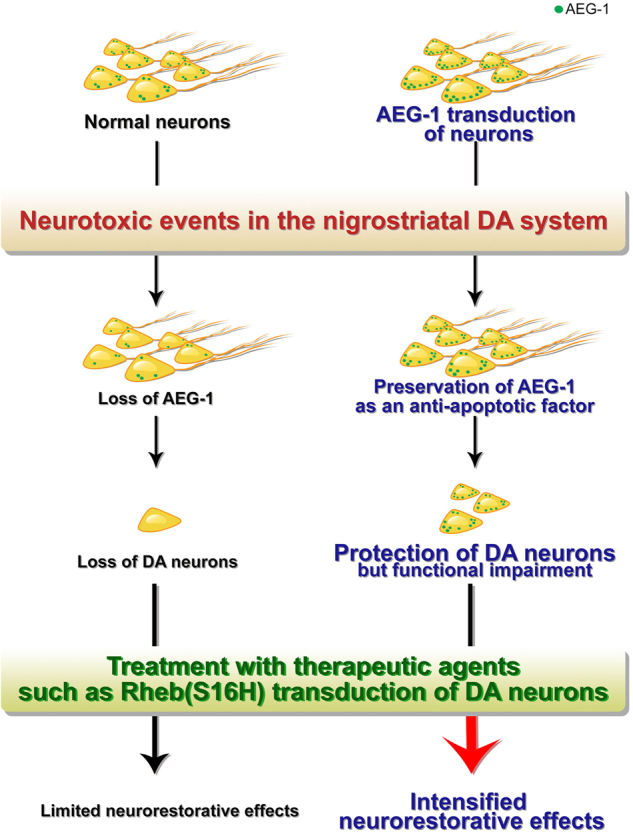
The role of astrocyte elevated gene-1 (AEG-1) in nigral dopaminergic (DA) neurons has not been studied. Here we report that the expression of AEG-1 was significantly lower in DA neurons in the postmortem substantia nigra of patients with Parkinson's disease (PD) compared to age-matched controls. Similarly, decreased AEG-1 levels were found in the 6-hydroxydopamine (6-OHDA) mouse model of PD. An adeno-associated virus-induced increase in the expression of AEG-1 attenuated the 6-OHDA-triggered apoptotic death of nigral DA neurons. Moreover, the neuroprotection conferred by the AEG-1 upregulation significantly intensified the neurorestorative effects of the constitutively active ras homolog enriched in the brain [Rheb(S16H)]. Collectively, these results demonstrated that the sustained level of AEG-1 as an important anti-apoptotic factor in nigral DA neurons might potentiate the therapeutic effects of treatments, such as Rheb(S16H) administration, on the degeneration of the DA pathway that characterizes PD.


Conflict of interest statement

The authors declare that they have no conflict of interest.

Figures

Fig. 1
Fig. 1. Decreased levels of astrocyte elevated gene-1 (AEG-1) in the postmortem substantia nigra (SN) of patients with Parkinson’s disease (PD) and the SN of 6-hydroxydopamine (6-OHDA)-treated mice.
a Description of the human postmortem SN tissue. b Immunohistochemistry for AEG-1 in the human SN. Scale bar, 50 μm. The square insets in the left panels contain magnifications of the photomicrographs in the right panels. Scale bar, 20 μm. The blue arrows indicate AEG-1 immunoreactivity, and the brown arrows indicate neuromelanin immunoreactivity. c Western blot analysis of the levels of tyrosine hydroxylase (TH) and AEG-1 in the human SN. *p = 0.022 and #p = 0.033 vs. age-matched controls (CON) (t-test; n = 4 for each group). d Representative sections showing AEG-1 expression (with Nissl counterstaining) in the mouse SN pars compacta (SNpc), which is outlined by the dotted lines. Scale bar, 20 μm. The square insets in the left contain magnifications of the photomicrographs in the right panels. Scale bar, 20 μm. e Western blot analyses of the levels of AEG-1 and TH in the mouse SN. AA ascorbic acid. *p = 0.024 and **p = 0.001 vs. intact CON; #p < 0.001 for TH, significantly different from CON [one-way analysis of variance (ANOVA) with Tukey’s post hoc test; n = 4 for each group]. f Description of the human postmortem hippocampal tissue. g Western blot analyses of the levels of AEG-1 and neuronal nuclei (NeuN) in the hippocampus of patients with Alzheimer’s disease (AD) and CON. Please note that of the levels of AEG-1 are not decreased in the postmortem hippocampus of patients with AD compared with CON. #p = 0.001 vs. CON (t-test; n = 5 for each group)
Fig. 2
Fig. 2. Adeno-associated virus (AAV)-AEG-1 transduction of dopaminergic (DA) neurons in the in vivo SN of healthy mice.
a Experimental schematic and the immunostaining for green fluorescent protein (GFP; green) and hemagglutinin (HA; brown) in the SNpc, which is outlined by the dotted elliptical shape, which was conducted following each viral injection. Scale bar, 200 μm. b Representative double immunofluorescent labeling of TH (red) and GFP (green) or TH and HA (green) in the SNpc. Scale bar, 20 μm. c Representative double immunofluorescent labeling for glial fibrillary acidic protein (GFAP)/ionized calcium binding adaptor molecule 1 (Iba1; red), which are markers of astrocytes and microglia, respectively, and GFP/HA (green) in the SNpc of healthy mice. Scale bar, 20 μm. d Immunostaining for TH in the SN and striatum (STR). Scale bars, 200 μm (black) and 50 μm (white) for the SN, and 1000 μm for the STR. e, f The number and optical density of the nigral TH-positive neurons and striatal TH-positive fibers, respectively (one-way ANOVA with Tukey’s post hoc test; n = 4 for each group). CON contralateral side, IPSI ipsilateral side. g Western blot analyses of the levels of cleaved caspase-3 (c-caspase-3) and cleaved poly (ADP-ribose) polymerase 1 (c-PARP-1) following AEG-1 transduction in the SN of healthy brains. *p = 0.005 vs. CON (one-way ANOVA with Tukey’s post hoc test; n = 4 for each group)
Fig. 3
Fig. 3. Anti-apoptotic effects of AEG-1 transduction in DA neurons on 6-OHDA neurotoxicity.
a Western blot analyses show a significant increase in the levels of caspase-3, c-caspase-3, and c-PARP1 in the postmortem tissues of patients with PD compared with CON. &p = 0.014 for caspase-3, &&p = 0.019 for c-caspase-3, and &&&p = 0.009 for c-PARP-1, vs. CON (t-test; n = 4 for each group). b Experimental schematic for Fig. 3c, d. c Representative double immunofluorescence labeling for TH (red) and c-caspase-3 (green) or TH and c-PARP-1 (green) in the mouse SN. AEG-1 upregulation induces reductions in the levels of expression of both c-caspase-3 and c-PARP-1 in TH-positive DA neurons in the SN with 6-OHDA neurotoxicity. Scale bar, 20 μm. d Western blot analyses of the levels of c-caspase-3 and c-PARP-1 in the SN 2 days after 6-OHDA treatment. *p = 0.029, **p = 0.025, #p = 0.032, and ##p = 0.016 vs. CON; ***p = 0.009 and ###p = 0.002 vs. 6-OHDA alone (one-way ANOVA with Tukey’s post hoc test; n = 4 for each group)
Fig. 4
Fig. 4. Upregulation of neuronal AEG-1 protects DA neurons from 6-OHDA-induced neurotoxicity.
a Experimental schematic for bd. b Representative coronal sections of the SN stained with anti-TH at 7 days post-lesion. Representative high-power micrographs are shown in the inset to aid visualization. Scale bars, 200 μm (black) and 50 μm (white). The quantitative analysis shows a population of preserved TH-positive neurons in the SN. *p < 0.001 and **p = 0.023 vs. CON; #p = 0.026 vs. 6-OHDA (n = 4 for each group). c Neuroprotective effects of AEG-1 are not observed on striatal TH-positive fibers. Scale bar, 1000 μm. The histogram shows the optical densities of the striatal TH-positive fibers. *p < 0.001 vs. CON (n = 4 for each group). d Western blot analysis of the levels of TH with 6-OHDA-induced neurotoxicity in the nigrostriatal DA system. *p < 0.001 for SN and **p < 0.001 for STR vs. CON; §p = 0.002 vs. 6-OHDA alone (n = 4 for each group). e, f Experimental schematic and representative coronal sections show that glial AEG-1 upregulation by Ad transduction does not protect the nigrostriatal DA system in the 6-OHDA-treated mouse model of PD. Scale bars, 200 μm for SN and 1000 μm for STR. *p < 0.001 vs. CON (n = 4 for each group). One-way ANOVA with Tukey’s post hoc test was used in bf
Fig. 5
Fig. 5. Synergistic effects of AEG-1 and Rheb(S16H) in the disrupted nigrostriatal DA system in vivo.
a Experimental schematic. b, c Total distance traveled for 5 min and velocity in the open-field test. *p < 0.001 vs. intact controls; ##p = 0.010 and ###p < 0.001 vs. 6-OHDA alone; §p = 0.007 vs. 6-OHDA + AAV-Rheb(S16H) group (one-way ANOVA with Tukey’s post hoc test; n = 5 for each group). #p = 0.008 vs. 6-OHDA alone (t-test). d Motor deficits measured by using the rotarod test. *p < 0.001 and **p = 0.002 vs. intact controls; #p < 0.001 and ##p = 0.002 vs. 6-OHDA alone; §p = 0.006 vs. 6-OHDA + AAV-Rheb(S16H) group (n = 5 for each group). e, f Representative coronal SN (scale bar, 200 μm) and STR (scale bar, 1000 μm) sections stained with anti-TH at 11 weeks post-lesion. g Quantitative analysis showing the population of preserved TH-positive neurons in the SN. *p < 0.001 vs. intact controls; #p = 0.006 vs. 6-OHDA alone (n = 3 for each group). h The histogram shows the optical densities of the striatal TH-positive fibers. *p < 0.001 vs. intact controls; #p < 0.001 and ##p = 0.001 vs. 6-OHDA alone; §p = 0.003 vs. 6-OHDA + AAV-Rheb(S16H) group (n = 3 for each group). i The levels of striatal dopamine, which were measured with high-performance liquid chromatography, were quantitatively expressed as a percentage of intact control. *p < 0.001 vs. intact controls; #p < 0.001, ##p = 0.024 and ###p = 0.028 vs. 6-OHDA alone; §p = 0.024 vs. 6-OHDA + AAV-Rheb(S16H) group [n = 4 for AAV-GFP + 6-OHDA + AAV-Rheb(S16H) group; n = 5 for the other groups]. One-way ANOVA with Tukey’s post hoc test was used in d and gi
Fig. 6
Fig. 6. Schematic of the importance of neuronal AEG-1 preservation in the nigrostriatal DA system.
Following neurotoxic events in the nigrostriatal DA system, AEG-1 transduction in DA neurons prevents the apoptotic cell death of the DA neurons (but not their functional properties). Meanwhile, decreases in the levels of neuronal AEG-1 and the consequent loss of DA neurons were observed. Moreover, AEG-1 transduction in DA neurons can intensify the neurorestorative effects by synergizing with the administration of therapeutic agents for axonal regeneration and the inhibition of abnormal activation of the autophagy–lysosomal pathway. Thus, these results suggest the importance of AEG-1 preservation in potential therapeutic strategies against PD

References

    1. Su ZZ, et al. Identification and cloning of human astrocyte genes displaying elevated expression after infection with HIV-1 or exposure to HIV-1 envelope glycoprotein by rapid subtraction hybridization, RaSH. Oncogene. 2002;21:3592–3602. doi: 10.1038/sj.onc.1205445. - DOI - PubMed
    1. Su ZZ, et al. Customized rapid subtraction hybridization (RaSH) gene microarrays identify overlapping expression changes in human fetal astrocytes resulting from human immunodeficiency virus-1 infection or tumor necrosis factor-alpha treatment. Gene. 2003;306:67–78. doi: 10.1016/S0378-1119(03)00404-9. - DOI - PubMed
    1. Lee SG, Kang DC, DeSalle R, Sarkar D, Fisher PB. AEG-1/MTDH/LYRIC, the beginning: initial cloning, structure, expression profile, and regulation of expression. Adv. Cancer Res. 2013;120:1–38. doi: 10.1016/B978-0-12-401676-7.00001-2. - DOI - PMC - PubMed
    1. Emdad L, et al. AEG-1/MTDH/LYRIC: a promiscuous protein partner critical in cancer, obesity, and CNS diseases. Adv. Cancer Res. 2016;131:97–132. doi: 10.1016/bs.acr.2016.05.002. - DOI - PubMed
    1. Yin X, et al. Downregulated AEG-1 together with inhibited PI3K/Akt pathway is associated with reduced viability of motor neurons in an ALS model. Mol. Cell. Neurosci. 2015;68:303–313. doi: 10.1016/j.mcn.2015.08.009. - DOI - PubMed

Publication types

MeSH terms