. 2018 Apr 18;9(1):1544.
doi: 10.1038/s41467-018-03796-7.

TAp63 contributes to sexual dimorphism in POMC neuron functions and energy homeostasis

Affiliations

TAp63 contributes to sexual dimorphism in POMC neuron functions and energy homeostasis

Chunmei Wang et al. Nat Commun. .

Abstract

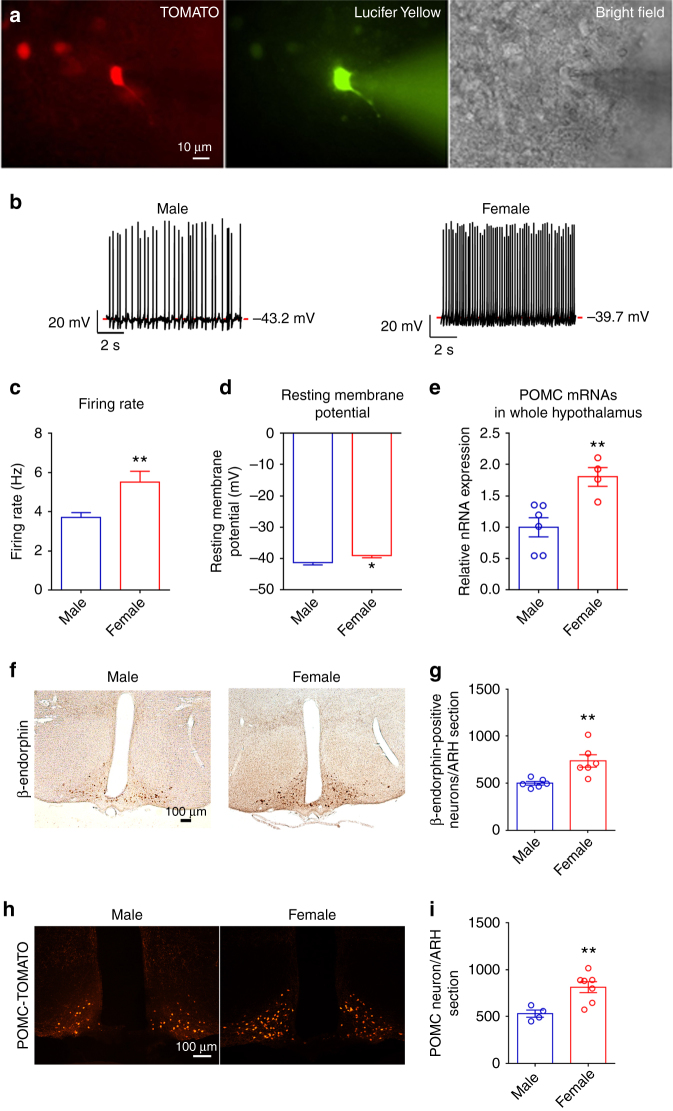
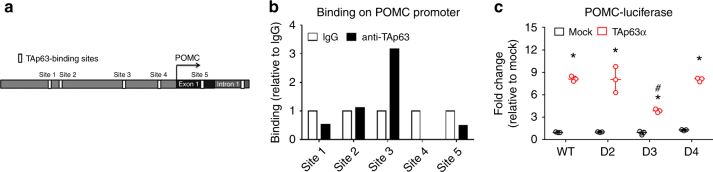
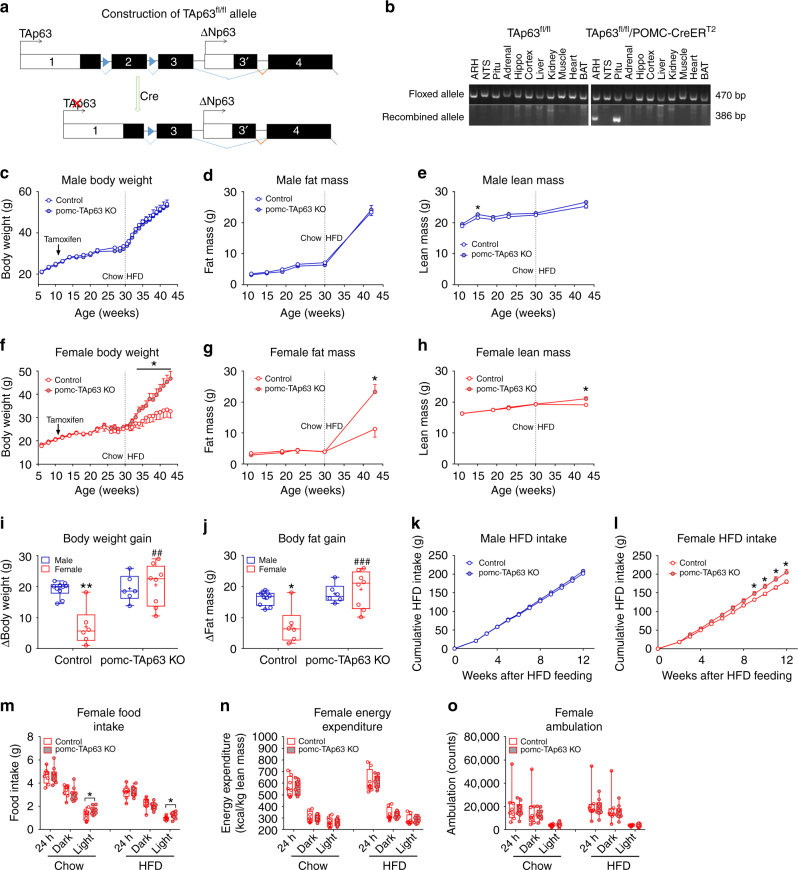
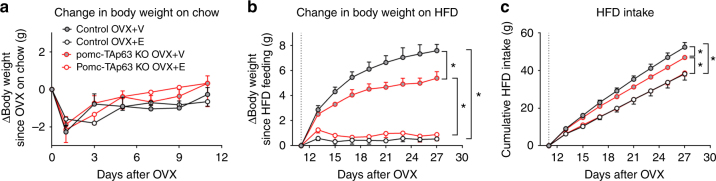
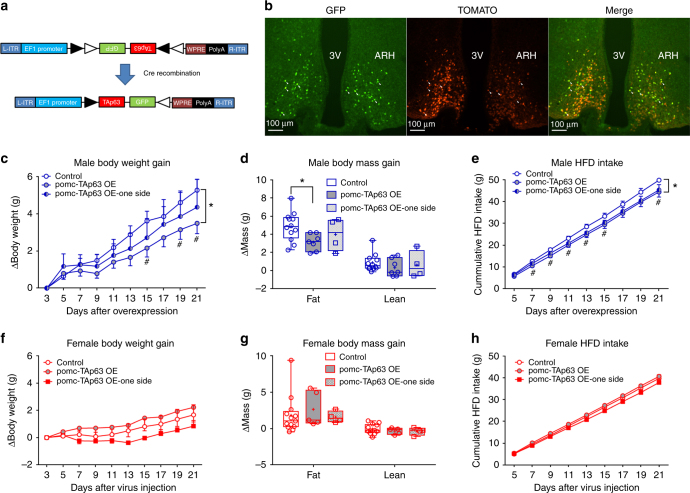
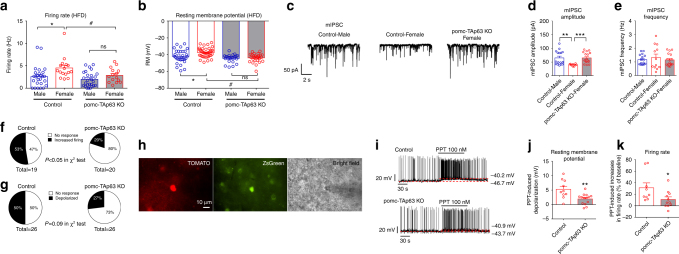
Sexual dimorphism exists in energy balance, but the underlying mechanisms remain unclear. Here we show that the female mice have more pro-opiomelanocortin (POMC) neurons in the arcuate nucleus of hypothalamus than males, and female POMC neurons display higher neural activities, compared to male counterparts. Strikingly, deletion of the transcription factor, TAp63, in POMC neurons confers "male-like" diet-induced obesity (DIO) in female mice associated with decreased POMC neural activities; but the same deletion does not affect male mice. Our results indicate that TAp63 in female POMC neurons contributes to the enhanced POMC neuron functions and resistance to obesity in females. Thus, TAp63 in POMC neurons is one key molecular driver for the sexual dimorphism in energy homeostasis.


Conflict of interest statement

The authors declare no competing interests.

Figures

Fig. 1
Fig. 1
POMC neurons display sexual dimorphism in neural activities and gene transcription. a Fluorescence for TOMATO (left) and Lucifer Yellow (middle), and bright-field illumination (right) of the recorded POMC neuron in a brain slice prepared from POMC-CreERT2/Rosa26-tdTOMATO mouse with tamoxifen induction at 11 weeks of age. b Representative current clamp traces in POMC neurons from chow-fed male or female POMC-CreERT2/Rosa26-tdTOMATO mice at the age of 15–16 weeks. c, d Average firing rate (c) and resting membrane potential (d) in POMC neurons from male or female POMC-CreERT2/Rosa26-tdTOMATO mice. Data are presented as mean ± SEM. N = 37–78 per group. *P < 0.05 or **P < 0.01 in t-tests. e POMC mRNAs levels in the entire hypothalamus from male or female littermates (16 weeks of age), quantified by RT–qPCR. Data are presented as mean ± SEM with individual data points. N = 4 or 6 per group. **P < 0.01 in t-tests. f Representative immunostaining images for β-endorphin in the hypothalamus of male or female littermates (16 weeks of age). g Quantifications of β-endorphin-positive neurons in the hypothalamus from 1 out of five consecutive brain sections of male or female littermates. Data are presented as mean ± SEM with individual data points. N = 6 per group. **P < 0.01 in t-tests. h Representative fluorescent images for TOMATO in the hypothalamus of male or female POMC-CreERT2/Rosa26-tdTOMATO littermates (tamoxifen injected at 11 weeks of age, and perfused at 16 weeks of age). i Quantifications of TOMATO-positive neurons (POMC neurons) in the hypothalamus of one out of five consecutive brain sections of male or female littermates (tamoxifen injected at 11 weeks of age, and perfused at 16 weeks of age). Data are presented as mean ± SEM with individual data points. N = 4 or 7 per group. **P < 0.01 in t-tests
Fig. 2
Fig. 2
TAp63 stimulates POMC gene expression. a Five potential TAp63-binding sites on mouse POMC gene promoter. Site 1: −2011 to −1989; site 2: −1840 to −1818; site 3: −884 to −862; site 4: −155 to −135; site 5: 436–458, relative to the transcriptional start site. b CHIP assay using TAp63 antibody (or IgG as negative controls) to pull down the TAp63-binding sites from mouse hypothalamus. c Effects of TAp63α on POMC-luciferase activity in N46 cells. WT, pGL3b-POMC promoter; D2-4, pGL3b-POMC promoter with the deletion of sites 2, 3, or 4. Data are presented as box and wiskers showing minimal, maximal, and median values with individual data points. N = 3. *P < 0.05 vs. mock in the same POMC promoter; #P < 0.05 vs. WT POMC promoter in response to the same TAp63 overexpression in two-way ANOVA analysis followed by post hoc Sidak tests
Fig. 3
Fig. 3
Deletion of TAp63 in POMC neurons diminishes sexual dimorphism in body weight responses to chronic HFD feeding. a Construction of TApfl/fl mouse allele. Two loxP sites flank exon 2 of the p63 gene and Cre-mediated recombination results in disruption of TAp63 expression; ΔNp63 expression starts from exon 3 and is therefore not affected by the recombination. b PCR detection of TApfl/fl allele and Cre-induced recombination in various tissues from the control (TAp63fl/fl) or the pomc-TAp63 KO (TAp63fl/fl/POMC-CreERT2) mice. Adrenal, adrenal gland; ARH, arcuate nucleus of the hypothalamus; BAT, brown adipose tissue; hippo, hippocampus; NTS, nucleus of the solitary tract; pitu, pituitary. ce Body weight (c), fat mass (d), and lean mass (e) of male mice. Data are presented as mean ± SEM. N = 6 or 10 per group. *P < 0.05 in t-tests. fh Body weight (f), fat mass (g), and lean mass (h) of female mice. Data are presented as mean ± SEM. N = 6 or 8 per group. *P < 0.05 in two-way ANOVA followed by post hoc Sidak tests. ij Gains in body weight (i) and fat mass (j) during the 13-week HFD feeding. Data are presented as box and wiskers showing minimal, maximal, and median values with individual data points. N = 6–10 per group. *P < 0.05 or **P < 0.01 between male vs. female with the same genotype; ##P < 0.01 or ###P < 0.001 between the two genotypes within the same sex in two-way ANOVA followed by post hoc Sidak tests. kl Cumulative HFD intake in male (k) and female (l) mice during the 13-week HFD feeding. Data are presented as mean ± SEM. N = 6 or 10 per group. *P < 0.05 in two-way ANOVA followed by post hoc Sidak tests. mo Female control and pomc-TAp63 KO littermates (30 weeks of age) were adapted into the CLAMS metabolic cages and subjected to a 3-day chow 3-day HFD feeding protocol. Food intake (m), energy expenditure (normalized to lean mass, (n)), and ambulation (o) when fed chow or HFD. Data are presented as box and wiskers showing minimal, maximal, and median values with individual data points. N = 8 or 10 per group. *P < 0.05 between the two genotypes in t-tests
Fig. 4
Fig. 4
Selective deletion of TAp63 in POMC neurons fails to affect the estrogen-induced anorexigenic effects in female mice. a, b Changes in body weight of female control or pomc-TAp63 KO mice that received OVX+V or OVX+E treatment, followed by 11-day chow feeding (a) and 16-day HFD feeding (b). c Cumulative food intake during the HFD feeding period. Data are presented as mean ± SEM. N = 4 or 5 per group. *P < 0.05 in two-way repeated ANOVA followed by post hoc Sidak tests
Fig. 5
Fig. 5
Selective overexpression of TAp63 in POMC neurons reduces the body weight of male HFD-fed mice. a Schematic construction of AAV vector, AAV-FLEX-TAp63-2A-GFP. b Immunofluorescent images showing GFP (left panel), TOMATO (middle panel), and merge (right panel) in POMC neurons of POMC-Cre/Rosa26-tdTOMATO mice receiving AAV-FLEX-TAp63-2A-GFP stereotaxically injected in the ARH bilaterally. The majority of GFP-labeled neurons are TOMATO-positive; only a few double-labeled neurons are pointed by arrowheads for a better view. 3 V, 3rd ventricle; ARH, arcuate nucleus of the hypothalamus. c Changes in body weight in HFD-fed male mice. Data are presented as mean ± SEM. N = 7 or 12 in control or OE group; N = 4 in one side group. *P < 0.05 between groups and #P < 0.05 between the control and pomc-TAp63 OE groups at each time point in two-way ANOVA followed by post hoc Sidak tests. d Changes in the fat and lean mass in HFD-fed male mice. Data are presented as box and wiskers showing minimal, maximal, and median values with individual data points. N = 7 or 12 in control or OE group; N = 4 in one side group. *P < 0.05 in two-way ANOVA followed by post hoc Sidak tests. e Cumulative HFD intake in HFD-fed male mice. Data are presented as mean ± SEM. N = 7 or 12 in control or OE group; N = 4 in one side group. *P < 0.05 between groups and #P < 0.05 between the control and pomc-TAp63 OE groups at each time point in two-way ANOVA followed by post hoc Sidak tests. f Changes in body weight in HFD-fed female mice. Data are presented as mean ± SEM. N = 5 or 13 in control or OE group; N = 4 in one side group. g Changes in the fat and the lean mass in HFD-fed female mice. Data are presented as box and wiskers showing minimal, maximal, and median values with individual data points. N = 5 or 13 in control or OE group; N = 4 in one side group. h Cumulative HFD intake in HFD-fed female mice. Data are presented as mean ± SEM. N = 5 or 13 in control or OE group; N = 4 in one side group
Fig. 6
Fig. 6
Selective deletion of TAp63 in POMC neurons impairs neural activities of POMC neurons. a Firing rate, recorded by the whole-cell patch clamp, in POMC neurons from male and female mice, with or without POMC-specific TAp63 deletion, that have been fed with HFD for 4 weeks. Data are presented as mean ± SEM with individual data points. N = 15–26 per group. *P < 0.05 between male and female with the same genotype; #P < 0.05 between the two genotypes with the same sex in two-way ANOVA followed by post hoc Sidak tests. b Resting membrane potential, recorded by the perforated patch clamp, in POMC neurons from male and female mice, with or without POMC-specific TAp63 deletion, that have been fed with HFD for 4 weeks. Data are presented as mean ± SEM with individual data points. N = 22–39 per group. *P < 0.05 between male and female with the same genotype; #P < 0.05 between the two genotypes with the same sex in two-way ANOVA followed by post hoc Sidak tests. c Typical mIPSC recorded from the POMC neurons of control male, control female, or pomc-TAp63 KO female mice that have been fed with HFD for 4 weeks. d, e Amplitude (d) and frequency (e) of mIPSC in POMC neurons. Data are presented as mean ± SEM with individual data points. N = 10–17 per group. **P < 0.01 or ***P < 0.001 in one-way ANOVA followed by Sidak tests. f, g Percentage of POMC neurons from control and pomc-TAp63 KO mice that were activated by PPT. PPT-induced activation was defined as either > 20% increases in firing rate (f) or by > 2 mV depolarization (g). h Fluorescence for TOMATO (left) and ZsGreen (middle), and bright-field illumination (right) of a recorded ERα-positive POMC neuron in a brain slice prepared from ERα-ZsGreen/POMC-CreERT2/Rosa26-tdTOMATO mouse with tamoxifen induction at 11 weeks of age. i Representative current clamp traces for PPT-induced responses in ERα-positive POMC neurons from control or pomc-TAp63 KO mice. j, k PPT-induced depolarization (j) and increases in firing rate (k) in ERα-positive POMC neurons from control or pomc-TAp63 KO mice. Data are presented as mean ± SEM. N = 10–14 per group. *P < 0.05 or **P < 0.01 in t-tests

References

    1. Sugiyama MG, Agellon LB. Sex differences in lipid metabolism and metabolic disease risk. Biochem. Cell Biol. 2012;90:124–141. doi: 10.1139/o11-067. - DOI - PubMed
    1. Shi H, Seeley RJ, Clegg DJ. Sexual differences in the control of energy homeostasis. Front. Neuroendocrinol. 2009;30:396–404. doi: 10.1016/j.yfrne.2009.03.004. - DOI - PMC - PubMed
    1. Woodward CJ, Emery PW. Energy balance in rats given chronic hormone treatment. 2. Effects of Corticosterone. Br. J. Nutr. 1989;61:445–452. doi: 10.1079/BJN19890134. - DOI - PubMed
    1. Grove KL, Fried SK, Greenberg AS, Xiao XQ, Clegg DJ. A microarray analysis of sexual dimorphism of adipose tissues in high-fat-diet-induced obese mice. Int J. Obes. (Lond.) 2010;34:989–1000. doi: 10.1038/ijo.2010.12. - DOI - PMC - PubMed
    1. Stubbins RE, Holcomb VB, Hong J, Nunez NP. Estrogen modulates abdominal adiposity and protects female mice from obesity and impaired glucose tolerance. Eur. J. Nutr. 2012;51:861–870. doi: 10.1007/s00394-011-0266-4. - DOI - PubMed

Publication types

LinkOut - more resources