. 2018 Apr 18;9(1):1538.
doi: 10.1038/s41467-018-04004-2.

Nuclear receptor NR2F6 inhibition potentiates responses to PD-L1/PD-1 cancer immune checkpoint blockade

Affiliations

Nuclear receptor NR2F6 inhibition potentiates responses to PD-L1/PD-1 cancer immune checkpoint blockade

Victoria Klepsch et al. Nat Commun. .

Abstract

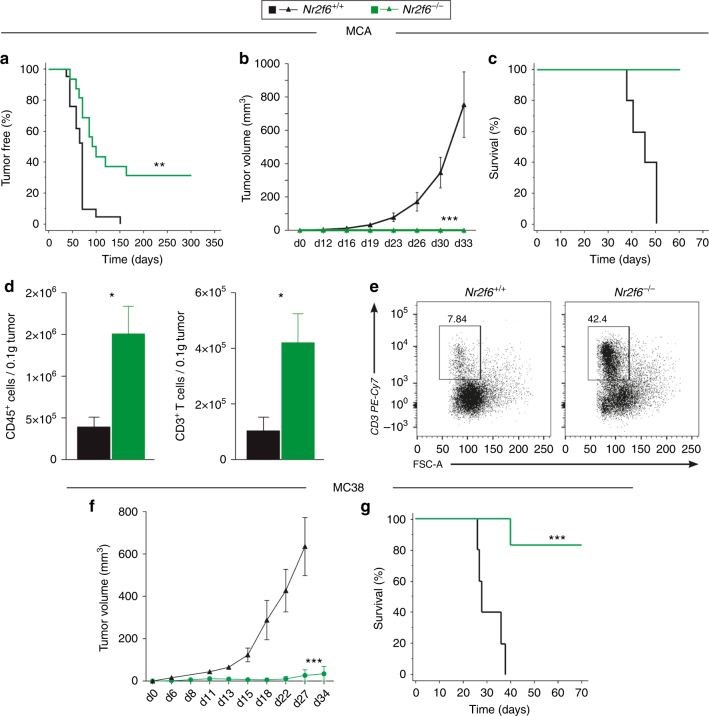
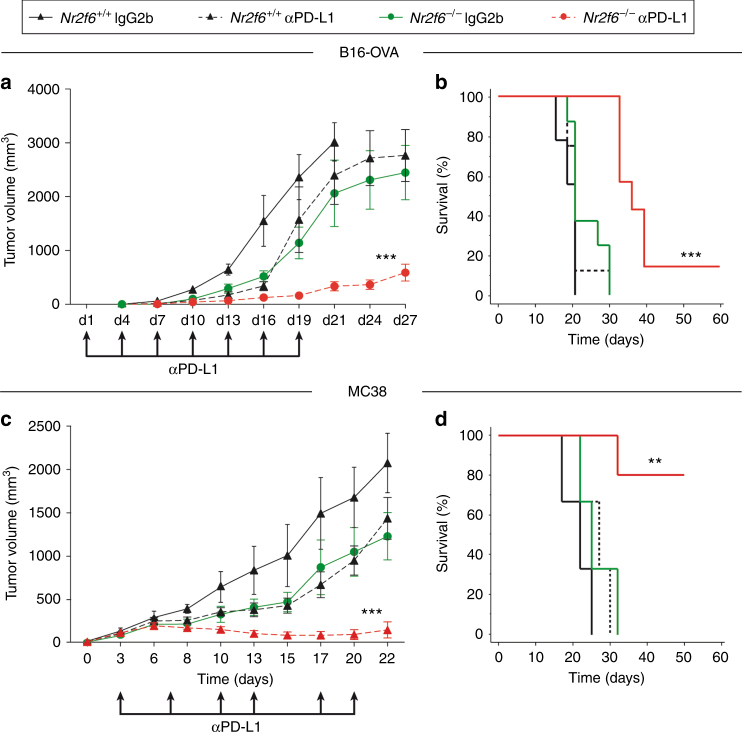
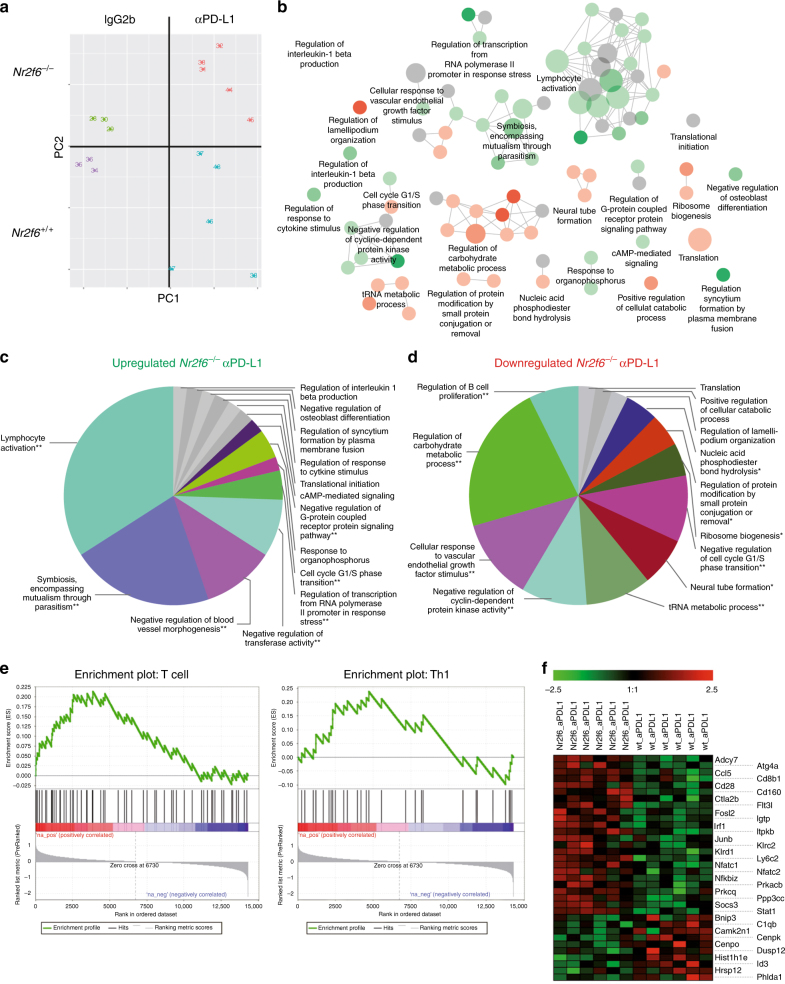
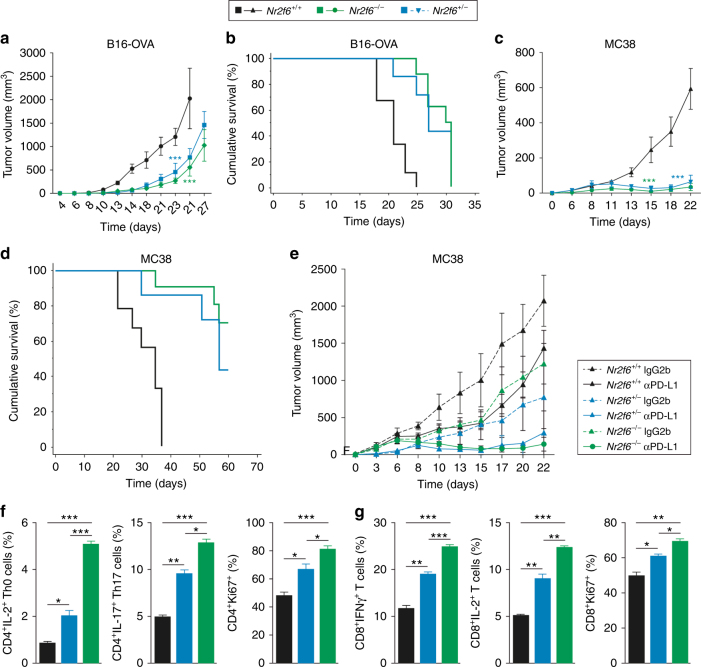
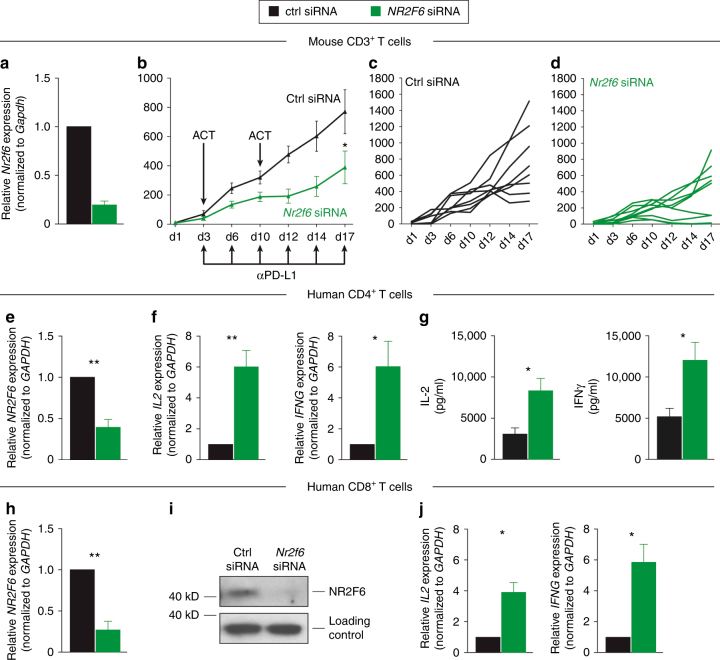
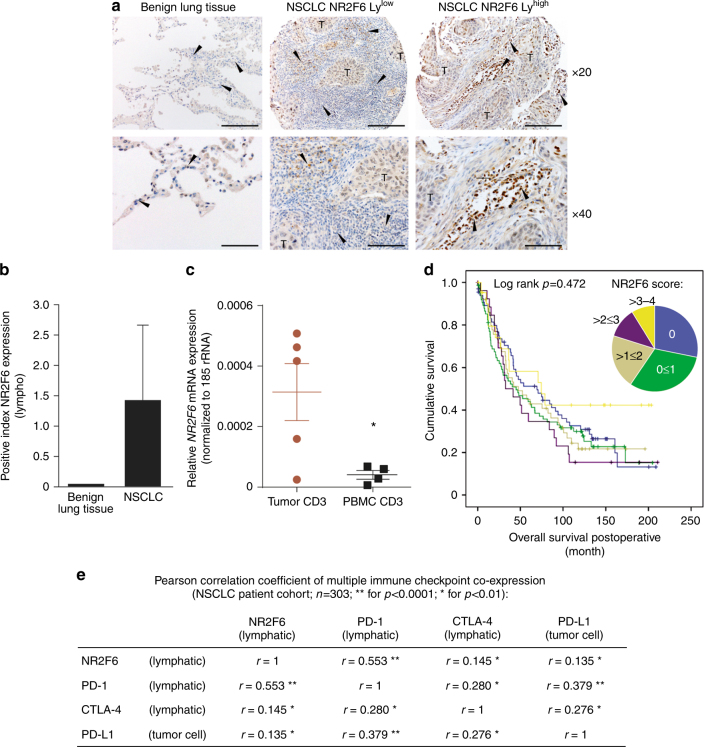
Analyzing mouse tumor models in vivo, human T cells ex vivo, and human lung cancer samples, we provide direct evidence that NR2F6 acts as an immune checkpoint. Genetic ablation of Nr2f6, particularly in combination with established cancer immune checkpoint blockade, efficiently delays tumor progression and improves survival in experimental mouse models. The target genes deregulated in intratumoral T lymphocytes upon genetic ablation of Nr2f6 alone or together with PD-L1 blockade reveal multiple advantageous transcriptional alterations. Acute Nr2f6 silencing in both mouse and human T cells induces hyper-responsiveness that establishes a non-redundant T-cell-inhibitory function of NR2F6. NR2F6 protein expression in T-cell-infiltrating human NSCLC is upregulated in 54% of the cases (n = 303) and significantly correlates with PD-1 and CTLA-4 expression. Our data define NR2F6 as an intracellular immune checkpoint that suppresses adaptive anti-cancer immune responses and set the stage for clinical validation of targeting NR2F6 for next-generation immuno-oncological regimens.


Conflict of interest statement

The authors declare no competing interests.

Figures

Fig. 1
Fig. 1
Nr2f6−/− mice reject transplantable chemically and induced subcutaneous tumors. a Wild-type (n = 15) and Nr2f6-deficient (n = 18) mice were injected with 200 µg MCA and monitored over 300 days; the percentage of sarcoma-free mice is shown (p = 0.0007, ANOVA). From the MCA-induced pool of mice, several cell lines were generated. Tumor growth (b) and survival (c) of one representative wild-type tumor cell line re-injected into wild-type and Nr2f6−/− mice (n = 6) with 1×10⁶ cells/mouse is shown (p<0.0001, b ANOVA, c log-rank test). d Significantly enhanced absolute cell numbers of tumor-infiltrating CD45+ leukocytes (p = 0.018, unpaired t-test, n = 5) and CD3+ T cells (p = 0.031, unpaired t-test, n = 5) per 0.1 g of tumor tissue in wild-type (black) and Nr2f6−/− (green) mice spontaneously developing chemically induced (MCA) sarcomas. e Representative dot blots of tumor-infiltrating CD3+ T cells from Nr2f6+/+ or Nr2f6−/− mice are depicted. Numbers adjacent to outlined areas indicate the percentage of positive cells relative to parental CD45+ gate. Summary of 2−3 independent experiments is shown and data are expressed as the mean ± SEM. f The kinetics of tumor cell growth in Nr2f6+/+ (n = 12, black) and Nr2f6−/− (n = 6, green) mice subcutaneously injected with 5×10⁴ MC38 colon carcinoma cells (p < 0.0001, ANOVA) as well as g significant survival benefit in Nr2f6−/− by a Kaplan-Meier curve are shown, and statistically analyzed by a log rank test (p = 0.0007, log-rank test)
Fig. 2
Fig. 2
Gene ablation of NR2F6 acts as “sensitizer” for the established immune checkpoint blockade in mouse tumor models in vivo. a Tumor growth curve (p<0.0001, ANOVA, n = 9) and b Kaplan−Meier survival curve (p<0.0001, log-rank test, n = 9) of Nr2f6+/+ and Nr2f6−/− mice that received the high dose of 5×10⁵ B16-OVA tumor cells subcutaneously and were treated either with “mono-therapies” of genetic Nr2f6 inhibition (green, IgG2b) or PD-L1 blockade in wild-type mice (dashed black, employing the established Ab10F.9G2) or treated with a “combination therapy” (red) (n = 8). c Tumor growth (p < 0.0001, ANOVA) and d Kaplan−Meier survival curves (p = 0.0031, log-rank test) of Nr2f6+/+ and Nr2f6−/− mice that received the high dose of 7.5×10⁵ MC38 tumor cells subcutaneously and were treated either with “mono-therapies” of genetic Nr2f6 inhibition (green, IgG2b isotype control, n = 7) or PD-L1 blockade in wild-type mice (dashed black, n = 10, the latter employing the established protocol with neutralizing Ab10F.9G2) or with a “combination therapy” (red, n = 12) (wild-type IgG2b control group, black, n = 5). Results shown are derived from at least two independent experiments. Error bars represent the mean ± SEM
Fig. 3
Fig. 3
Nr2f6 expression alters gene signature of tumor-reactive T cells. a Principal component analyses of the RNA-seq data from pre-sorted CD3+ tumor-infiltrating T cells of Nr2f6+/+ IgG2b (n = 3), Nr2f6+/+ αPD-L1 (n = 5), Nr2f6−/− IgG2b (n = 3) and Nr2f6−/− αPD-L1- (n = 5) treated tumor-bearing mice taken at d14 after tumor injection of 5×10⁵ B16-OVA melanoma cells separates the TILs into four distinct clusters. bd ClueGO analysis of up- and downregulated genes in isolated TILs from combinatorial NR2F6/PD-L1 therapy groups. CD3+ TILs from either Nr2f6+/+ or Nr2f6−/− mice with PD-L1 blockade therapy were isolated, RNA-seq was performed and the significantly differentially expressed genes were subsequently analyzed using ClueGO. The enriched gene ontology terms are shown as functionally grouped nodes in an interconnected network based on their score level. The sizes of the nodes reflect the enrichment significance of the terms, while functionally related groups partially overlap. Terms with up-/downregulated genes are shown in green/red, respectively. The color gradient shows the gene proportion of each group (up- or downregulated group of genes) associated with the term. Equal proportions of the two groups are represented in gray. The pie charts show the enriched groups represented by the most significant term. The sizes of the sections correlate with the number of terms included in a group. The key upregulated pathways (c) in TILs from Nr2f6−/− mice with PD-L1 blockade are: cell-mediated cytotoxicity (p = 0.0001), IFNγ signaling (p = 0.0004), TCR signaling pathway (p = 0.0006), immune system function (p = 0.0009), Wnt signaling pathway (p = 0.0029), type II IFN signaling (p = 0.0042), TNF signaling pathway (p = 0.0045). e GSEA enrichment plot of KEGG endometrial cancer pathway genes of sorted CD3+ TILs from Nr2f6+/+ αPD-L1 versus Nr2f6−/− αPD-L1-treated tumor-bearing mice. Genes in the KEGG endometrial cancer signaling pathway showed significant enrichment in T cells and CD4 Th1 signature (FDR q value=0.006). The top portion of the figure plots the enrichment scores (ES) for each gene, whereas the bottom portion of the plot shows the value of the ranking metric moving down the list of ranked genes. f Heat map showing most prominent deregulated genes: Nfatc1; Nfatc2; Klrc2; Cd48; Klra3; Ppp3cc; Klrd1; Socs3; Stat1; Camk2b; Cd28; Il10; Prkcq; Adcy7; Hectd3; H2-DMa; Dapp1; Rps6kb2; Cybb; Ripk3; Tnfaip3; Prkacb; Zbp1; Junb; Ccl5
Fig. 4
Fig. 4
Heterozygous Nr2f6+/− mice similarly show strong tumor growth benefit. Tumor growth curves of Nr2f6+/+, Nr2f6+/− and Nr2f6−/− mice that received a 1×10⁵ B16-OVA melanoma cells (Nr2f6+/+ (n = 21), Nr2f6+/− (n = 11), and Nr2f6−/− (n = 21)) or c 5×10⁴ MC38 tumor cells (Nr2f6+/+ (n = 16), Nr2f6+/− (n = 5), and Nr2f6−/− (n = 10)) subcutaneously and were monitored three times a week showing a significant tumor growth delay as well as a survival benefit (b-d) in Nr2f6 gene-modulated mice (p<0.0001 for both tumor cell lines, ANOVA). e Tumor growth curves of Nr2f6+/+ (IgG2b n = 5, αPD-L1 n = 10), Nr2f6−/− (IgG2b n = 7, αPD-L1 n = 12) and Nr2f6+/− (IgG2b n = 3, αPD-L1 n = 3) mice injected s.c. with 5×10⁵ B16-OVA melanoma cells and treated with PD-L1 blockade (continuous line) or IgG2b (dashed line) (n = 3–5). Both αPD-L1 treated Nr2f6+/− (p = 0.0179, ANOVA) and Nr2f6−/− (p < 0.0001, ANOVA) showed a significant slower tumor growth when compared to treated wild-type controls. f, g In vitro flow cytometry analysis of isolated CD4+ or CD8+ T cells activated with anti-CD3 mAb (5 µg) and anti-CD28 mAb (1 µg) at d3 from Nr2f6+/+, Nr2f6+/− or Nr2f6−/− mice (n = 3). Analysis of IL-2 and IL-17-producing CD4+ Th0 and Th17 T cells, Ki67+ proliferating CD4+ and CD8+ T cells, and IFNγ as well as IL-2 production of CD8+ T cells. Percentage of positive cells relative to parental gate is shown; experiments were repeated at least three times. Results shown are derived from at least two independent experiments. Error bars represent the mean ± SEM
Fig. 5
Fig. 5
Nr2f6 gene silencing is effective and leads to hyper-responsiveness of T cells. ad Tumor growth effects depend primarily on NR2F6 function in CD3+ T cells. a Mouse Nr2f6 gene silencing is effective in CD3+ T cells (p = 0.002, unpaired t-test). Mouse CD3+ T cells were nucleofected with Nr2f6 siRNA or control siRNA as indicated. Silencing efficacy of Nr2f6 siRNA was analyzed by qRT-PCR and normalized to Gapdh (n = 3). bd Wild-type recipients received 5×10⁵ MC38 tumor cells s.c. and were treated with therapeutic adoptive cell transfers (ACT) of 1×10⁷ CD3+ T cells transfected with control (black, n = 8) or Nr2f6 (green, n = 8) siRNA on d3 and d10 after tumor injection (p = 0.0172, ANOVA). Mice were also treated with 0.25 mg of antibody against PD-L1 (Ab10F.9G2) on the respective days. Single tumor growth curves of wild-type mice receiving ACT of c control siRNA transfected CD3+ T cells or d Nr2f6 siRNA silenced CD3+ T cells. In the Nr2f6 siRNA ACT group, one mouse (11.1%) was able to reject the high tumor burden completely, but all mice of the control siRNA ACT group had to be killed latest on d19. ej Human CD4+ and CD8+ T cells were nucleofected with NR2F6 siRNA or control siRNA as indicated (n = 3). Silencing efficacy of Nr2f6 siRNA was analyzed by qRT-PCR (e CD4+ p = 0.0037, h CD8+ p = 0.002) and immunoblotting (i) of CD8+ T cells. Cytokine production was measured by qRT-PCR after 5 h of PDBu (0.05 µg/ml)/ionomycin (0.5 µg/ml) stimulation and showed significantly elevated levels of IL2 (p = 0.009) and IFNG (p = 0.04) in CD4+ T cells (f) as well as IL2 (p = 0.046) and IFNG (p = 0.05) in CD8+ T cells (i). g Bioplex protein analysis also showed elevated levels of IFNγ (p = 0.019) and IL-2 (p = 0.017) in human CD4+ T cells transfected with Nr2f6 siRNA. Similar results were obtained with non-overlapping Nr2f6 siRNA oligonucleotides. Results shown are derived from at least two independent experiments. Data are presented as the mean ± SEM, analyzed by a two-tailed unpaired Student’s t-test
Fig. 6
Fig. 6
IHC and qRT-PCR analyses of NSCLC tumor biopsies show upregulation of NR2F6 in TILs that may serve as marker of patient stratification. a In patient tumor biopsies, there is significantly upregulated expression of NR2F6 in T cells (marked by arrows) in 54% of the cases (163 of 303 patients). b There is a significantly enhanced expression of NR2F6 in TILs from NSCLC tumor biopsies when compared to benign lung tissue (n = 303 and n = 10, p < 0.001). c Significant higher NR2F6 expression levels (p = 0.038, unpaired t-test) determined by qRT-PCR in CD3+ cells sorted from NSCLC tumor biopsies when compared to PBMC samples. d The number of NR2F6-expressing TILs was defined as categorial variable: 0 = 0%, 1 = 1–25%, 2 = 26–50%, 3 = 51–75% and 4 = 76–100% NR2F6-positive TILs. The number of NR2F6-expressing TILs is not linked to clinical outcome as seen in overall survival of NSCLC patients from these defined staining categories (0–4). e Multiplex IHC analyses showed that the increase in lymphatic NR2F6 expression strongly correlated with lymphatic PD-1 expression (Pearson correlation coefficient r = 0.553, p < 0.001). There was a positive correlation also between lymphatic NR2F6 and lymphatic CTLA-4 (r = 0.145, p < 0.01) and tumor cell PD-L1 (r = 0.135, p < 0.01) expression, respectively

References

    1. Chen DS, Mellman I. Oncology meets immunology: the cancer-immunity cycle. Immunity. 2013;39:1–10. doi: 10.1016/j.immuni.2013.07.012. - DOI - PubMed
    1. Galon J, Angell H, Bedognetti D, Marincola F. The continuum of cancer immunosurveillance: prognostic, predictive, and mechanistic signatures. Immunity. 2013;39:11–26. doi: 10.1016/j.immuni.2013.07.008. - DOI - PubMed
    1. Zitvogel L, Galluzzi L, Smyth M, Kroemer G. Mechanism of action of conventional and targeted anticancer therapies: reinstating immunosurveillance. Immunity. 2013;39:74–88. doi: 10.1016/j.immuni.2013.06.014. - DOI - PubMed
    1. Ali OA, et al. Identification of immune factors regulating antitumor immunity using polymeric vaccines with multiple adjuvants. Cancer Res. 2014;74:1670–1681. doi: 10.1158/0008-5472.CAN-13-0777. - DOI - PMC - PubMed
    1. Horn, L., Reck, M. & Spigel, D. R. The future of immunotherapy in the treatment of small cell lung cancer. Oncologist10.1634/theoncologist.2015-0523 (2016). - PMC - PubMed

Publication types

MeSH terms