. 2018 Apr 18;9(1):1528.
doi: 10.1038/s41467-018-03988-1.

Olfactory inputs modulate respiration-related rhythmic activity in the prefrontal cortex and freezing behavior

Affiliations

Olfactory inputs modulate respiration-related rhythmic activity in the prefrontal cortex and freezing behavior

Andrew H Moberly et al. Nat Commun. .

Abstract

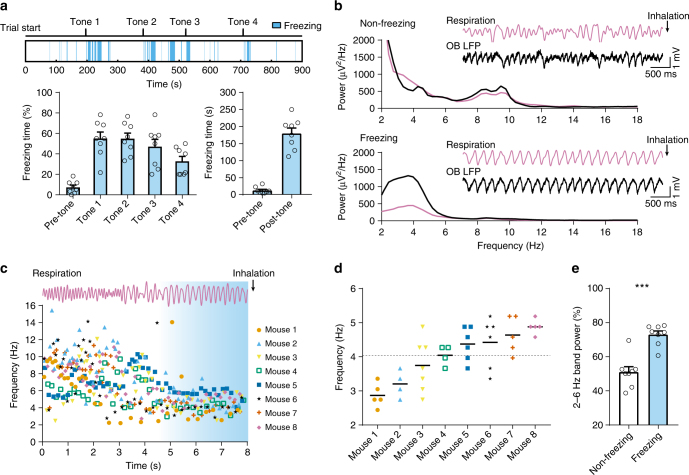
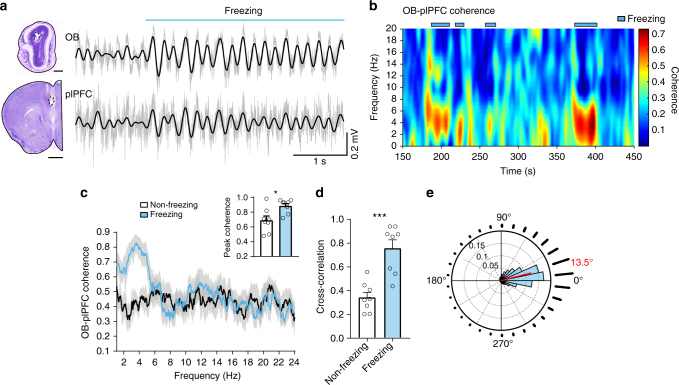
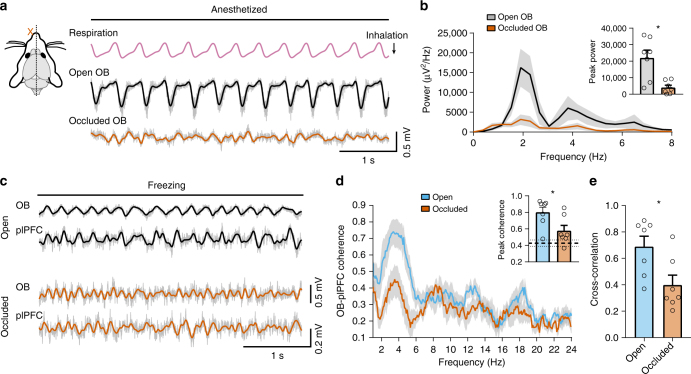
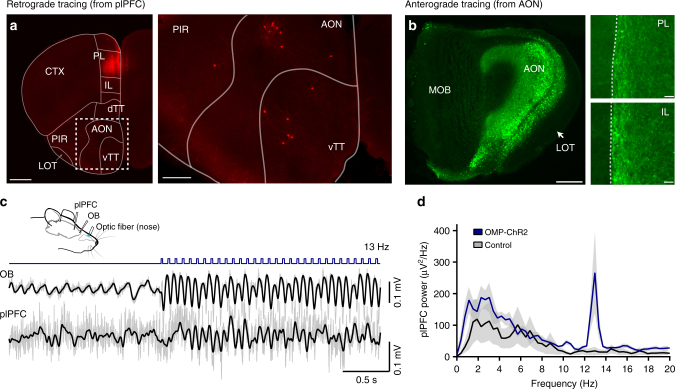
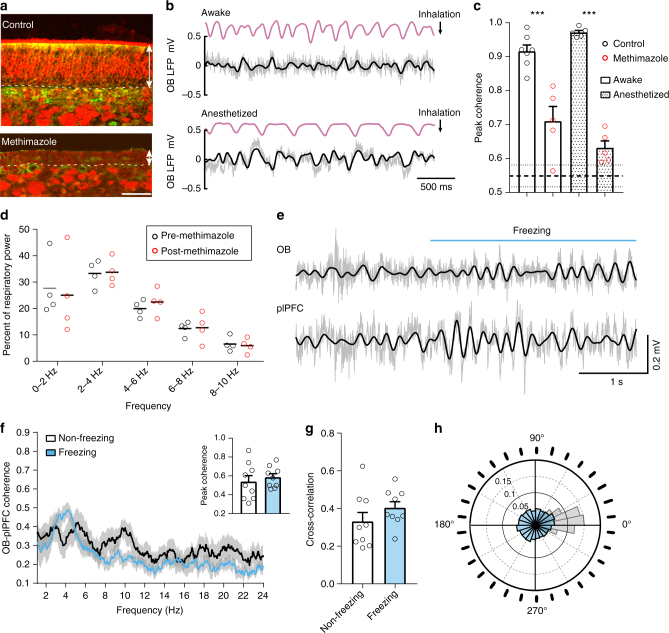
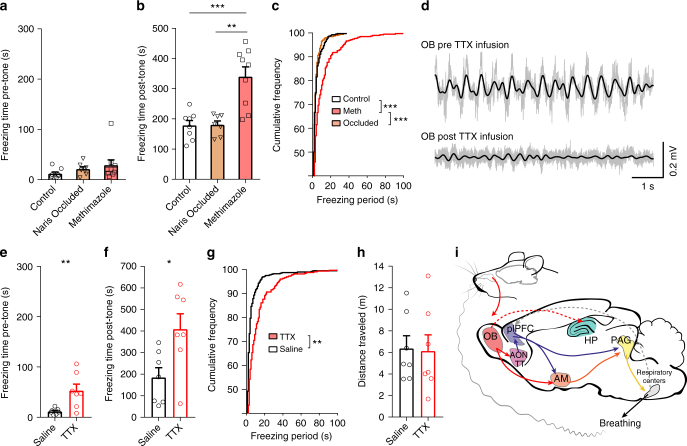
Respiration and airflow through the nasal cavity are known to be correlated with rhythmic neural activity in the central nervous system. Here we show in rodents that during conditioned fear-induced freezing behavior, mice breathe at a steady rate (~4 Hz), which is correlated with a predominant 4-Hz oscillation in the prelimbic prefrontal cortex (plPFC), a structure critical for expression of conditioned fear behaviors. We demonstrate anatomical and functional connections between the olfactory pathway and plPFC via circuit tracing and optogenetics. Disruption of olfactory inputs significantly reduces the 4-Hz oscillation in the plPFC, but leads to prolonged freezing periods. Our results indicate that olfactory inputs can modulate rhythmic activity in plPFC and freezing behavior.


Conflict of interest statement

The authors declare no competing interests.

Figures

Fig. 1
Fig. 1
During fear retrieval, mice breathe at a characteristic frequency (between 2–6 Hz) while freezing. a Top: The full time course of a retrieval session for a single mouse 24 h after fear conditioning to pure tones. Freezing periods are especially prominent after tone presentations, but also happen during inter-stimulus intervals. Bottom left: quantification of freezing behavior for 8 mice expressed as a percentage of time spent freezing in the 60 s period after each tone presentation. The pre-tone freezing is measured in the 60 s period before the first tone. Bottom right: total freezing time in seconds before (pre-tone) and after (post-tone) the first tone onset. b Power spectral density of the thermocouple (downward deflections represent inhalation, applying to all respiration traces) and OB LFP recordings from a single mouse during non-freezing (from the pre-tone baseline, top) and freezing (bottom) periods. Insets show simulatneously recorded, unfiltered thermocoulple and OB LFP signals. c The instananeous respiratory frequency aligned to a freezing period from each mouse. Top: A raw thermocouple trace from an example mouse (Mouse 8). Bottom: The instantaneous (cycle-to-cycle) frequency of either thermocouple signals or low-pass filtered OB LFPs aligned to the onset of a single freezing period (onset at 5 s). d The respiratory frequency of each mouse during continuous freezing episodes longer than 5 s, estimated by the peaks in the power spectrum of either thermocouple signals or low-pass filtered OB LFPs. The overall average for all mice is 4.05 ± 0.13 Hz (indicated by the dashed line). e The percent power in the 2–6 Hz band during non-freezing baseline as compared to freezing periods (51.20 ± 3.22 to 73.23 ± 2.13, n = 8 paired two-tailed Student’s t test t(7) = 9.67, p < 0.001)
Fig. 2
Fig. 2
During freezing, the neural activity in the OB and plPFC is dominated by highly correlated ~4-Hz oscillations. a Example OB and plPFC LFPs during a freezing epoch. Filtered signals (2–6 Hz) are overlaid on raw traces (gray). Nissl-stained coronal brain sections show electrode sites. Scale bars, 0.5 mm top and 1.0 mm bottom. b Time-frequency cohereogram of OB and plPFC LFPs during a portion of a retrieval session in which freezing was observed (marked in blue). High phase coherence emerges during periods of freezing. c Spectral coherence between simultaneously recorded OB and plPFC LFPs during non-freezing (from pre-tone baseline, black) and freezing (blue) periods (mean ± SEM, n = 8 mice). Inset, averaged peak coherence for non-freezing and freezing periods (0.69 ± 0.06 to 0.88 ± 0.03, n = 8, Wilcoxon matched-pairs signed rank test, p = 0.016). d All animals tested showed an increase in the maximum OB-plPFC cross-correlation value from non-freezing to freezing periods (0.34 ± 0. 04 to 0.75 ± 0.07, n = 8, paired two-tailed Student’s t test t(7) = 5.75, p < 0.001). The LFPs were filtered at 2–6 Hz. e Circular distribution of phase differences between OB and plPFC 2–6 Hz signals during freezing. The mean direction of the distribution is 13.5° (red line, with lower 95% confidence limit = 13.0 and upper 95% confidence limit = 14.0, p < 0.001 in one-sample test for mean angle equal to 0°). The phase difference distribution is also visualized as a radial histogram (30 bins) surrounding the polar plot
Fig. 3
Fig. 3
Respiration-entrained olfactory signals contribute to the 4-Hz rhythm in the plPFC. a Unilateral naris occlusion impairs ascending signals from the olfactory system. Occlusion could be confirmed by the reduction of respiration-entrained oscillations in the OB, especially in the anesthetized state. Filtered signals (2–6 Hz) are overlaid on raw traces (gray), which also applies to (c). b Power spectral density of OB LFPs from open and occluded sides under anesthesia. Inset, averaged peak power of the OBs from open vs occluded sides (21987 ± 4716 vs 4993 ± 1452, n = 7, paired two-tailed Student’s t test t(6) = 3.662, p = 0.011). Note that the breathing rate was at ~2 Hz under anesthesia. c Bilateral OB and plPFC LFP recordings from a naris-occluded mouse during freezing in the fear retrieval session. d Spectral coherence between simultaneously recorded OB and plPFC LFPs during freezing periods on the open vs occluded sides (mean ± SEM, n = 7 mice). Inset, averaged peak coherence between the OB and plPFC LFPs for open and closed sides (0.80 ± 0. 06 to 0.58 ± 0.07, n = 7, paired two-tailed Student’s t test t(6) = 3.211, p = 0.018). The average peak coherence between plPFC and shuffled OB signals from the occluded side is 0.42, indicated by the thick dashed line (the two thin dashed lines indicate the standard errors). e The occluded side shows a decrease in the OB-plPFC cross-correlation compared to the open side during freezing (0.69 ± 0.08 open vs 0.40 ± 0.08 occluded, n = 7, paired two-tailed Student’s t test t(6) = 3.353, p = 0.015)
Fig. 4
Fig. 4
Optogenetic stimulation of olfactory sensory neurons in the nose entrains rhythmic activity in the OB and plPFC. a The prelimbic PFC (PL) receives direct inputs from the ipsilateral anterior olfactory nucleus (AON) and ventral taenia tecta (vTT). Focal injection of 0.5 µl CAV2-cre (13 × 1012 GC/ml) into the PL in RosatdTomatof/f reporter mice leads to labeled cell bodies in the AON and vTT, two regions receiving direct inputs from the OB. CTX cortex, PIR piriform cortex, LOT lateral olfactory tract, dTT dorsal taenia tecta. Scale bar: 750 µm, left panel and 250 µm, right panel. b Focal injection of Cre-dependent ChR2-EYFP virus directed to the AON in Vglut1-Cre mice results in labeled fibers in both the prelimbic (PL) and infralimbic (IL) PFC. Note that there is essentially no viral infection in the main olfactory bulb (MOB, left panel) and the projection from AON to the prefrontal cortex is only on the ipsilateral side (right panel). Scale bar: 200 µm, left panel and 30 µm, right panel. The dotted lines mark the midline separating the two hemispheres. c An optical fiber was implanted in the nose of OMP-ChR2 mice to stimulate OSNs. The example shows stimulation at 13 Hz (15 mW, 20 ms), which is distinct from endogenous respiration rhythms. Simultaneous LFP recordings from the OB and plPFC show optical stimulation-entrained neural activity. Filtered signals (2–20 Hz) are overlaid on raw traces (gray). Blue bars mark the laser (473 nm) pulses. d The power spectral density (mean ± SEM, n = 3 mice) of plPFC LFPs shows increased power at 13 Hz, the optical stimulation frequency (blue). The black line shows data from control mice (n = 3, OMPCre/WT without ChR2) that underwent the same procedure as OMP-ChR2 mice
Fig. 5
Fig. 5
Disruption of olfactory inputs decouples OB LFPs from respiration during freezing. a Sections of olfactory epithelia from six-week-old mice. Arrow lines denote the thickness of the olfactory epithelium. Dashed lines mark the basement membrane that separates the olfactory epithelium from the underneath lamina propria. Asterisks mark OMP+ axonal bundles. Scale bar: 50 µm. b Thermocouple and OB LFP recordings from a single mouse following methimazole injection. The OB oscillations no longer faithfully follow respiration, in contrast to control condition (c.f. Fig. 1b top). c Average peak coherence between respiratory signals and OB LFPs (one-way ANOVA F(3,17) = 35.1, Tukey post hoc, awake control vs methimazole, p < 0.001; anesthetized control vs methimazole, p < 0.001). The average peak coherence between respiration and shuffled OB signals is 0.55, indicated by the thick dashed line (the two thin dashed lines indicate the standard errors). d The percent of power in 5 frequency bands of respiration recorded in awake, behaving mice (n = 4) is unchanged following methimazole treatment. Respiratory signals (2 hr) were recorded pre and post methimazole injection in the home cage and analyzed in 10 s epochs. e Example OB and plPFC LFPs during a freezing epoch in a methimazole treated mouse. Filtered signals (2–6 Hz) are overlaid on raw traces (gray). f Spectral coherence between simultaneously recorded OB and plPFC LFPs during non-freezing baseline (black) and freezing (blue) periods (mean ± SEM, n = 9 mice). Inset, averaged peak coherence for non-freezing and freezing periods (0.54 ± 0.06 to 0.58 ± 0.04, n = 9, paired two-tailed Student’s t test t(8) = 0.552, p = 0.596). g Maximum OB-plPFC cross-correlation values during non-freezing and freezing periods (0.33 ± 0. 05 to 0.40 ± 0.03, n = 9, paired two-tailed Student’s t test t(8) = 1.078, p = 0.313). h Circular distribution of phase differences between OB and plPFC 2–6 Hz signals during freezing (Rayleigh test for circular non uniformity z = 2.08, p = 0.125). Data from methimazole treated animals are overlaid on the distribution from control animals (in gray as in Fig. 2e)
Fig. 6
Fig. 6
Disruption of olfactory inputs prolongs freezing periods. a Baseline (pre-tone) freezing time is not significantly different among control (n = 8), unilateral naris occlusion (n = 7) and methimazole treated (n = 9) groups (one-way ANOVA F(2,21) = 1.281, p = 0.299). b Freezing time during the retrieval trial is significantly longer in methimaole treated mice compared to control and naris-occluded animals (one-way ANOVA F(2,21) = 15.61, Tukey post hoc, control vs methimazole p < 0.001, naris occluded vs methimazole p < 0.001). c Cumulative frequency distributions show methimazole treated animals have an increased frequency of longer freezing periods compared to control or naris-occluded mice (p < 0.001, two-sample Kolmogorov–Smirnov test). d Example traces of OB LFPs, 2–6 Hz filtered traces are overlaid on raw traces (gray) before (pre TTX) and 30 min after intrabulbar injection of TTX (post TTX). e Baseline (pre-tone) freezing time is significantly longer in TTX infused mice (53.71 ± 13.13 s, n = 7) compared to saline infused mice (n = 7) (12.43 ± 2.27 s, n = 7; unpaired two-tailed Student’s t test t(12) = 3.099, p = 0.009). f Freezing time is significantly longer in TTX infused mice (410.60 ± 71.39 s) compared to saline infused mice (186.60 ± 45.59 s; unpaired two-tailed Student’s t test t(12) = 2.645, p = 0.021). g Cumulative frequency distributions show TTX infused animals have an increased frequency of longer freezing periods compared to saline infused mice (p = 0.01 in two-sample Kolmogorov–Smirnov test). h Total distance traveled prior to the tone onset is not different in saline (6.40 ± 1.18 m) and TTX infused mice (6.16 ± 1.51 m; unpaired two-tailed Student’s t test t(12) = 0.127, p = 0.901). i Entrained olfactory inputs modulate the rhythmic activity of the conditioned fear circuit. Solid and dotted lines denote direct and indirect connections, respectively. Note that many connections are reciprocal, which are not shown for simplicity. AM amygdala, HP hippocampus, PAG periaqueductal gray

References

    1. Feldman JL, Del Negro CA, Gray PA. Understanding the rhythm of breathing: so near, yet so far. Annu Rev. Physiol. 2013;75:423–452. doi: 10.1146/annurev-physiol-040510-130049. - DOI - PMC - PubMed
    1. Yackle K, et al. Breathing control center neurons that promote arousal in mice. Science. 2017;355:1411–1415. doi: 10.1126/science.aai7984. - DOI - PMC - PubMed
    1. Buonviso N, Amat C, Litaudon P. Respiratory modulation of olfactory neurons in the rodent brain. Chem. Senses. 2006;31:145–154. doi: 10.1093/chemse/bjj010. - DOI - PubMed
    1. Carlson KS, Dillione MR, Wesson DW. Odor- and state-dependent olfactory tubercle local field potential dynamics in awake rats. J. Neurophysiol. 2014;111:2109–2123. doi: 10.1152/jn.00829.2013. - DOI - PubMed
    1. Fontanini A, Spano P, Bower JM. Ketamine-xylazine-induced slow (1.5 Hz) oscillations in the rat piriform (olfactory) cortex are functionally correlated with respiration. J. Neurosci. 2003;23:7993–8001. - PMC - PubMed

Publication types

LinkOut - more resources